23
© Springer Nature Switzerland AG 2019
H. Hop, C. Wiencke (eds.), The Ecosystem of Kongsfjorden, Svalbard, Advances in Polar Ecology 2, https://doi.org/10.1007/978-3-319-46425-1_2
The Atmosphere Above Ny-Ålesund:
Climate and Global Warming, Ozone and Surface UV Radiation
Marion Maturilli, Inger Hanssen-Bauer, Roland Neuber, Markus Rex, and Kåre Edvardsen
Abstract The Arctic region is considered to be most sensitive to climate change, with warming in the Arctic occurring considerably faster than the global average due to several positive feedback mechanisms contributing to the “Arctic amplifica- tion”. Also the maritime and mountainous climate of Svalbard has undergone changes during the last decades. Here, the focus is set on the current atmospheric boundary conditions for the marine ecosystem in the Kongsfjord area, discussed in the frame of long-term climatic observations in the larger regional and hemispheric context.
During the last century, a general warming is found with temperature increases and precipitation changes varying in strength. During the last decades, a strong seasonality of the warming is observed in the Kongsfjord area, with the strongest temperature increase occurring during the winter season. The winter warming is related to observed changes in the net longwave radiation. Moreover, changes in the net shortwave radiation are observed during the summer period, attributed to the decrease in reflected radiation caused by the retreating snow cover.
Another related aspect of radiation is the intensity of solar ultra-violet radiation that is closely coupled to the abundance of ozone in the column of air overhead. The long-term evolution of ozone losses in the Arctic and their connection to climate change are discussed.
Keywords Arctic climate change · Surface temperature · Surface radiation budget
· Stratospheric ozone
M. Maturilli (*) · R. Neuber · M. Rex
Alfred Wegener Institute, Helmholtz Centre for Polar and Marine Research, Potsdam, Germany
e-mail: Marion.Maturilli@awi.de I. Hanssen-Bauer
Norwegian Meteorological Institute, Oslo, Norway K. Edvardsen
Norwegian Institute for Air Research, Kjeller, Norway
2.1 Introduction
Like anywhere else on the globe, the atmosphere in the Kongsfjord area, Svalbard, is affected by global climate change. Warming of the climate system is unequivocal, and since the 1950s, many of the observed changes are unprecedented over decades to millennia. The atmosphere and ocean have warmed, the amounts of snow and ice have diminished, sea level has risen, and the atmospheric concentrations of green- house gases have increased (IPCC 2013).
The Arctic region is considered to be most sensitive to climate change. Warming in the Arctic occurs considerably faster than the global average (IPCC 2007) due to various feedback mechanisms contributing to the “Arctic amplification”. Climate model simulations suggest that the largest contribution can be attributed to tempera- ture feedbacks (Pithan and Mauritsen 2014). Furthermore, the snow/sea ice – albedo feedback is a well-known concept (Curry et al. 1995; Lindsay and Zhang 2005;
Screen and Simmonds 2010), which gains importance as climatic warming has caused a substantial decrease in the extent and thickness of Arctic sea ice (Cavalieri and Parkinson 2012). Over the last two decades, the Greenland ice sheet has been losing mass, glaciers have continued to shrink, and Arctic sea ice and Northern hemisphere springtime snow cover have continued to decrease in extent (IPCC 2013). Large parts of the excess energy absorbed by the climate system have been stored in the oceans, leading to an increase in upper ocean temperature and facilitat- ing evaporation of water vapor to the atmosphere. Water vapor, clouds, and their radiative feedbacks are known as important factors in the Arctic climate system (Curry et al. 1996; Francis and Hunter 2007; Bennartz et al. 2013). Moreover, changes in the atmospheric circulation result in a strengthening of meridional heat transport to the high latitudes and further account for Arctic warming (Graversen et al. 2008; Zhang et al. 2008), along with the possibility that Arctic atmospheric circulation itself is modified by the strong warming (Francis et al. 2009; Overland and Wang 2010). In the upper atmosphere, stratospheric water vapor, ozone, and other greenhouse gases contribute with chemical and dynamical feedbacks in the coupled system on the global scale (e.g. Garcia and Randel 2008; Dessler et al.
2013).
Furthermore, the ozone layer is modulating the ultra-violet (UV) radiation reach- ing the surface. While radiative fluxes in both the shortwave and longwave range generally play a key role in the complex Arctic region, the incoming solar radiation determines the biological activity in the Arctic marine environment. Photoautotrophic organisms need sunlight for the process of photosynthesis, and e.g. the diel vertical migration of zooplankton is controlled by the incoming irradiance (Wallace et al.
2010), even in polar night conditions (Berge et al. 2009). The Kongsfjord marine environment and ecosystem structure are thus conditioned by the climatological situation and the available radiation at the surface. The following sections describe the climatological aspects of the Kongsfjord area, and emphasize on surface radia- tion observations to provide a setting for the biological aspects that are discussed in the chapters thereafter.
2.2 Recent Climate in Ny-Ålesund, Kongsfjorden, Svalbard
The Svalbard archipelago is located in the high Arctic, yet due to the North Atlantic Current moderating temperatures it has a significantly warmer climate than other environments at the same latitude. Situated North of the Arctic circle, the Svalbard archipelago experiences polar day in summer and polar night in winter. In Kongsfjorden at the west coast of Svalbard (Spitsbergen), atmospheric observations are centered in and around the settlement of Ny-Ålesund. Though generally, polar night (polar day) conditions in the Kongsfjord are given between 24 October and 18 February (18 April and 24 August), respectively, direct sunlight reaches Ny-Ålesund only between 8 March and 8 October due to mountains in the South. The complex orography of mountains and glaciers also affects atmospheric processes on the micro- and mesoscale. With both coastal and mountainous influences, Ny-Ålesund may not be a representative location for the general Arctic, but provides evidence for general Arctic variability and change when looking at synoptic time scales.
The Kongsfjord climate is characterized by the superposition of synoptic and mesoscale effects. Typically, Svalbard is situated along the main track of cyclones transporting warm and humid air from lower latitudes to the North. Generally, there are fewer shorter and stronger cyclones in winter, and more numerous longer-lived, but weaker, cyclones in summer in the Arctic region (Zhang et al. 2004). Monthly mean station-level pressure in Ny-Ålesund is generally above 1000 hPa, and above 1010 hPa during the sun-lit period (Maturilli et al. 2013). As the cyclonic activity is lower in summer, pressure change from day-to-day is lower than in spring or autumn. The maximum of day-to-day pressure variability occurs in winter when passing cyclones persist shorter but with larger amplitudes in pressure gradient (Maturilli et al. 2013).
The orography of the Kongsfjord area has a large impact on the local climate.
The surrounding mountains frequently cause the generation of orographically induced clouds, and modify the wind field by channeling the air flow along the fjord axis within the lowermost kilometer of the atmosphere. Also the occurrence of sea breeze and katabatic outflow from glaciers act on the local meteorology. Thus, atmospheric parameters may be different from the Ny-Ålesund observations when looking at different locations along Kongsfjorden.
2.2.1 Temperature
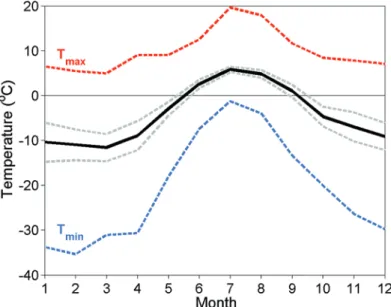
During the year, the land surface around Ny-Ålesund changes considerably due to the presence or absence of the snow cover. In summer, the surface around Ny-Ålesund exhibits its tundra vegetation, as temperatures rise above the freezing point and the snow-cover vanishes. The melt-season starts around May–June, with the actual onset of melting depending on the individual synoptic situation of each year. The annual cycle of the monthly mean surface air temperature in Ny-Ålesund is shown
in Fig. 2.1, from temperature data measured at 2 m height on a meteorological tower operated by the Alfred Wegener Institute since August 1993. As indicated by the standard deviation, the inter-annual temperature variability is small during the sum- mer months, but the minimum temperature still allows for single snow events.
Usually, the snow cover remains stable only after October. During the polar night, the inter-annual temperature variability is much larger due to the dynamics and strength of the cyclonic systems. In winter, the air temperature is very sensitive to the synoptic wind direction as the large-scale temperature gradient is much stronger than in summer, so winters with common northerly-easterly winds are much colder than winters with common southerly winds. The Ny-Ålesund maximum tempera- ture indicates the possibility of rain also during the winter months, and indeed dur- ing recent winters several periods with rain have occurred.
2.2.2 Wind
Throughout all seasons, the common wind direction in Ny-Ålesund is along the fjord axis from the inland to the coast (Førland et al. 1997a). While the synoptic wind field is present above roughly 800 m altitude, the Spitsbergen mountains mod- ify the air flow in the lowest atmospheric kilometer, resulting in a complex wind field and causing a decoupling from the large scale synoptic flow (Maturilli and
Fig. 2.1 Annual cycle of the monthly mean temperature (black line) ± 1 standard deviation (grey lines), and the daily minimum and maximum temperatures (blue and red lines, respectively) obtained from surface air temperature measurements between August 1993 and July 2014. (Update of Maturilli et al. 2013)
Kayser 2017). In the surface layer, the prevailing wind direction in Ny-Ålesund is south-easterly, with the flow from 120° along Kongsfjorden due to drainage winds transporting cold air from the Kongsvegen glacier located about 10 km to the east- south- east of Ny-Ålesund (Beine et al. 2001). Furthermore, the channeled wind flow along the fjord is locally superimposed by mesoscale air flow along valleys or katabatic winds from glaciers (Burgemeister 2013). Thermal land-sea breeze circu- lation and mechanical wind channeling are the leading processes in the modulation of the local wind field (Esau and Repina 2012). Also the formation of a cold-pool over ice-covered parts of the fjord may play a role. In Ny-Ålesund, sea breeze from northern directions arrive on short time scales during the summer months (Maturilli et al. 2013). Overall, independent of the synoptic scale flow the wind flow in the lowermost atmosphere is mainly along the fjord axis, but local variations are likely to occur and will differ considerably for different locations along the fjord (e.g.
Mazzola et al. 2016). Also, variations in the wind speed may lead to snow redistri- bution, with local differences in snow cover duration and according ecological impact. The wind speed also affects the generation of mechanical turbulence in a stably stratified atmospheric boundary layer, with impact on the surface fluxes.
2.2.3 Humidity and Precipitation
In the Svalbard fjord landscape, the combined effect of large-scale humidity advec- tion and local processes result in a prevailing specific humidity inversion (Vihma et al. 2011) and also drive the amount of surface atmospheric humidity. Related to temperature, the summer months are more humid than the winter months. In relative humidity, the seasonal variation is small with monthly mean values between 60%
and 85% (Maturilli et al. 2013). Yet, absolute values reveal the dryness of Arctic air, with the maximum in monthly average H2O mixing ratio of about 4.7 g kg−1 in July, while the winter months (December/January/February) exhibit an average H2O mixing ratio of about 1.4 g kg−1 (Maturilli et al. 2013).
The measurement of precipitation poses serious challenges in the Arctic environ- ment due to drifting or blowing snow. While fake precipitation caused by solely blowing snow can be excluded through quality control, the combination of precipi- tation and blowing snow causes problems. Consequently, precipitation records from the Arctic are influenced by substantial measuring errors, e.g. caused by undercatch of the precipitation gauges (Førland and Hansen-Bauer 2003).
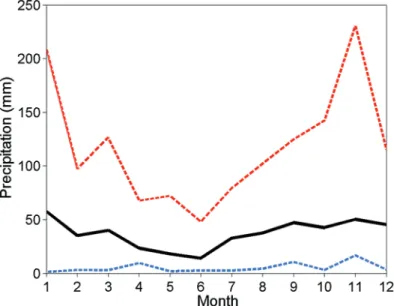
As evident from the annual cycle in temperature (Fig. 2.1), both rain and snow (mixed precipitation) may occur in Ny-Ålesund at any time of the year. The annual cycle of the monthly precipitation amount in Ny-Ålesund, as measured by the Norwegian Meteorological Institute, is shown in Fig. 2.2. In the Svalbard region, most of the precipitation occurs in connection with cyclones approaching from the Southwest-Northwest sector (Førland et al. 1997a). Generally, the mountain regions receive the greatest amounts of precipitation and the inner fjord region the least, but orography causes local differences (Førland et al. 1997a). Precipitation is usually
increasing with increasing altitude due to the lifting and consequent cooling of air masses over hills and mountains (Førland 1979). Local precipitation also depends on the large-scale wind direction. Førland et al. (1997b) found that for large-scale winds from South and Southwest, the precipitation at the glacier Austre Broggerbreen was about 60% higher than in Ny-Ålesund, while for winds from northwest, Ny-Ålesund got more precipitation than the stations at the glacier.
2.2.4 Radiation
While the described meteorological parameters account for the climatological back- ground of the Kongsfjord area, incoming radiation is particularly important for the biogeochemical activity of the ecosystem. With the increasing research activities in Ny-Ålesund in the late 1980s, surface radiation measurements have been set up by the Alfred Wegener Institute, contributing to the Baseline Surface Radiation Network (BSRN) since August 1992. The set-up includes the measurement of direct solar radiation by pyrheliometer, diffuse, global and reflected (downward and upward, respectively) shortwave radiation by pyranometers, as well as up- and downward longwave radiation by pyrgeometers (Maturilli et al. 2015). Here, long- wave radiation refers to the spectral range 3.5–50 μm, while the broadband short- wave measurements cover the spectral range 200–3600 nm. In Ny-Ålesund, additional filtered shortwave radiation measurements are operated in the wavelength ranges 300–370 nm and 695–2800 nm.
Fig. 2.2 Annual cycle of the monthly mean precipitation (black line), and the observed minimum and maximum monthly precipitation amount (blue and red lines, respectively), obtained between August 1993 and July 2014
The photosynthetically active radiation (PAR) refers to the spectral range that is effective in the process of photosynthesis, commonly defined from 400 to 700 nm.
With the available BSRN measurements in Ny-Ålesund, it is possible to infer the PAR by subtracting the filtered radiation measurements from the broadband global radiation, as the energetic contribution of the remaining shortwave 200–300 nm and longwave 2800–3600 nm ranges to the broadband irradiances are negligible. The resulting BSRN-PAR refers to the spectral range 370–695 nm, and its annual mean cycle is shown in Fig. 2.3. The monthly mean noon values are listed in Pavlov et al.
(Chap. 5). As a spectral subset, the BSRN-PAR closely follows the global radiation measurements. The main contribution to the large quantitative difference between global radiation and PAR is attributed to the subtracted longer wavelength range (695–2000 nm) which has 10 times larger irradiance values than the subtracted shorter wavelength range (300–370 nm). Examples for the daily PAR distribution on a clear and a cloud-covered day are given in Pavlov et al. (Chap. 5) in the context of resulting underwater radiation and its impact on the marine ecosystem.
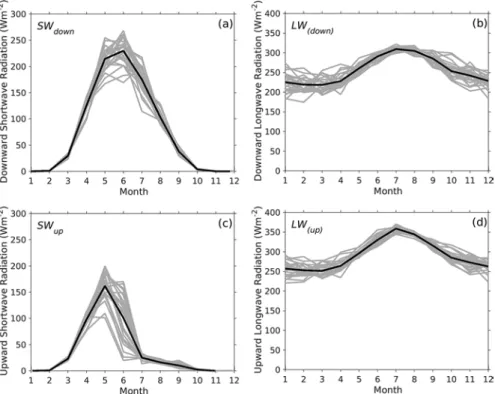
Figure 2.4 shows the annual cycle of the various surface radiation parameters as measured by the BSRN station in the years 1993–2017. The global radiation basi- cally depends on the solar elevation angle and the cloud cover. During the 25-year observation period, the monthly mean global shortwave radiation SWdown (Fig. 2.4a) reveals a large inter-annual variability during the summer months, caused primarily by the different occurrence of clouds. The reflected radiation (upward shortwave radiation, Fig. 2.4c) results from the incoming global radiation and the surface
Fig. 2.3 Phytosynthetically active radiation (PAR) in the wavelength range 370–695 nm, as retrieved from BSRN pyranometer measurements in the years 1993–2017 (grey lines for all years of observation, black line for overall mean)
reflectivity. Here, the largest inter-annual variability is found for the snow melt months May, June and July, as the largest change in surface reflectivity occurs with the change from snow cover to tundra ground. Both shortwave components exhibit a distinct annual cycle related to the Earth’s axial tilt.
As the thermal radiation components are temperature dependent, their annual cycle resembles very much the annual cycle of temperature. The amount of upward longwave radiation (Fig. 2.4d) is further controlled by the surface texture and state, while the downward longwave radiation (Fig. 2.4b) is additionally modified by the presence of radiative active components in the atmosphere, e.g. clouds, humidity, and greenhouse gases. Although the absolute values of the longwave radiation com- ponents are smaller during the dark period, the inter-annual and month-to-month variability is much larger due to the large winter variability in atmospheric tempera- ture and humidity, as well as cloudiness and the related radiative effects.
The described surface radiation parameters add up to the surface net radiation budget RADnet = SWnet + LWnet = (SWdown − SWup) + (LWdown − LWup) that describes the net flux of radiative energy at 2 meters above the terrestrial surface (Fig. 2.5).
In the absence of shortwave radiation during the polar night period, net radiation
Fig. 2.4 Ny-Ålesund monthly mean values (grey lines for single years 1993–2017, black line for overall mean) for downward shortwave radiation SWdown (a), downward longwave radiation LWdown
(b), upward shortwave radiation SWup (c) and upward longwave radiation LWup (d), respectively.
(Update of Maturilli et al. 2015)
budget is given by the longwave net radiation only. Thus, the net radiation budget is negative during winter, as the upward thermal radiation overwhelms the down- ward thermal radiation. Only with the returning solar radiation during the sun-lit period and consequent positive shortwave net radiation, the net radiative budget increases and in the long-term mean is positive between April and August. The individual net radiation budget obviously depends on the persistence of the snow cover and on cloudiness. Overall, the annual mean net radiation budget in Ny-Ålesund has positive values for more than a decade, with a total average of 4.8 Wm−2 in the period 1993–2017. Together with sensible and latent heat fluxes, the net radiation budget contributes to the surface energy budget.
2.2.5 Surface Energy Budget (SEB)
Kongsfjorden is surrounded by mountainous terrain, characterized by tundra, gla- ciers, soil and rock fields, and local permafrost ground. Clearly, the formation and melting of a snow pack is the characteristic feature in the annual course of the Svalbard landscape. The snow cover has a considerable influence on the surface energy balance by changing the surface albedo and affecting the sensible and latent heat exchange between the surface and the atmosphere. For the terrestrial ecosys- tem, the surface energy balance is of crucial importance. Combined measurements
Fig. 2.5 Ny-Ålesund 25-year average monthly mean values of the shortwave net radiation [SWnet = SWdown− SWup] (blue line), the longwave net radiation [LWnet = LWdown− LWup] (red line), and the net radiation budget [RADnet = SWnet + LWnet] (black line) +/− 1σ standard deviation of monthly means (dotted lines, respectively). (Update of Maturilli et al. 2015)
of radiation, sensible and latent heat flux, as well as ground heat flux and other related parameters have been performed at several sites in the vicinity of Ny-Ålesund (e.g. Harding and Lloyd 1998; Boike et al. 2003, 2018). Analysing the annual cycle of the surface energy budget at the Bayelva site close to Ny-Ålesund, Westermann et al. (2009) found that during the summer months, the net shortwave radiation is the predominant energy source, while turbulent processes and the heat flux in the ground cause a cooling of the surface. For the months of July and August, they attributed 15% of the net radiation involved in the seasonal thawing of the soil active layer. During the dark winter period, the dominant energy loss of the surface is attributed to net longwave radiation, mainly compensated by the sensible heat flux and also by the ground heat flux originating from the refreezing of the active layer.
While latent heat fluxes are found insignificant for the average surface energy bud- get when the surface is covered by snow, strong evaporation is observed during the snow melt and snow free period, leading to a compensation of the sensible heat fluxes by the latent heat fluxes when regarding the annual average (Westermann et al. 2009). Overall, the annual cycle of the surface energy budget at the Bayelva site is characterized by distinct features grouped in six seasons by Westermann et al.
(2009), starting with summer season when the ground is snow free and the short- wave radiation dominates the SEB. In the following autumn season, the snow layer is formed and the shortwave-dominated SEB is in transition to the subsequent dark season which is dominated by the longwave radiation. With the returning sunlight after polar night, the shortwave radiation increases again during the light winter season, yet its influence on the SEB is small due to the high surface albedo of the remaining snow cover and the large zenith angles. After this period with the lowest soil and skin temperatures, the growing importance of the shortwave radiation and the increasing temperature define the premelt season, which is followed by the snow melt season when the bare tundra surface appears while the incoming shortwave radiation is largest.
Generally, the presence or absence of a snow layer and thus the timing of snow melt and resulting albedo changes are main factors for the surface energy budget.
Horizontal heterogeneity of the terrain, the soil composition, the surface structure and also irregular snow accumulation patterns need to be taken into account when applying radiative, sensible or latent heat flux measurements for ecological studies.
2.3 Observed Climate Change in Ny-Ålesund and Svalbard
The above given climatological description elucidates the mean atmospheric state in Ny-Ålesund during the recent two decades. Yet, global change and the effect of Arctic amplification are detected also in the Svalbard region, affecting the current Kongsfjord climate.
Since 1901 almost the whole globe has experienced surface warming. However, the warming has not been linear, since most warming occurred in two periods:
around 1900 to around 1940 and around 1970 onwards (IPCC 2013). While the early twentieth century warming was mostly predominant in the Atlantic region (Overland et al. 2004), the more recent warming is global in nature, persisting over the whole Arctic. In Europe, the Svalbard Archipelago is the region that has experi- enced the greatest temperature increase during the past three decades (Nordli et al.
2014).
The detection of climate trends is a complex issue that strongly depends on mea- surement uncertainties and data homogeneity. Inhomogeneities in meteorological long-term series may be caused by e.g. relocations of sensors, changed environment (buildings etc) and instrumental improvements, (Førland et al. 1997a). In Ny-Ålesund, synoptic measurements of temperature have been performed at the same site since 1975, but by combining with earlier measurements at Isfjord Radio, homogenized, composite temperature series are established for Ny-Ålesund back to 1934 (Førland et al. 1997a, 2011). An even longer time series has been established known as the Svalbard Airport composite series, reaching back to 1898 by merging historical data from various Svalbard sites (Nordli et al. 2014).
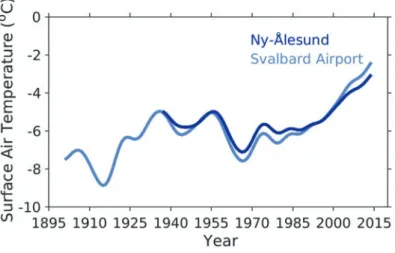
Low-pass filtered updated composite temperature series for Ny-Ålesund and the Svalbard Airport are shown in Fig. 2.6. The series reveal long-term variability with a minimum in the 1910s. The early twentieth century warming from about 1920 to the middle of the century is obvious from the Svalbard Airport temperature record- ing, with a peak in the 1930s and another one following in the late 1950s detected in both time series. Since the late 1960s, temperature has increased rapidly, and the present regime of Spitsbergen temperatures, which covers the years 2005 to present, is the warmest one ever recorded (Nordli et al. 2014).
Despite the large variability, significant positive trends over the whole period were detected for annual as well as seasonal means. Regarding the annual mean, the
Fig. 2.6 Low-pass filtered annual mean surface air temperature for the composite series Ny-Ålesund (dark blue line) and Svalbard Airport (light blue line)
linear trend of the long-term Svalbard Airport composite series is 3.1 K per century, whereas the largest trend is in spring at 4.3 K per century.
However, climatic time series often have trends for which linear regression is not a good approximation (e.g. Seidel and Lanzante 2004). The residuals from a linear fit in time often do not follow a simple autoregressive or moving average process, and linear trend estimates are dependent on method and easily change when recal- culated or when new data are added, especially for short time series. When linear trends for two parts of a longer time series are calculated separately, the trends cal- culated for the shorter periods may be very different (even in sign) from the trend in the full period, caused by decadal scale variability. Obviously, when considering the much shorter time frame of the Ny-Ålesund BSRN measurements during the last two decades, the annual mean temperature increase is much larger compared to other parts of the longer time series (Fig. 2.6). Yet, as polar ecological research in Kongsfjorden is mostly operated since 1993, the focus is now set on the last two decades when discussing temperature and radiation changes.
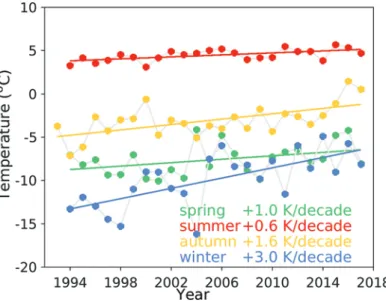
The surface meteorological measurements at the BSRN site are operated since August 1993, and linear regression of the annual mean temperature for the years 1994–2017 gives a temperature increase for this period of 1.6 ± 0.7 K per decade (update of Maturilli et al. 2013). Yet, the observed warming is more complex when looking at the different seasons (Fig. 2.7), including data until 2017. While the considerable temperature increase in spring of about 1.0 ± 1.4 K per decade is sta- tistically insignificant due to the large scatter of the data, the moderate summer warming of 0.6 ± 0.5 K per decade and the larger autumn warming of 1.4 ± 1.2 K
Fig. 2.7 Ny-Ålesund seasonal mean surface air temperature from BSRN site August 1993 to December 2017 for spring (green dots), summer (red dots), autumn (yellow dots), and winter (blue dots), with the linear regression (colored lines, respectively). (Update of Maturilli et al. 2015)
per decade are statistically more stable, respectively. By far the largest part of the annual mean temperature increase accounts for the winter period, showing a sea- sonal temperature increase of 3.0 ± 2.0 K per decade (update of Maturilli et al.
2015). Though featuring a large scatter of the data, the winter months obviously provide the main contribution to the observed warming during the recent 25 years.
A very strong winter warming is also identified for the latest decades at other sta- tions of the Svalbard region (Førland et al. 2011). Furthermore, different climate model simulations show a pronounced seasonality of polar warming amplification with largest polar surface warming in winter (Lu and Cai 2009).
The winter season is characterized by polar night conditions and, accordingly, the absence of solar radiation. Thus, radiative effects by shortwave radiation can be excluded during the winter months, while longwave radiation provides the only contribution to the net radiative budget. A major source is the terrestrial radiation emitted from the Earth’s surface, detected as longwave upward radiation and depen- dent on the properties of the snow pack. On the other hand, the atmosphere absorbs and emits thermal radiation, detected on the surface as longwave downward radia- tion. In Ny-Ålesund, both longwave components have increased considerably dur- ing the winter seasons since 1993/1994 (Maturilli et al. 2015). The increase in terrestrial radiation is directly linked to the observed surface air temperature increase, while the even stronger increase in longwave downward radiation conse- quently is related to changes within the atmospheric column above Ny-Ålesund.
Such an increase of the atmospheric longwave radiation emission may be caused by various factors, like e.g. an increase in atmospheric humidity, changes in the cloud cover and properties, a general increase in atmospheric column temperatures, and of course a combination of those. Increasing greenhouse gases seem to be less relevant in this context as their effect should be present throughout all seasons.
The analysis of vertical humidity profiles measured by radiosondes that are launched daily from Ny-Ålesund since 1991 has shown a significant increase of the integrated tropospheric water vapor in the winter season (Maturilli and Kayser 2017). The observed increase in atmospheric humidity may be caused by more cyclonic systems reaching the Arctic, transporting moisture and cloud systems to the Svalbard region. Both the cyclone frequency and the winter cyclone intensity have increased in the high latitudes (McCabe et al. 2001; Sorteberg and Walsh 2008;
Döscher et al. 2014 and references therein), and the advection of atmospheric energy into the Arctic region has been found to contribute to the vertical component of Arctic warming (Graversen et al. 2008; Dahlke and Maturilli 2017).
With future Arctic sea-ice retreat, the relative importance of local surface evapo- ration will increase, resulting in an amplified Arctic hydrological cycle (e.g. Bintanja and Selten 2014). Changing atmospheric moisture directly conditions the cloud cover. An increasing cloud amount and changes in vertical cloud distribution and cloud particle properties affect the radiation balance both in the longwave and short- wave range. With the longwave radiation dominating the polar night, radiative effects of low cloud cover are likely to contribute to the Arctic warming, introducing a positive climate feedback by potentially accelerating the melting of Arctic sea ice (Palm et al. 2010).
For the shortwave radiation, the presence of clouds yields a decrease in down- ward solar radiation. In Ny-Ålesund, there is no decrease in downward shortwave radiation found for the summer seasons (June, July, August) 1993–2014, rather a small but non-significant increase. For the spring seasons (March, April, May) 1993–2014, a small non-significant decrease in downward shortwave radiation is observed. Yet, for both seasons the shortwave net radiation SWnet = SWdown − SWup
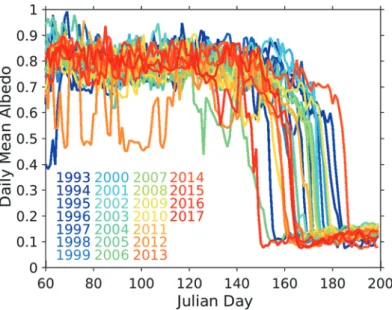
exhibits an increase that is caused by a robust decrease in upward shortwave radia- tion (Maturilli et al. 2015). This decrease in reflected radiation is due to the chang- ing surface reflectivity related to the snow cover and changes in the timing of the snow-free period. As measure of surface reflectivity, the daily mean albedo SWup/ SWdown from 1993 to 2017 BSRN measurements is shown in Fig. 2.8, exhibiting a large inter-annual variability.
As dry, weakly metamorphosed snow reflects most of the shortwave downward radiation (Wiscombe and Warren 1980), the broadband shortwave albedo in the snow-covered period in Ny-Ålesund is about 0.8, dropping during the snow-melt season to about 0.1 for the snow-free tundra ground (Winther et al. 2002; Maturilli et al. 2015). The amount of snow and the duration of the snow-covered period are the results of the synoptic large-scale situation. Long-term changes in these snow- related parameters may be interpreted as indicators of climate change. While Winther et al. (2002) did not find any changes neither in the start of the snow melt period nor in the duration of the snow-free season for measurements performed 1981–1997 by the Norwegian Polar Institute in Ny-Ålesund, the BSRN dataset indi-
Fig. 2.8 Daily mean albedo SWup/SWdown at the Ny-Ålesund BSRN radiation sensor set-up, on Julian days for all observation years from 1993 to 2017 (color-coded). (Update of Maturilli et al.
2015)
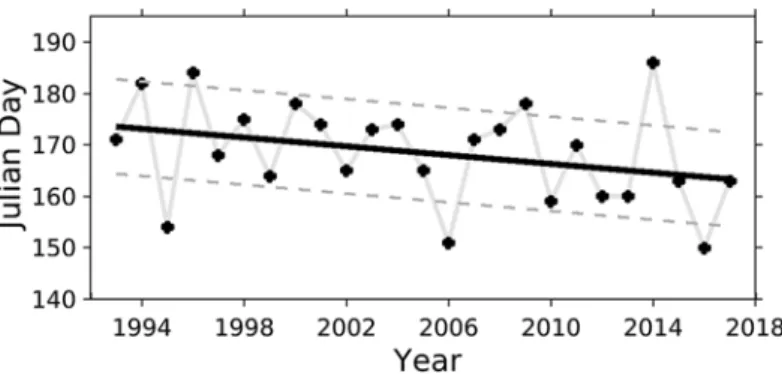
cates an insignificant temporal shift of the snow-free conditions in the time period 1993–2017. While the actual onset of melting processes is not clearly identifiable in the BSRN albedo data, the rapid drop to the low values of snow-free surface is evi- dent. Here, we define the first snow-free day by daily mean albedo dropping below a value of 0.2. Figure 2.9 shows the Julian day of each year 1993–2017, when the first snow-free day has accordingly been detected below the BSRN instrumentation.
Obviously, the local timing of snow melt can deviate considerably on small spatial distances as e.g. strong wind may accumulate snow banks or generally lead to snow redistribution.
Like other climate variables, the chosen parameter obviously does not vary lin- early in time. Taking into account the years 1993–2017, linear regression suggests a non-significant earlier appearance of snow-free conditions by about 4 days per decade. Obviously, some years appear as outliers in the decline, like e.g. 2014 which was snow-free only after 5 July. Yet in 2014, the late melting was not related to lower than normal temperatures, but to the extraordinary large accumulated snow mass that was present due to heavy precipitation events in the weeks before.
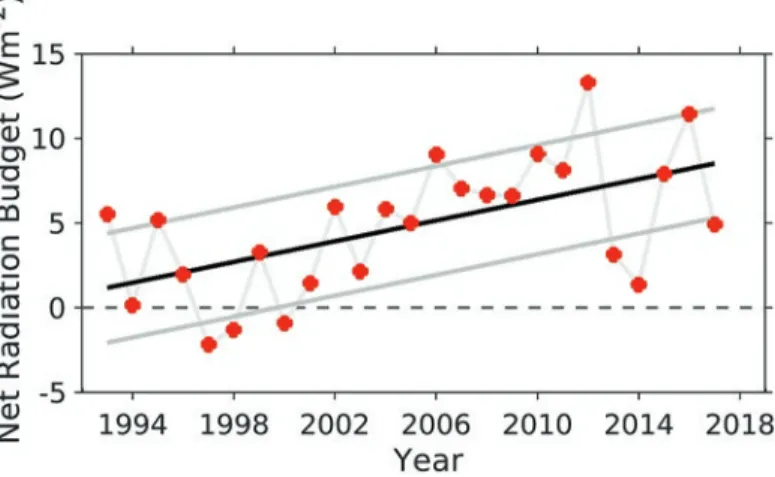
Obviously, changes in Arctic snow cover are not linearly dependent on changing surface temperatures, also precipitation patterns have a major influence. As precipi- tation varies locally on a smaller spatial scale than air temperature, individual long- term series in the Arctic may be diverse. Overall, an increase of annual precipitation is observed in the Svalbard region, with about 3–4% per decade in Ny-Ålesund (Førland et al. 2011). With the changing climate, changes in snow-cover persistence and thus in albedo are introduced to the Ny-Ålesund environment, leading to a decrease in the annual reflected radiation SWup. Effectively, this is the main contri- bution to an observed significant increase in the annual net radiation budget RADnet
in the order of 3.1 Wm−2 per decade (Fig. 2.10).
Fig. 2.9 First day of each year from 1993 to 2017 assumed to have a predominantly snow-free surface beneath the radiation sensor set-up because of a daily mean albedo <0.2, in Julian days (black dots) with linear regression (black line) and regression uncertainty (grey dashed lines, respectively)
2.4 Surface UV Radiation and Stratospheric Ozone
The ultra-violet (UV) part of the solar spectrum reaching the earth’s surface affects living organisms in various ways, which strongly depend on the exact distribution of the radiation intensity across the spectrum, the spectral irradiance. While the photo- synthetically active radiation (PAR) described in Sect. 2.2.4 refers to the spectral wavelength range from 400 to 700 nm in the visible, the UV spectrum ranges from 100 to 400 nm and is separated into the UV-A (315–400 nm), UV-B (280–315), and UV-C (100–280) parts. Broadly speaking, the harmfulness of UV radiation increases from UV-A to UV-C, while at the same time the irradiance at the surface reduces strongly from UV-A to UV-C. The incoming solar UV light is strongly absorbed and scattered by the constituents of the atmosphere, like the column amount of ozone, clouds, and aerosols. The low elevation angle of the sun in polar regions results in much lower irradiances there than elsewhere on earth. In addition to cloudiness, also surface reflectivity (albedo) has a high influence on the irradiance. A snow covered surface of high reflectivity can lead to even higher irradiance than usual.
Due to the high variability within the daily and annual course, as well as the weather conditions, a good recording of the actual irradiance is mandatory in order to analyze the influence on the biota. In Ny-Ålesund, several stations perform spectral irradiance measurements with radiometers, but little data are readily avail- able. A well conducted intercomparison campaign was performed in May and June 2009 according to the World Meteorological Organization (WMO) and Network for the Detection of Atmospheric Composition Changes (NDACC) standards, in order to assess the performance and intercomparability of the local spectroradiom- eters with a travelling standard (Groebner et al. 2010). In addition to the QUASUME reference spectroradiometer, four instruments where compared, including the
Fig. 2.10 Ny-Ålesund annual mean net radiation budget RADnet (red dots), with the linear regres- sion (black line) and regression uncertainty (grey lines, respectively) indicating an insignificant increase of +3.1 ± 2.7 Wm−2 per decade. (Update of Maturilli et al. 2015)
Brewer #50 instrument and a multi-filter ground-based UV-visible (GUV) radiom- eter from the Norwegian Institute for Air Research (Norsk institutt for luftfor- skning, NILU). The agreement between the instruments was usually better than 5% of the obtained UV-index, with deviations of up to 10% during low irradiance periods (midnight).
Data from the GUV radiometer is currently the only long term UV data available.
Svendby et al. (2014) report not only the annual course of the monthly UV dose as observed in Ny-Ålesund, but present also the long-term development of the annu- ally integrated UV doses from 1995 to 2013. Although potentially harmful peak values might not be reflected in the annual dose, it is interesting to note that the annual doses do not show any trend over the reported time span. Dahlback (2002) had extended the time series back to 1975 using a radiative transfer model and avail- able ozone and cloudiness data from satellites and surface observations to derive UV doses. Despite the observed decrease in column ozone values during the later part of his time series, no trend in monthly integrated UV doses for the month of April could be detected.
Figure 2.11 shows the annual course of hourly measured UV dose rate at noon for Ny-Ålesund in 2013 as compared to the expected dose rate for clear sky days as calculated from a radiative transfer model. While during the first half of the year the curve roughly follows the model, it reaches the expected values on few days only in the second half. This reflects the increased cloudiness during summer, as com- pared to spring, when only very few days have low dose rates. The fact that some- times the measured values are above the model curve can be attributed to multi–scattering of radiation between a high albedo surface (snow cover) and thin clouds, which
Jan 0 50 100
Noon doserate mw/m2 UV–index
150 200
0 2 4 6 8
Feb Mar Apr
UV doserate in Ny–A, 2013
Model UV doserate in Ny–A with clear ask and real ozone
May Jun Month of 2013
Jul Aug Sep Oct Nov Dec
Fig. 2.11 Hourly averaged UV dose rate measured at noon (between 10:30 and 11:30 UTC) in 2013. (From Svendby et al. 2014)
provides a higher level of radiation as would be in a cloud-free atmosphere over a low albedo surface. It should be noted, that the noon dose rate in Ny-Ålesund is roughly a third of the dose rate modelled or measured for Oslo area.
Hanelt et al. (2004) had investigated how the UV light penetrates into the water column of Kongsfjorden in order to assess its influence on algae. They found that during spring months (like April) the highest UV levels can be found, due to reduced ozone values, little cloud cover, and little turbidity in the water column, allowing harmful UV radiation to reach as deep as 5–6 m below the surface.
Stratospheric ozone is the main absorber of UV radiation in earth atmosphere.
Together with the scattering of UV radiation on aerosols and clouds and the reflec- tion from the surface, the total amount of ozone above a given location largely determines the level of UV radiation at the surface. Anthropogenic reduction in stratospheric ozone has led to increasing UV levels particularly in polar latitudes (Brasseur and Solomon 1984; Kerr and McElroy 1993; McKenzie et al. 1999; Diaz et al. 2003; de Laat et al. 2010). Variable cloudiness and surface albedo can mask the effect of stratospheric ozone on surface UV at individual stations. Analysing polar cap averages based on many Arctic stations eliminates much of the noise introduced by these effects and can provide deeper insight into the general link between stratospheric ozone and UV and into the longer term evolution of surface UV driven by stratospheric ozone changes.
Anthropogenic loss of ozone above the Arctic is most pronounced in spring and is extremely variable from year to year (Fig. 2.12; Rex et al. 2006). The large degree of variability is driven by variable meteorological conditions during winter, with lower stratospheric temperatures during winter generally favoring larger springtime ozone losses. In Fig. 2.12, the years 1996, 2000, 2005 and 2011 stand out as the years with the largest springtime ozone depletion above the Arctic, leading to large
Fig. 2.12 Interannual variation of vertically integrated springtime chemical ozone loss in the Arctic stratosphere derived from measurements of the Match ozone sounding network. (Update of Rex et al. 2006)
negative anomalies of springtime total ozone (Fig. 2.13a). Figure 2.13a shows that 1997 was also characterized by very low total ozone in spring, which mostly resulted from anomalous transport processes during the preceding winter (Tegtmeier et al.
2008; Manney et al. 2011).
In the Arctic summer, stratospheric transport processes are weak and less impor- tant for the Arctic ozone budget. Hence, during summer springtime ozone anoma- lies slowly relax towards a photochemical equilibrium over several months.
Figure 2.13a shows that anomalies in Arctic springtime total ozone tend to persist during summer and into fall (Karpechko et al. 2013; see also Fioletov and Shepherd 2003, 2005; Tegtmeier and Shepherd 2007).
Karpechko et al. (2013) showed that the persistence of ozone anomalies during summer results in corresponding polar cap wide anomalies of surface UV levels
Fig. 2.13 (a) Seasonal evolution of TOMS/OMI satellite-derived monthly mean total ozone col- umn anomalies averaged over 60°N–90°N for each year between 1979 and 2011 when the mea- surements were available, (b) Monthly mean cloud corrected noontime UV index anomaly for the same geographic region. Red, blue, green, and orange colors highlight the 2011, 2005, 2000, and 1997 years, respectively. (From Karpechko et al. 2013)
(Fig. 2.13b). Figure 2.14 shows the correlation between the March total ozone anomaly and June–August polar UV index anomaly, showing a correlation of −0.81.
Record UV levels were measured at a number of Arctic stations in summer 2011, following record Arctic ozone depletion in spring 2011 and leading to unprece- dented UV indices of 6–7 at some Arctic stations (Karpechko et al. 2013).
Overall, changes in the incoming radiation reaching the surface will affect the amount of available underwater radiation. The underwater light in Kongsfjorden and its ecological implications are described in Pavlov et al. (Chap. 5). Generally, the described processes impacting Arctic climate are important concerning local feedbacks with the underlying landmass, ice and ocean surface and consequently the ecosystem, but at the same time they induce a global feedback on the energy balance of the planet.
2.5 Conclusion
The sea surface layer of the Kongsfjord environment is in interaction with the above atmosphere as the exchange of latent and sensible heat affects both ambiences.
Above, we described the climatological setting of the Kongsfjord area as a bound- ary condition for the marine ecosystem.
Though located in the high Arctic, summer air temperature in Ny-Ålesund rises above freezing point causing snow and ice melt. In the dark and colder wintertime, the inter-annual temperature variability is stronger, and though temperature gener- ally remains well below freezing point even rain periods can be observed.
Independent of the synoptic scale flow, the wind in the lowermost atmosphere is mainly along the fjord axis throughout the whole year due to channeling effects
Fig. 2.14 Scatterplot of the June–August noontime UVI for polar latitudes versus March extra- tropical total ozone (TOMS/OMI data north of 35°N), with the correlation coefficient r = −0.81.
(From Karpechko et al. 2013)
caused by orography. Orographic clouds may also add to the general cloud cover caused by synoptic systems. The variability in synoptic cloud cover is the cause of the inter-annual variability in incoming solar radiation in summer, observed in the monthly mean global shortwave radiation SWdown as well as in PAR and UV radia- tion. Quantitative changes in surface radiation parameters over the last two decades have been identified in relation to the changing climate. In the annual mean, the reflected radiation decreases since the period of high reflective snow cover shortens.
During the winter months, an increase in thermal radiation is observed due to gener- ally increasing temperatures at the surface and in the atmospheric column, increas- ing atmospheric moisture and potential changes in cloud cover. In fact, the winter period adds the largest contribution to the observed warming in Ny-Ålesund, with a winter season temperature increase of 3.1 ± 2.2 K per decade (update of Maturilli et al. 2015).
Though the air temperature and atmospheric humidity may not have a direct impact on the marine ecosystem, their relevance for the hydrological cycle and the formation of clouds as determining factors for the incoming radiation at the surface is unambiguous. The marine Kongsfjord ecosystem will be shaped by the changing ambient water conditions, but moreover will be affected by the changing atmo- sphere that holds the radiative boundary conditions to the system.
Acknowledgements The authors thank all technical and scientific staff at Ny-Ålesund who has been taking care of the atmospheric measurements described in this article, in particular the station staff of the Sverdrup and AWIPEV stations. The authors are grateful to the three reviewers for valuable comments and suggestions.
References
Beine HJ, Argentini S, Maurizi A, Mastrantonio G, Viola A (2001) The local wind field at Ny-Ålesund and the Zeppelin mountain at Svalbard. Meteorog Atmos Phys 78:107–113.
https://doi.org/10.1007/s007030170009
Bennartz R, Shupe M, Turner DD, Walden VP, Steffen K, Cox CJ, Kulie MS, Miller NB, Pettersen C (2013) July 2012 Greenland melt extent enhanced by low-level liquid clouds. Nature 496:83–86. https://doi.org/10.1038/nature12002
Berge J, Cottier F, Last KS, Varpe O, Leu E, Søreide J, Eiane K, Falk-Petersen S, Willis K, Nygård H, Vogedes D, Griffiths C, Johnsen G, Lorentzen D, Brierley AS (2009) Diel vertical migration of Arctic zooplankton during the polar night. Biol Lett 5:69–72
Bintanja R, Selten FM (2014) Future increases in Arctic precipitation linked to local evaporation and sea-ice retreat. Nature 509:479–482. https://doi.org/10.1038/nature13259
Boike J, Roth K, Ippisch O (2003) Seasonal snow cover on frozen ground: energy balance calcu- lations of a permafrost site near Ny-Ålesund, Spitsbergen. J Geophys Res Atmos 108:8163–
8173. https://doi.org/10.1029/2001JD000939
Boike J, Juszak I, Lange S, Chadburn S, Burke E, Overduin PP, Roth K, Ippisch O, Bornemann N, Stern L, Gouttevin I, Hauber E, Westermann S (2018) A 20-year record (1998–2017) of permafrost, active layer and meteorological conditions at a high Arctic permafrost research site (Bayelva, Spitsbergen). Earth Syst Sci Data 10:355–390. https://doi.org/10.5194/
essd-10-355-2018
Brasseur G, Solomon S (1984) Aeronomy of the middle atmosphere. D. Reidel Publishing Co, Dordrecht, p 414
Burgemeister S (2013) Windstruktur einer arktischen Grenzschicht am Beispiel Ny-Ålesund.
Master thesis, Universität Potsdam, Germany
Cavalieri DJ, Parkinson CL (2012) Arctic sea ice variability and trends, 1979–2010. Cryosphere 6:881–889. https://doi.org/10.5194/tc-6-881-2012
Curry JA, Schramm J, Ebert EE (1995) On the sea ice albedo climate feedback mechanism. J Clim 8:240–247. https://doi.org/10.1175/1520-0442(1995)008<0240:SIACFM>2.0.CO;2
Curry JA, Rossow WB, Randall D, Schramm JL (1996) Overview of Arctic cloud and radiation characteristics. J Clim 9:1731–1764. https://doi.org/10.1175/15200442(1996)009<1731:OOA CAR>2.0.CO;2
Dahlback A (2002) Recent changes in surface ultraviolet solar radiation and stratospheric ozone at a high Arctic site. In: UV Radiation and Arctic Ecosystems, Ecological studies, vol 153.
Springer, Berlin/Heidelberg, pp 3–22. https://doi.org/10.1007/978-3-642-56075-0_1
Dahlke S, Maturilli M (2017) Contribution of atmospheric advection to the amplified win- ter warming in the Arctic North Atlantic Region. Adv Meteorol:ID4928620. https://doi.
org/10.1155/2017/4928620
de Laat ATJ, van der ARJ, Allaart MAF, van Weele M, Benitez GC, Casiccia C, Paes Leme NM, Quel E, Salvador J, Wolfram E (2010) Extreme sunbathing: three weeks of small total O3 col- umns and high UV radiation over the southern tip of South America during the 2009 Antarctic O3 hole season. Geophys Res Lett 37:L14805. https://doi.org/10.1029/2010GL043699 Dessler AE, Schoeberl MR, Wang T, Davis SM, Rosenlof KH (2013) Stratospheric water vapor
feedback. PNAS 110:18087–18091. https://doi.org/10.1073/pnas.1310344110
Diaz S, Nelson D, Deferrari G, Camiliãn C (2003) Estimated and measured DNA, plant- chromosphere and erythemal-weighted irradiances at Barrow and South Pole (1979–2000).
Agric For Meteorol 120:69–82
Döscher R, Vihma T, Maksimovich E (2014) Recent advances in understanding the Arctic climate system state and change from a sea ice perspective: a review. Atmos Chem Phys 14:13571–
13600. https://doi.org/10.5194/acp-14-13571-2014
Esau I, Repina I (2012) Wind climate in Kongsfjorden, Svalbard, and a attribution of leading wind driving mechanisms through turbulence-resolving simulations. Adv Meteorol:568454. https://
doi.org/10.1155/2012/568454
Fioletov VE, Shepherd TG (2003) Seasonal persistence of midlatitude total ozone anomalies.
Geophys Res Lett 30:1417. https://doi.org/10.1029/2002GL016739
Fioletov VE, Shepherd TG (2005) Summertime total ozone variations over middle and polar lati- tudes. Geophys Res Lett 32:L04807. https://doi.org/10.1029/2004GL022080
Førland EJ (1979) Precipitation and topography. Klima 2:3–24
Førland EJ, Hansen-Bauer I (2003) Past and future climate variations in the Norwegian Arctic:
overview and novel analyses. Polar Res 22:113–124
Førland EJ, Hansen-Bauer I, Nordli PØ (1997a) Climate statistics and long-term series of tem- perature and precipitation at Svalbard and Jan Mayen. Norwegian Meteorological Institute, Klima 21/97
Førland EJ, Hansen-Bauer I, Nordli PØ (1997b) Orographic precipitation at the glacier Austre Broggerbreen, Svalbard. Norwegian Meteorological Institute, Klima 02/97
Førland EJ, Benestad R, Hanssen-Bauer I, Haugen JE, Skaugen TE (2011) Temperature and pre- cipitation development at Svalbard 1900–2100. Adv Meteorol 2011:ID893790. https://doi.
org/10.1155/2011/893790
Francis JA, Hunter E (2007) Changes in the fabrics of the Arctic’s greenhouse blanket. Environ Res Lett 2:045011. https://doi.org/10.1088/1748-9326/2/4/045011
Francis JA, Chan W, Leathers DJ, Miller JR, Veron DE (2009) Winter northern hemisphere weather patterns remember summer Arctic sea-ice extent. Geophys Res Lett 36:L07503. https://doi.
org/10.1029/2009GL037274
Garcia RR, Randel WJ (2008) Acceleration of the Brewer–Dobson circulation due to increases in greenhouse gases. J Atmos Sci 65:2731–2739. doi: 0.1175/2008JAS2712.1
Graversen RG, Mauritsen T, Tjernström M, Källén E, Svensson G (2008) Vertical structure of recent Arctic warming. Nature 451:53–56. https://doi.org/10.1038/nature06502
Groebner J, Hülsen G, Wuttke S, Schrems O, De Simone S, Gallo V, Rafanelli C, Petkov B, Vitale V, Edvardsen K, Stebel K (2010) Quality assurance of solar UV irradiance in the Arctic.
Photochem Photobiol Sci 9:384–391
Hanelt D, Bischof K, Wiencke C (2004) The radiation, temperature and salinity regime in Kongsfjorden. Ber Polarforsch Meeresforsch 492:14–25
Harding RJ, Lloyd CR (1998) Fluxes of energy and water from three high latitude tundra sites in Svalbard during the snowmelt and snow free periods. Nord Hydrol 29:267–284. https://doi.
org/10.2166/nh.1998.014
IPCC (2007) Climate change 2007: the physical science basis. Contribution of working group I to the fourth assessment report of the intergovernmental panel on climate change. Solomon S, Qin D, Manning M, Chen Z, Marquis M, Averyt KB, Tignor M, Miller HL (eds) Cambridge University Press, Cambridge/New York
IPCC (2013) Climate change 2013: the physical science basis. Contribution of working group I to the fifth assessment report of the intergovernmental panel on climate change. Stocker TF, Qin D, Plattner G-K, Tignor M, Allen SK, Boschung J, Nauels A, Xia Y, Bex V, Midgley PM (eds) Cambridge University Press, Cambridge/New York. https://doi.org/10.1017/
CBO9781107415324
Karpechko AY, Backman L, Thölix L, Ialongo I, Andersson M, Fioletov V, Heikkilä A, Johnsen B, Koskela T, Kyrölä E, Lakkala K, Myhre KL, Rex M, Sofieva VF, Tamminen J, Wohltmann I (2013) The link between springtime total ozone and summer UV radiation in Northern Hemisphere extratropics. J Geophys Res Atmos 118:8649–8661. https://doi.org/10.1002/
jgrd.50601
Kerr JB, McElroy CT (1993) Evidence for large upward trends of ultraviolet-B radiation linked to ozone depletion. Science 262:1032–1034
Lindsay R, Zhang J (2005) The thinning of the Arctic sea ice, 1988–2003. Have we passed a tip- ping point? J Clim 18:4879–4894. https://doi.org/10.1175/JCLI3587.1
Lu J, Cai M (2009) Seasonality of polar surface warming amplification in climate simulations.
Geophys Res Lett 36:L16704. https://doi.org/10.1029/2009GL040133
Manney GL et al (2011) Unprecedented Arctic ozone loss in 2011. Nature 478:469–475. https://
doi.org/10.1038/nature10556
Maturilli M, Kayser M (2017) Arctic warming, moisture increase and circulation changes observed in the Ny-Ålesund homogenized radiosonde record. Theor Appl Climatol 130:1–17. https://
doi.org/10.1007/s00704-016-1864-0
Maturilli M, Herber A, König-Langlo G (2013) Climatology and time series of surface meteo- rology in Ny-Ålesund, Svalbard. Earth Syst Sci Data 5:155–163. https://doi.org/10.5194/
essd-5-155-2013
Maturilli M, Herber A, König-Langlo G (2015) Surface radiation climatology for Ny-Ålesund, Svalbard (78.9° N): basic observations for trend detection. Theor Appl Climatol 120:331–339.
https://doi.org/10.1007/s00704-014-1173-4
Mazzola M, Viola AP, Lanconelli C, Vitale V (2016) Atmospheric observations at the Amundsen- Nobile Climate Change Tower in Ny-Ålesund, Svalbard. Rend Fis Acc Lincei 27:S7–S18.
https://doi.org/10.1007/s12210-016-0540-8
McCabe GJ, Clark MP, Serreze MC (2001) Trends in Northern Hemisphere surface cyclone fre- quency and intensity. J Clim 14:2763–2768
McKenzie R, Connor B, Bodeker G (1999) Increased summertime UV radiation in New Zealand in response to ozone loss. Science 285:1709–1711
Nordli Ø, Przybylak R, Ogilvie AEJ, Isaksen K (2014) Long-term temperature trends and vari- ability on Spitsbergen: the extended Svalbard Airport temperature series, 1898–2012. Polar Res 33:21349. https://doi.org/10.3402/polar.v33.21349
Overland JE, Wang M (2010) Large-scale atmospheric circulation changes are associated with the recent loss of Arctic sea ice. Tellus 62A:1–9. https://doi.org/10.1111/j.1600-0870.2009.00421.x
Overland JE, Spillane MC, Percival DB, Wang M, Mofjeld HO (2004) Seasonal and regional vari- ation of pan-Arctic surface air temperature over the instrumental record. J Clim 17:3263–3282.
https://doi.org/10.1175/1520-0442(2004)017<3263:SARVOP>2.0.CO;2
Palm SP, Strey ST, Spinhirne J, Markus T (2010) Influence of Arctic sea ice extent on polar cloud fraction and vertical structure and implications for regional climate. J Geophys Res 115:D21209. https://doi.org/10.1029/2010JD013900
Pavlov AK, Leu E, Hanelt D, Bartsch I, Karsten U, Hudson SR, Gallet J-C, Cottier F, Cohen JH, Berge J, Johnsen G, Maturilli M, Kowalcuk P, Granskog MA (this volume-b) Chapter 5: The underwater light climate in Kongsfjorden and its ecological implications. In: Hop H, Wiencke C (eds) The ecosystem of Kongsfjorden, Svalbard, Advances in polar ecology 2. Springer, Cham
Pithan F, Mauritsen T (2014) Arctic amplification dominated by temperature feedbacks in contem- porary climate models. Nat Geosci 7:181–184. https://doi.org/10.1038/ngeo2071
Rex M et al (2006) Arctic winter 2005: implications for stratospheric ozone loss and climate change. Geophys Res Lett 33:L23808. https://doi.org/10.1029/2006GL026731
Screen JA, Simmonds I (2010) The central role of diminishing sea ice in recent Arctic temperature amplification. Nature 464:1334–1337. https://doi.org/10.1038/nature09051
Seidel DJ, Lanzante JR (2004) An assessment of three alternatives to linear trends for charac- terizing global atmospheric temperature changes. J Geophys Res 109:D14108. https://doi.
org/10.1029/2003JD004414
Sorteberg A, Walsh JE (2008) Seasonal cyclone variability at 70°N and its impact on moisture trans- port into the Arctic. Tellus A 60:570–586. https://doi.org/10.1111/j.1600-0870.2008.00314.x Svendby TM, Edvardsen K, Stebel K, Myhre CL, Dahlback A (2014) Monitoring of the atmo-
spheric ozone layer and natural ultraviolet radiation. Annual report 2013, Kjeller, NILU (Miljødirektoratet rapport, M-201/2014) (NILU OR, 28/2014) ISBN 978-82-425-2688-5 Tegtmeier S, Shepherd TG (2007) Persistence and photochemical decay of springtime total ozone
anomalies in the Canadian Middle Atmosphere Model. Atmos Chem Phys 7:485–493 Tegtmeier S, Rex M, Wohltmann I, Krüger K (2008) Relative importance of dynamical and
chemical contributions to Arctic wintertime ozone. Geophys Res Lett 35:L17801. https://doi.
org/10.1029/2008GL034250
Vihma T, Kilpeläinen T, Manninen M, Sjöblom A, Jakobson E, Palo T, Jaagus J, Maturilli M (2011) Characteristics of temperature and humidity inversions and low-level jets over Svalbard fjords in spring. Adv Meteorol 2011:ID486807. https://doi.org/10.1155/2011/486807 Wallace MI, Cottier FR, Berge J, Tarling GA, Griffiths C, Brierley AS (2010) Comparison of zoo-
plankton vertical migration in an ice-free and a seasonally ice-covered Arctic fjord: an insight into the influence of sea ice cover on zooplankton behaviour. Limnol Oceanogr 55:831–845 Westermann S, Luers J, Langer M, Piel K, Boike J (2009) The annual surface energy budget
of a high-Arctic permafrost site on Svalbard, Norway. Cryosphere 3:245–263. https://doi.
org/10.5194/tc-3-245-2009
Winther J-G, Godtliebsen F, Gerland S, Isachsen PE (2002) Surface albedo in Ny-Ålesund, Svalbard: variability and trends during 1981–1997. Glob Planet Chang 32:127–139
Wiscombe WJ, Warren SG (1980) A model for the spectral albedo of snow; I: pure snow. J Atmos Sci 37:2712–2745
Zhang X, Walsh JE, Zhang J, Bhatt US, Ikeda M (2004) Climatology and interannual variability of Arctic cyclone activity: 1948–2002. J Clim 17:2300–2317
Zhang X, Sorteberg A, Zhang J, Gerdes R, Comiso JC (2008) Recent radical shifts of atmospheric circulations and rapid changes in Arctic climate system. Geophys Res Lett 35:L22701. https://
doi.org/10.1029/2008GL035607

![Fig. 2.5 Ny-Ålesund 25-year average monthly mean values of the shortwave net radiation [SW net = SW down − SW up ] (blue line), the longwave net radiation [LW net = LW down − LW up ] (red line), and the net radiation budget [RAD net = SW net + LW](https://thumb-eu.123doks.com/thumbv2/1library_info/5244441.1672098/9.659.134.525.91.391/ålesund-average-monthly-shortwave-radiation-longwave-radiation-radiation.webp)