Optical Spectroscopy of Orbital and Magnetic Excitations in Vanadates and Cuprates
Eva Benckiser
al S pe ctr os co py of O rb ita l a nd M ag ne tic E xc ita tio ns in Va na da tes an d C up rat es E va B e n ck is e r
and Magnetic Excitations in Vanadates and Cuprates
Inaugural - Dissertation
zur
Erlangung des Doktorgrades
der Mathematisch-Naturwissenschaftlichen Fakultät der Universität zu Köln
vorgelegt von
Eva Vera Benckiser
aus Stuttgart
Köln, im Oktober 2007
Prüfungskommission: Prof. Dr. G. Meyer
Tag der letzten mündlichen Prüfung: 21. November 2007
does not imply the ability to start from those laws and reconstruct the universe.’
(P. W. Anderson [1])
for my parents
1. Introduction 1
2. Optical Spectroscopy 7
2.1. Some Basics . . . . 7
2.1.1. Anisotropic Samples: the Dielectric Tensor . . . . 8
2.2. Electric-Dipole Transitions and Selection Rules . . . 10
2.2.1. Group-Theoretical Considerations . . . 11
2.3. Electronic Excitations . . . 13
2.4. Low-Energy Excitations in Correlated Insulators . . . 14
2.4.1. Phonons . . . 15
2.4.2. Orbital Excitations: Local Crystal-Field Excitations vs. Or- bitons . . . 16
2.4.3. Magnetic Excitations: Phonon-Assisted Multimagnon Absorp- tion . . . 22
3. Experimental Setup 27 3.1. Fourier Transform Spectroscopy . . . 27
3.1.1. Measurement of the Transmittance and Reflectance . . . 29
3.1.2. Problems to Take Care of . . . 30
3.1.3. Applying an External Magnetic Field . . . 33
3.2. Alignment and Preparation of the Samples . . . 33
3.2.1. Sample Alignment . . . 34
3.2.2. Lapping & Polishing . . . 34
4. Orbital Excitations in Orbitally Ordered Vanadates 35 4.1. The Compounds RVO
3(R = Y, Ho, Ce) . . . 35
4.1.1. YVO
3. . . 39
4.1.2. HoVO
3. . . 50
4.1.3. CeVO
3. . . 50
4.2. Experimental Details . . . 51
4.2.1. Samples of RVO
3. . . 51
4.2.2. Samples of VOCl . . . 55
4.2.3. Samples of Dy(Sc,V)O
3. . . 55
4.2.4. Resistivity of YVO
3. . . 56
4.2.5. Transmittance of YVO
3. . . 60
4.2.6. Transmittance of HoVO
3. . . 61
4.2.7. Transmittance of CeVO
3. . . 65
4.2.8. Reflectance of YVO
3. . . 66
4.3. Results: Optical Conductivity of RVO
3. . . 70
4.3.1. Optical Conductivity of YVO
3. . . 70
4.3.2. Absorption spectrum of HoVO
3and CeVO
3. . . 85
4.3.3. Spin-forbidden transitions in YVO
3. . . 89
4.3.4. Absorption of YVO
3in a Magnetic Field . . . 92
4.3.5. Estimate of 10Dq in Dy(Sc,V)O
3. . . 92
4.3.6. Summary . . . 93
5. Magnetic Excitations in Quasi-1D Quantum Spin Systems 97 5.1. Low-Dimensional Quantum Spin Systems . . . 97
5.2. Spin-1/2 Chains in (Sr,Ca)CuO
2. . . 102
5.2.1. Introduction . . . 102
5.2.2. Experimental Details . . . 108
5.2.3. Results: Optical Conductivity of Sr
1-xCa
xCuO
2. . . 115
5.3. The 5-Leg Spin Ladders in La
8Cu
7O
19. . . 129
5.3.1. Introduction . . . 129
5.3.2. Experimental Details . . . 131
5.3.3. Results: Magnetic Excitations in La
8Cu
7O
19. . . 134
6. Conclusion 141 A. Appendix 145 A.1. Cluster Calculation . . . 145
A.2. Configuration Mixing of the
3T
1Ground State . . . 149
A.3. Assignment of the Dy
3+f-f Transitions in DyScO
3. . . 149
A.4. Assignment of the Ce
3+f-f Transitions in CeVO
3. . . 151
A.5. Assignment of the Ho
3+f-f Transitions in HoVO
3. . . 153
A.6. Near-Infrared Photoinduced Absorption in SrCuO
2. . . 155
A.7. Madelung Potentials at O(1) and O(2) in SrCuO
2. . . 156
References 159 List of Publications 175 Acknowledgements 177 Supplement 179 Offizielle Erklärung . . . 179
Abstract . . . 181
Kurzzusammenfassung . . . 183
viii
In many transition-metal (TM) oxides the strong electron-electron correlations play a crucial role giving rise to fascinating physics and a rich variety of novel phenomena.
Because of their partly filled d shells many TM oxides are expected to be metals, but found experimentally to be insulators [2]. To account for both, the energy gain due to delocalization of the electrons and the Coulomb repulsion between two electrons on the same site, the Hubbard model was introduced [3, 4]. The most important difference to a conventional band insulator is that the atomic degrees of freedom, spin and orbital, still survive in such Mott insulators [5]. The degrees of freedom for electrons, localized on a specific atomic site, give rise to versatile order phenomena, like charge, spin, and orbital order. In particular, these order phenomena offer the possibility of new collective excitations, like charge-density waves, spin waves (magnons), and orbital waves (orbitons). The investigation of these low-energy excitations in undoped Mott insulators is the subject of this thesis.
First, we focus on orbital excitations in orbitally ordered vanadates RVO
3with R = rare-earth ion. The undoped RVO
3compounds are Mott-Hubbard insulators with a pseudo-cubic structure. The octahedrally coordinated V
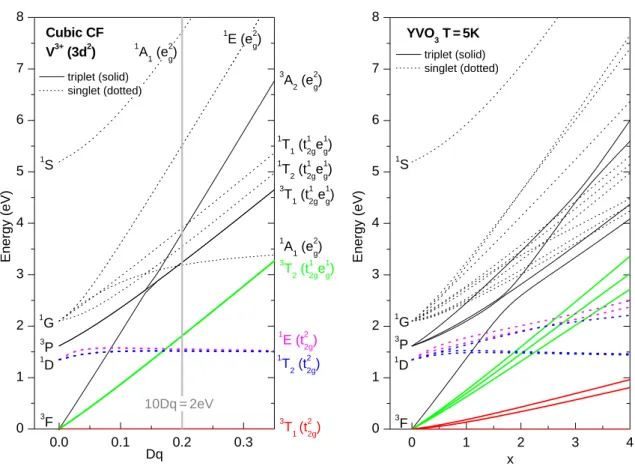
3+ions exhibit two electrons occupying the open 3d shell. Due to the crystal field, the five atomic 3d levels are split into a low-lying triply degenerate t
2glevel and a high-lying doubly degenerate e
glevel. In the ground state both electrons occupy the t
2gorbitals. Two mechanisms are discussed in the literature which give rise to a lifting of the orbital degeneracy of partly filled t
2glevels. First, the orbital degeneracy may be lifted by a coupling to phonons, i.e. due to the so-called (collective) Jahn-Teller (JT) effect [6].
Second, a lifting of the degeneracy by superexchange processes has been suggested [7]. In real crystals one may expect that both mechanisms are present, but with different strength. Independent from the respective mechanism, the formation of an orbitally ordered ground state is expected. However, a dominant superexchange may also give rise to exotic ground states. For instance, an orbital liquid state in LaTiO
3[8] and an orbital Peierls state in YVO
3[9, 10] have been predicted. The latter is of particular interest, because the excitations of a dimerized orbital ground state may show some peculiarities.
From the ground state properties it is impossible to decide which mechanism is
the most relevant one. However, when concerning the elementary excitations of such
an orbitally-ordered system, the coupling to the lattice plays a crucial role. If the JT
effect is dominant, the orbital excitations are local crystal-field excitations, i.e. tran-
sitions of electrons between local crystal-field levels. Such local orbital excitations
have been investigated in detail in many TM compounds over the last decades and
are well described by crystal-field theory. In the case of dominant superexchange interactions the orbital excitations are collective modes (orbitons) which may be vi- sualized by a modulation of the relative shape of orbitals in an orbitally ordered state.
Orbitons exhibit a significant dispersion. Because the orbital degree of freedom does not show continuous rotational symmetry, the dispersion of orbitons exhibits a gap, in contrast to the analogue spin waves. First evidence for an experimental obser- vation of orbitons has been reported from Raman scattering studies on LaMnO
3, a 3d
4compound which exhibits one electron in the e
gorbitals [11]. However, later an explanation of the observed features in terms of multi-phonon scattering has been suggested [12]. In YTiO
3and LaTiO
3a Raman peak at 0.25 eV has been interpreted in terms of a two-orbiton excitation based on its dependence on temperature, polar- ization, and on the frequency of the incoming photons [13, 14]. However, it cannot be fully excluded that this feature corresponds to a local crystal-field excitation [15].
The compounds RVO
3are also promising candidates for the observation of orbitons [16, 17], because the t
2gorbitals are expected to be less strongly coupled to the lattice, compared to e
gorbitals. Orbital ordering in RVO
3has been theoretically predicted [18, 19] and subsequently confirmed by experiments [20–23]. In particular, depending on the R ion, the compounds undergo a series of temperature-induced phase transitions accompanied by a change of orbital and magnetic order [19, 24–32].
This diversity of differently ordered orbital and magnetic phases gives the possibil- ity to verify the theoretical predictions in detail. In fact, also in RVO
3two-orbiton Raman scattering has been reported recently [10, 32, 33]. However, also here the relevant features are observed in the region of phonon, magnon, and multi-phonon scattering which hinders an unambiguous experimental proof of orbitons.
In this thesis we use optical spectroscopy to study the orbital excitations in the undoped Mott-Hubbard insulators RVO
3with R = Y, Ho, and Ce. Optical spec- troscopy is a powerful tool to investigate such systems. Particularly in the energy range below the insulating gap, a very accurate determination of the optical conduc- tivity by a combined analysis of reflectance and transmittance allows the investiga- tion of very small absorption features. The energy and line shape is characteristic and in many cases well describable by theory. In addition, the selection rules give clear predictions, e.g. for the polarization dependence. Our aim to study the orbital excitations of RVO
3is to give experimental insight whether the coupling to the lattice or the superexchange interaction is the driving force for orbital order. Local crystal-field excitations can be well investigated by optical spectroscopy, and clear predictions can be made from crystal-field theory. Therefore, we analyze the spec- tra in comparison with the results of cluster calculations. Additionally we consider VOCl and Dy(V,Sc)O
3, which serve as reference materials. The spectra of these compounds ought to demonstrate the local crystal-field excitations of V
3+(3d
2) in a predominantly octahedral environment. The investigation of orbitons by means of optical spectroscopy is new [15]. Predictions for the observation of two-orbiton excitations have been derived for inelastic neutron scattering and Raman scattering [34]. Both Raman and optical spectroscopy are in general restricted to the observa-
2
more precisely, the two-orbiton continuum) throughout the entire Brillouin zone, since only k
1+ k
2= 0 is required. In optical spectroscopy the selection rules for lo- cal crystal-field transitions and orbitons are expected to be equal. We will point out that in the case of RVO
3, the specific orbital and magnetic order in the inter- mediate monoclinic phase provides a basis for the direct observation of two-orbiton excitations, which show a pronounced polarization and temperature dependence.
The second part of this thesis is concerned with magnetic excitations in the low- dimensional quantum spin systems (Sr,Ca)CuO
2and La
8Cu
7O
19. The discovery of high-T
csuperconductivity in cuprates [35] has attracted renewed interest in the investigation of low-dimensional spin systems because an intimate relationship be- tween magnetism and high-T
csuperconductivity has been suggested [36]. A com- mon characteristic of these cuprate superconductors is the presence of CuO
2planes stacked on top of each other. It is widely believed that the relevant low-energy physics are described by the degrees of freedom of these CuO
2planes. In the un- doped case, each CuO
2plane corresponds to an antiferromagnetic 2D square lattice with nearest-neighbor coupling of the Cu
2+S = 1/2 spins, whereas adjacent planes are magnetically nearly decoupled. Aiming for a full understanding of high-T
csu- perconductivity, the magnetism of the CuO
2planes has been investigated compre- hensively in the last twenty years, both theoretically and experimentally. For theo- reticians, the investigation of low-dimensional spin systems is an interesting field of activity, also in former times. For instance, H. Bethe worked out the excitation spec- trum of a one-dimensional S = 1/2 chain already in 1931 [37]. In contrast to higher dimensions, in 1D the quantum fluctuations are so strong that long-range order is suppressed down to zero temperature, i.e., these systems are so-called spin liquids.
Accordingly, the excitation spectrum of the S = 1/2 chain is very different. While in 2D the excitations are well described by spin waves with S
z= 1, the excitations of the spin chain have been identified with incoherent excitations with fractional spin S = 1/2, called spinons [38]. In this regard, the crossover from the 2D square lattice to the 1D chain is of particular interest. This crossover is realized by n-leg ladders, i.e. n chains coupled by a perpendicular coupling. It has been predicted by numerical calculations that the crossover from one to two dimensions is not smooth [39]. While ladders with an even number of legs are gapped spin liquids, ladders with an odd number of legs exhibit no energy gap to the lowest magnetic excitations [40, 41]. The excitations of the two-leg ladder have been successfully explained in terms of triplets with S =1 [42]. However, the investigation of magnetic excitations in low-dimensional spin systems is still a hot topic in modern solid-state physics.
In this thesis we study the magnetic excitations of the S = 1/2 double chain (Sr,Ca)CuO
2and of the five-leg ladder compound La
8Cu
7O
19.
Optical spectroscopy is a powerful tool to investigate low-dimensional spin sys-
tems (see e.g. [43]) by means of phonon-assisted magnetic absorption proposed by
Lorenzana and Sawatzky [44, 45]. Especially low-dimensional cuprates with com-
paratively large exchange couplings around ∼ 100 meV are well suited, because the phonon-assisted magnetic absorption is well separated from other excitations, i.e.
phonons or electronic excitations. As mentioned above, the determination of σ(ω) in the energy range below the insulating gap is very sensitive to small absorption fea- tures, when considering a combined analysis of reflectance and transmittance. The energy and line shape of the magnetic contribution is characteristic, which gives the possibility for an unambiguous proof of theoretical predictions.
Our aim to investigate the double chains in (Sr,Ca)CuO
2is manifold. From opti- cal spectroscopy, only one result for the two-spinon-plus-phonon absorption in the S = 1/2 chain Sr
2CuO
3has been reported [46]. In this closely related compound the determination of J by different experimental techniques is controversial. From the temperature dependence of the magnetic susceptibility a value of 181(17) meV has been estimated [47], while mid-infrared absorption data yield a ∼37 % larger value of 260 meV [46]. Therefore, one motivation was to determine the important parameter J for SrCuO
2by analyzing the mid-infrared absorption spectra. Additionally, the double chains in SrCuO
2give the possibility to study the influence of weak perpen- dicular couplings on the excitation spectrum, also earlier investigated in our group [43, 48]. The investigation of the Ca-substituted compound (Sr,Ca)CuO
2has been initiated by recent thermal conductivity measurements [49]. Upon substitution of Sr by iso-valent Ca, the thermal conductivity due to acoustic phonons is effectively suppressed, while it is suggested that the magnetic contribution is not strongly af- fected [49]. Therefore we determine J also for Sr
0.9Ca
0.1CuO
2by analyzing the mid-infrared absorption spectra.
The successful preparation of large single crystals of La
8Cu
7O
19offers the possi- bility for the first study on a five-leg ladder.
Scope of this Thesis
The structure of this thesis is as follows. In Chapter 2 we give a brief introduction on optical spectroscopy and the therewith associated selection rules. Optical spec- troscopy is a very well established method, and a lot of good text books are available (e.g. [50]). Therefore, we mainly focus on selective topics with regard to the scope of this thesis, i.e. the optical spectroscopy of low-energy excitations in TM oxides.
In order to determine σ(ω), we performed measurements using a Fourier trans- form spectrometer. The experimental setup and the sample preparation are briefly summarized in Chapter 3. Since the development of high-performance computers, Fourier transform spectroscopy has become a powerful and fast method to measure the reflectance and transmittance of solids. Commercial setups are available and the field of application covers medical engineering, sensor technology, as well as chemi- cal analysis in food and pharmaceutical industry. However, we used a specific setup which is equipped with a cryostat, enabling measurements down to liquid helium temperature. This is essential to study the excitations of solids in the limit T → 0.
The orbital excitations in orbitally ordered vanadates are the subject of Chapter 4.
After giving a detailed introduction to the up-to-now known structural and physical
4
Ho, and Ce. We also present data of VOCl and Dy(Sc,V)O
3which serve as reference systems in the context of local crystal-field excitations.
Due to this comparison and in combination with the results obtained from a cluster calculation, we discuss the observation of collective orbital excitations around 0.4 eV for E k c in the monoclinic phase of RVO
3.
In Chapter 5, we present the results on the magnetic excitations of the dou- ble (zig-zag) chain (Sr,Ca)CuO
2and the five-leg S = 1/2 ladder La
8Cu
7O
19. For (Sr,Ca)CuO
2we will present the detailed analysis of the two-spinon-plus-phonon contribution in chain polarization, which allows us to determine a very exact value of J . Furthermore we sketch a new mechanism which gives rise to a dipole mo- ment perpendicular to the chains when two spins are exchanged along the chain.
Subsequently, we present the first result from a five-leg S = 1/2 ladder.
In Chapter 6 we summarize the main results.
6
Optical spectroscopy is a powerful technique to study the excitations of solids. The complex optical conductivity σ(ω) can be obtained by measuring the transmittance and/or reflectance of a material as a function of frequency. The real part of σ(ω) is a direct probe of the absorption and reflects the excitation spectrum of the solid.
The chapter on hand is organized as follows. As a start some basics are introduced in order to deduce the formulas used to analyze the experimental data. Afterwards the selection rules for electric-dipole transitions are briefly discussed. Finally, we focus on contributions to σ(ω) in Mott insulators, in particular on orbital and mag- netic excitations.
2.1. Some Basics
In most cases the interaction of a solid with an electromagnetic wave can be de- scribed within the scope of linear-response theory [51]. Within the series of electric- and magnetic-multipole excitations the electric-dipole excitation is the strongest process.
1Therefore we will focus on the electric-dipole component of the radiation in the following.
The fundamental linear-response functions which relates the electric field E to the displacement field D is the dielectric function ε(k, ω) which in general depends on the wave-vector k and frequency ω. Since the considered wave lengths (magnitude of microns in the mid-infrared range) are big compared with typical lattice constants in solids (a few Ångstrøm), the electric-field vector of light hardly varies within one unit cell. Therefore the wave-vector dependence of the Fourier-transformed fields is negligible: |k| ∝ 1/λ ≈ 0. Thus we write
D(ω) = ε(ω)E(ω). (2.1) More general ε ˆ = ε
ijis a second-rank tensor (to be discussed in Sec. 2.1.1). The dielectric function is a complex quantity ε = ε
1+ iε
2, which can be expressed by the complex index of refraction N = p
ε(ω) = n(ω) + iκ(ω):
ε
1= n
2(ω) − κ
2(ω); ε
2= 2n(ω)κ(ω). (2.2)
1In general the transition probability is proportional to ω2l+1 with the frequency ω and the multipole orderl [52]. The atomic radiative rate for magnetic-dipole transitions is five orders of magnitude smaller, compared with electric-dipole transitions [50, 53]. The rate for electric- quadrupole transitions is still even less [52].
Another related quantity is the optical conductivity σ(ω), which is used e.g. in the frequency-dependent form of Ohm’s law
j(ω) = σ(ω)E(ω). (2.3) The optical conductivity σ = σ
1+ iσ
2can be expressed by the dielectric function ε and consequently by n and κ:
σ
1(ω) = ω
4π ε
2(ω) = ω
2π n(ω)κ(ω) (2.4)
σ
2(ω) = ω
4π (1 − ε
1(ω)) = ω
4π 1 − n
2(ω) + κ
2(ω)
. (2.5)
By measuring the transmittance T (ω) of a sample with thickness d and the re- flectance R(ω) at normal incidence, n(ω) and κ(ω) are determined solving the fol- lowing linear system of equations [54]:
R(ω) = (n − 1)
2+ κ
2(n + 1)
2+ κ
2T (ω) = (1 − R)
2Φ
1 − (RΦ)
2(2.6)
Φ(ω) = exp (−2ωκd/c).
These equations are solely valid for a sample with plane-parallel surfaces in vacuum and unresolved interference fringes [54]. Using equations 2.4 and 2.5, the complex optical conductivity can be calculated.
In the case of very small sample dimensions a measurement of the reflectance is difficult and inaccurate. Because the main interest of this work is the analysis of weak, often dipole-forbidden features in the mid-infrared range, an estimate of the absorption is often very useful. Because the reflectance of an semiconductor in this energy range, above vibrational lattice modes and below the band gap, is small and nearly constant, the transmittance is approximately [55]
T ≈ (1 − R)
2exp (−α(ω)d), (2.7) with the linear absorption coefficient α = 2ωκ/c. Then the absorption of a sample is described qualitatively by
α(ω) ≈ − ln T /d + 2 ln (1 − R)/d ≈ − ln T /d + const. (2.8)
2.1.1. Anisotropic Samples: the Dielectric Tensor
The formulas given in the last section are solely valid for non-magnetic isotropic or cubic materials. Then the tensor ε ˆ = ε
ijhas just one entry and reduces to the dielectric function mentioned above. In general, the electric field E and the dis- placement field D point in different directions in an anisotropic medium, i.e. are
8
not parallel vectors. In this case the dielectric function has to be replaced by the complex dielectric tensor
ˆ ε(ω) =
ε
xx(ω) ε
xy(ω) ε
xz(ω) ε
yx(ω) ε
yy(ω) ε
yz(ω) ε
zx(ω) ε
zy(ω) ε
zz(ω)
. (2.9)
For non-magnetic materials (µ
r= 1) the ε(ω) ˆ tensor is symmetric, i.e. ε
ij= ε
ji, even for anisotropic materials. Therefore it is always possible to find a set of axes (a basis {x, y, z}) such that the real as well as the imaginary part of ε ˆ have diagonal form.
The direction of the principal axes of the real and imaginary part are not necessarily the same, but for crystal symmetries at least as high as orthorhombic the two sets of axes coincide. Confining ourselves at first to these materials the complex dielectric tensor can be written as
ˆ
ε
orthorhombic=
ε
xx(ω) 0 0 0 ε
yy(ω) 0 0 0 ε
zz(ω)
(2.10)
with ε
ii= ε
1ii+ iε
2ii(i = x, y, z). The chosen basis is clearly related to the crystal struc- ture, i.e {x, y, z} = {a, b, c}, where the latter are the crystallographic axes. Therefore all optical constants (all entries of ε) for an orthorhombic crystal can be determined ˆ experimentally using linearly polarized light parallel to the three crystallographic axes. Then the formulas given in the former section can be used component-wise, e.g. E
i= ε
iiD
iwith i = a, b, c and complex functions ε
ii(ω). Accordingly, the real part of the optical conductivity, mostly given in this work in the form ’σ
1for E || i’ is determined by the imaginary part of ε
ii(see Eq. 2.4). However, in this work we also consider compounds which exhibit a monoclinic space group. The linear dielectric response of a monoclinic compound is described by the tensor [56–58]
ˆ
ε
monoclinic=
ε
xx(ω) 0 ε
xz(ω) 0 ε
yy(ω) 0 ε
xz(ω) 0 ε
zz(ω)
(2.11)
with the monoclinic angle being β (standard notation), y k b, z k c, and x ⊥ c lying in the ac plane.
2The tensor 2.11 can be decomposed into a scalar ε
balong the b axis and a two-dimensional tensor
ˆ ε
ac=
ε
aaε
acε
acε
cc(2.12) describing the optical response within the ac plane. Due to the monoclinic angle β 6= 90
◦, the direction of the principal axes of ε ˆ
acdepends on the frequency and do not coincide for the real and imaginary part.
2Equivalent, the coordinate system can be chosenykb,zka, andx⊥awithin the acplane.
On of the most famous models of the dielectric function is the Drude-Lorentz (DL) model, which we will use particularly when analyzing phonon spectra. In terms of DL oscillators the components of ε ˆ (i, j = x, y, z) can be expressed through [56]
ε
ij(ω) = ε
∞ij+
N
X
k=1
M
kiM
kjω
20k− ω
2− iγ
kω (2.13) where ω
0k, γ
k, M
kiM
kjare the frequency, damping coefficient, and effective dipole moment corresponding to the kth of N infrared-active modes. The constant ε
∞ijreflects the contribution from high-frequency electronic excitations. Often the DL dielectric function (diagonal entries of ε ˆ for at least orthorhombic symmetry) is also rewritten with the plasma frequency ω
p[54]:
ε(ω) = ε
∞+
N
X
k=1
ω
pk2ω
20k− ω
2− iγ
kω . (2.14)
2.2. Electric-Dipole Transitions and Selection Rules
As stated in the beginning of this chapter, the optical conductivity allows to study the excitations of a solid. This section will give a brief overview of contributions to the optical conductivity in Mott insulators and the corresponding absorption mechanisms. In particular, we will focus on orbital and magnetic excitations which are the subject of the present thesis. As a start, the quantum-mechanical description of an absorption process is explained and helpful selection rules are discussed.
Electric-dipole transitions are the quantum-mechanical equivalent to the classical dipole oscillator. An electric-dipole transition between two states, an initial state Ψ
i(ground state) and a final state Ψ
f(excited state), is allowed if it is accompanied by a change of the dipole moment. This means that an incident electric field can induce a transition from Ψ
ito Ψ
fif the expectation value M
ifof the dipole operator ˆ
p = {ˆ x, y, ˆ z} ˆ is non-vanishing:
M
if= hΨ
f| p|Ψ ˆ
ii = Z
Ψ
∗fp ˆ Ψ
idr 6= 0. (2.15) The strength of the transition, i.e. the transition rate, is proportional to M
if2and the density of states ρ
fof the final state (Fermi’s golden rule):
W
if= 2π
~ |M
if|
2ρ
f. (2.16)
From the properties of the wave functions Ψ
iand Ψ
f, the selection rules for electric- dipole transitions can be deduced [59]. They are summarized in Tab. 2.1 and justified as follows:
10
Table 2.1.:
Selection rules for electric-dipole transitions [59].
Quantum number Selection rule comment Rigorous rules parity P
i· P
f= −1 parity changes
J ∆J = 0, ±1 except 0 ↔ 0
M ∆M = 0, ±1 except 0 ↔ 0 for ∆J = 0
Negligible l ∆l = ±1
configuration interaction
LS coupling S ∆S = 0 spin state does not change
only L ∆L = 0, ±1 except 0 ↔ 0
• Parity: Because the dipole operator p ˆ = {ˆ x, y, ˆ z} ˆ is odd, the wave functions of the initial and final states must have opposite parity (assuming that parity is a good quantum number).
• Orbital quantum number: The parity of the spherical harmonics is equal to (−1)
l. Hence the parity selection rule implies that ∆l must be an odd number.
A detailed evaluation of the overlap integrals yields ∆l = ±1. In the case of LS coupling the selection rule reads ∆L = 0, ±1, except from transitions from initial states with L = 0 to final states with L = 0. In the case of J is a good quantum number ∆J = 0, ±1 (0 = 0) has to be applied.
• Spin quantum number: An optical transition must not change the spin, stated by the spin selection rule ∆S = 0.
• Magnetic quantum number: The selection rule for the magnetic quantum number depends on the polarization state of the incident electric field, e.g. for unpolarized light ∆M = 0, ±1 has to be applied.
Electric-dipole transitions which obey these selection rules are so called dipole- allowed transitions.
2.2.1. Group-Theoretical Considerations
For crystalline solids, group theory is a very helpful tool because an electric-dipole
transition of e.g. a Bloch electron can be forbidden by the crystal symmetry. More-
over, group theory gives clear predictions for the number and symmetry of the
observable modes (e.g. phonons, see Sec. 2.4.1). A detailed introduction can be
found in [60, 61].
Table 2.2.:
Representation products of the irreducible representations of the orthorhom- bic point group
D2h(mmm). The bold marked entries are possible finial statesof dipole-allowed transitions.
⊗ A
gB
1gB
2gB
3gA
uB
1uB
2uB
3uA
gA
gB
1gB
2gB
3gA
uB
1uB
2uB
3uB
1gB
1gA
gB
3gB
2gB
1uA
uB
3uB
2uB
2gB
2gB
3gA
gB
1gB
2uB
3uA
uB
1uB
3gB
3gB
2gB
1gA
gB
3uB
2uB
1uA
uA
uA
uB
1uB
2uB
3uA
gB
1gB
2gB
3gB
1uB
1uA
uB
3uB
2uB
1gA
gB
3gB
2gB
2uB
2uB
3uA
uB
1uB
2gB
3gA
gB
1gB
3uB
3uB
2uB
1uA
uB
3gB
2gB
1gA
gAt first we consider a molecule with a given point symmetry at a specific ionic site.
Whether an electronic transition is forbidden or not can be derived from the product of the irreducible representations of the initial state Γ(Ψ
i) and the representation of the dipole operator Γ(ˆ p) for the given point group. If this product Γ(M ) contains the irreducible representation of the final state Γ(Ψ
f), the transition is allowed. This selection rule can be expressed as:
Γ(M ) = Γ(Ψ
i) ⊗ Γ(ˆ p) ⊃ Γ(Ψ
f). (2.17) For each of the 32 crystallographic point groups the product of the irreducible rep- resentations and those transforming as the dipole operator are tabulated [62–64].
As an example we consider the orthorhombic point group D
2h(mmm). The num- ber of irreducible representations for the D
2hpoint group is eight: A
g, B
1g, B
2g, B
3g, A
u, B
1u, B
2u, and B
3u.
3The irreducible representation of the dipole operator in the D
2hpoint group is Γ(ˆ p) = B
1u⊕ B
2u⊕ B
3u, e.g. Γ(ˆ x) = B
3u, Γ(ˆ y) = B
2u, and Γ(ˆ z) = B
1u[64]. From the representation products given in Tab. 2.2 the dipole- allowed transitions could be read directly. The bold entries are possible final states of dipole-allowed transitions, e.g. a transition from an initial state with Γ(Ψ
i) = A
gto a final state with Γ(Ψ
f) = B
1uis dipole-allowed in z polarization with the dipole operator representation Γ(ˆ z) = B
1u. In particular Tab. 2.2 shows that transitions from even (odd) to even (odd) states are dipole-forbidden.
4This holds true when- ever inversion symmetry is present at the particular ionic site.
The symmetry of a crystal is generally described by its space group which contains the usual symmetry elements as the point groups and additionally specific elements like translations, screw axes, and glide planes. Each atom in the unit cell occupies a specific site which is characterized by one or more symmetry elements, defining the
3The used nomenclature for the irreducible representations goes back to Robert S. Mulliken. For a detailed description of the specific symbols see e.g. [65] and the footnote in Sec. 4.1.
4Even states are labeled by an indexg(’gerade’), while odd states are labeled byu(’ungerade’).
12
site group. The site group is always one of the 32 crystallographic point groups and must be a subgroup of the space group. To deduce selection rules in crystals, e.g. for phonon modes observed in Raman and infrared spectra, one has to go beyond the description for molecules. Two approaches are reported in the literature: the site group analysis and the factor group analysis [62, 66]. An example for the application of the latter is given in Sec. 2.4.1.
2.3. Electronic Excitations
For a classical undoped semiconductor the lowest electronic excitations are inter- band transitions between the valance band and the conduction band. In the case of many transition-metal oxides with half-filled d shells insulating behavior was found which cannot be explained in a conventional band-structure picture. The latter predicts a metallic ground state for these materials in contrast to experimental observations. Hence the Mott-Hubbard model [3, 4] has been introduced, taking into account the strong electron-electron interaction in these materials. The single- band Mott-Hubbard model reads
H = −t X
<i,j>;σ
c
†i,σc
j,σ+ U X
i
n
i,↑n
i,↓, (2.18) with t is the hopping-matrix element between nearest-neighbor sites i and j, and U is the Coulomb repulsion between two electrons on the same site. The operator c
†i,σcreates an electron on site i with spin σ ∈ {↑, ↓} and n
i,σ= c
†i,σc
i,σis the correspond- ing number operator. The first term is the conventional band term, describing the energy gain due to delocalization of the electrons. The second term pays regard to the strong electron-electron correlations with a sizeable d-d Coulomb interaction U between two electron on the same site. These correlations are pronounced in several transition-metal compounds, due to the fact that the radial wave functions of the 3d orbitals are less expanded, giving rise to only narrow bands. The on-site Coulomb repulsion U becomes significant as soon as U is of the order of the band width, i.e.
U/W ∼ 1 at T = 0 [67]. The simplest form of the Mott-Hubbard Hamiltonian 2.18 is not always sufficient because it implies that the band gap is a d-d gap, which is not correct for most of the late transition-metal compounds, e.g. Co, Ni, or Cu
J
i j
(b) CT insulator O-2p
LHB UHB
U
∆ (a) MH insulator
O-2p LHB UHB
U
∆
Figure 2.1.:
Schematic density of states for (a) Mott-Hubbard (MH) and (b) charge-transfer (CT) insulators.
13
oxides. Here another charge-fluctuation energy is relevant, the charge-transfer en- ergy ∆. Whether the gap is of d-d or charge-transfer type depends on the relative size of U and ∆, summarized in the so-called Zaanen-Sawatzky-Allen scheme [68].
For the sake of simplicity we have specified just the single-band Hubbard model in Eq. 2.18, but a consistent description of the above-mentioned transition-metal oxides certainly requires more realistic models, which include the orbital degrees of freedom. To take into account several transition-metal d orbitals as well as the oxygen orbitals, instead of Eq. 2.18 a multi-band Hubbard model has to be con- sidered [69–71]. In addition Eq. 2.18 can be extended to include hopping between next-nearest neighbors and/or third nearest neighbors [72].
The most important difference to conventional semiconductors is that the internal degrees of freedom, spin and orbital, still survive in Mott insulators [5].
5The low- est electronic excitation corresponds to the transfer of one electron from the lower Hubbard (LHB) band to the upper Hubbard band (UHB), and accordingly for a charge-transfer insulator from the LHB to the oxygen-2p band (Fig. 2.1). The exci- tation in a Mott-Hubbard insulator then is equivalent to the transfer of one electron from one metal ion site with 3d
nelectron configuration to another one, i.e., from 3d
n3d
nto 3d
n−13d
n+1, and for a charge-transfer insulator from 3d
n2p
6to 3d
n+12p
5. Optical spectroscopy is a powerful tool to investigate such interband excitations (for a review see e.g. [71, 73]). In particular, the famous f-sum rule gives clear predictions. This rule relates the integrated optical conductivity directly to the density of charged objects, their charge and mass:
Z
∞ 0Re(σ(ω))dω = X
i
πq
i2N
i2m
iV , (2.19)
where N
idenotes the number of charges, V the volume, m
ithe masses of the particles in the solid, and q
itheir charges. It reflects the fundamental property that also in strongly correlated matter the number of electrons is conserved [73].
2.4. Low-Energy Excitations in Correlated Insulators
The optical conductivity of undoped correlated insulators below the onset of inter- band excitations is purely determined by phonons, magnetic excitations, and orbital excitations.
5Because in a Mott insulator the double occupation of an orbital costs U, different spin and orbital states are available for an electron. In a conventional semiconductor the orbitals are occupied with spin-up and spin-down in the same manner.
14
2.4.1. Phonons
The optical conductivity for energies below ∼ 100 meV (FIR) is dominated by lattice vibrations. Due to the strong phonon absorption, measurements of the transmit- tance are only possible with powder samples or extremely thin samples (<10 µm), which are hard to prepare. Therefore the phonon spectra are typically investigated by reflectance measurements and a subsequent Kramers-Kronig analysis to deter- mine the optical conductivity [74].
Again, group theory is very helpful, because the number and symmetry of dipole- allowed phonon modes for a given space group can be calculated by applying the so-called factor group analysis [62, 66]. The factor group approach assumes that all modes of a crystal can be determined by considering only one unit cell [66]. The atomic positions in the unit cell build the basis for the formation of reducible rep- resentations of a group composed of the symmetry elements of the unit cell. The advantage is that the factor group is always isomorph to one of the 32 crystallo- graphic point groups, for which the character tables are known [62–64] (e.g. for D
2hsee Tab. 2.2). As an example for the factor-group analysis, the phonon modes of YVO
3are briefly discussed in the following. The symmetry of YVO
3is described by the space group Pbnm using the Herman-Mauguin symbols, or by D
162husing the
2 the room-temperature reflectivity for all three polarizations is shown together with the optical conductivity. As can be seen, there are nine, nine, and seven optically active modes for the a, b, and c axes, respectively. The positions of the TO phonon frequencies are shown by vertical lines and the fre- quencies are given in Tables I and II. Some resonances are very weak. For example, the mode of highest frequency for the c axis is hardly visible in the conductivity and appears as a shoulder on the reflectivity curve. It gains intensity as the temperature is lowered and reaches its maximum in the low- temperature orthorhombic phase. Shown in Fig. 3 is the tem- perature dependence of the reflectivity for all three polariza- tions. The number of the phonons stays the same between room temperature and 200 K. Below 200 K a number of additional phonons gradually emerge. We illustrate this by picturing some of the new modes for the b and c axes in Fig.
4. As can be seen from the figure, the intensity of the new modes evolves continuously and monotonically as the tem- perature decreases, reaching its maximum at 75 K. The op- tical strengths remain, however, one or two orders of magni- tude weaker than that of the original main modes. Below 75 K the new phonons discontinuously disappear. As an ex- ample, the temperature dependence of the oscillator strength of the new 522 cm⫺1 mode is shown in Fig. 4.
To analyze the observed phonon spectra, we apply a group theory analysis. The primitive cell of YVO3 contains four formula units, yielding 60 phonon modes in total. In the Pbnm lattice the four yttrium atoms and four vanadium at- oms occupy equivalent sites 4c and 4b in Wyckoff notation with site symmetry Cxz and Ci, respectively. The 12 oxygen
8d with site symmetry Csxz and C1, respectively. Using the usual procedure,12 we find that the phonon normal modes transform according to
⌫⫽7Ag⫹8Au⫹5B1g⫹10B1u⫹7B2g
⫹8B2u⫹5B3g⫹10B3u.
The total representation ⌫ can be subdivided into three acoustic vibrational modes B1u⫹B2u⫹B3u, 24 Raman- active modes 7Ag⫹5B1g⫹7B2g⫹5B3g, eight silent Au FIG. 1. Pbnm orthorhombic crystal structure of YVO3.
FIG. 2. Room-temperature reflectivity and corresponding optical conductivity for the three crystallographic directions. Dashed lines indicate positions of the phonon modes. There are nine, nine, and seven modes for the a, b, and c axes, respectively, in agreement with the Pbnm symmetry.
TABLE I. TO phonon modes for the a and b axes at room temperature.
B1u共a兲 B3u共b兲
(cm⫺1) ␥ (cm⫺1) Sa (cm⫺1) ␥ (cm⫺1) Sb
162.2 3.2 0.08 144.3 15.5 0.73
211.6 8.5 5.4 237.4 5.5 2.0
328.5 9.9 1.6 280.1 8.4 0.64
359.2 15.0 0.56 318.7 7.8 0.35
420.8 10.4 1.4 374.5 6.3 0.22
446.8 17.3 2.6 390.7 16.5 4.21
494.5 10.0 0.005 471.7 13.3 1.2
517.5 15.5 0.06 543.7 9.8 0.86
572.4 22.6 0.91 559.8 17.5 0.21
STRUCTURAL, ELECTRONIC, AND MAGNETO-OPTICAL . . . PHYSICAL REVIEW B 69, 075110 共2004兲
Figure 2.2.:
Room-temperature reflectance and corre- sponding optical conductivity of YVO
3for polarization to the three crystallographic directions, i.e.
Eka,b, andc. Dashed linesindicate positions of the TO phonon fre- quencies. There are nine, nine, and seven modes for the
a, b, and caxes, respec- tively, in agreement with the
Pbnmsym- metry. Reproduced from [75].
15
Schoenflies notation [29, 76]. The number of formula units per unit cell is Z = 4.
Therefore 3 acoustic and 3(N − 1) = 3(4 · 5 − 1) = 57 optical modes are expected. To determine the irreducible representations, the symmetry-equivalent positions termed by the Wyckoff symbols have to be considered. For YVO
3they are 4a for V(1), 4c for Y(1) and O(1), and 8d for O(2). The site symmetry is C
i( ¯ 1) for 4a, C
s(m) for 4c, and C
1(1) for 8d, respectively. Then the full representation M is given by the product of (multiples of) the representations for the site symmetries [63]
M = M (C
1) + 2M (C
s) + M (C
i)
= 3A
g+ 3A
u+ 3B
1g+ 3B
1u+ 3B
2g+ 3B
2u+ 3B
3g+ 3B
3u+ 2(2A
g+ 1A
u+ 1B
1g+ 2B
1u+ 2B
2g+ B
2u+ B
3g+ 2B
3u) + 3A
u+ 3B
1u+ 3B
2u+ 3B
3u= 7A
g+ 8A
u+ 5B
1g+ 10B
1u+ 7B
2g+ 8B
2u+ 5B
3g+ 10B
3u.
These include 3 acoustic modes B
1u+ B
2u+ B
3u, 24 Raman-active modes 7A
g+ 5B
1g+ 7B
2g+ 5B
3g, 25 infrared-active modes 9B
1u+ 7B
2u+ 9B
3uand 8 silent modes 8A
u.
6The infrared vibrations split into 9 B
1u(E k a), 9 B
3u(E k b), and 7 B
2u(E k c).
The number as well as the proposed polarization dependence of the infrared-active modes is verified by reflectivity measurements on YVO
3at room temperature [75]
(see Fig. 2.2). Another example of the application of the factor group analysis is given in Sec. 5.2.2, where we consider the phonon modes of SrCuO
2.
2.4.2. Orbital Excitations: Local Crystal-Field Excitations vs.
Orbitons
Strongly correlated transition-metal compounds are discussed as promising candi- dates for the observation of novel orbital excitations, which exhibits a collective, dispersive nature. For the identification of the so-called orbitons by optical spec- troscopy it is crucial to exclude that local, single-site excitations or excitons are responsible for the observed absorption features. For a single ion embedded in a host crystal the crystal-field theory often gives clear predictions for local crystal-field excitations. Therefore molecular-orbital theory or cluster calculations including the full Madelung potential are often helpful tools. In the subsequent paragraphs possi- ble absorption processes for local and collective orbital excitations are consecutively introduced.
Local Crystal-Field Excitations
In many cases it is justified to describe 3d transition-metal compounds in a local limit because the double occupancy of a single site costs about U (or ∆), which is about several eV. The local crystal field of the surrounding ligands affects the energy
6Neither infrared nor Raman active.
16
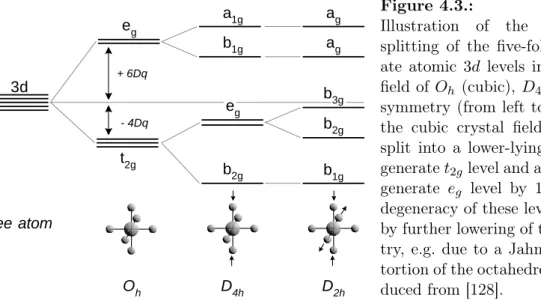
level diagram on the metal ion site and has to be considered. The ligand field lifts the degeneracy of the atomic 3d levels, depending on its symmetry. For example, the 3d levels of a 3d
1ion in an octahedral ligand field split into a lower-lying triply degenerate t
2gand a higher-lying two-fold degenerate e
glevel. The energy difference of these levels is denoted by 10Dq. For the same ion in a tetrahedral ligand field the order of the levels is reversed, i.e. the e
gare lower in energy than the t
2glevels.
However, for more than one electron the level diagram is much more complicated because the electron-electron interaction has to be taken into account (see Fig. 4.28).
For the case of an octahedral ligand field the corresponding multiplets for 3d
nions are tabulated in the so-called Sugano-Tanabe-Kamimura diagrams [77].
Restricting ourselves to the easiest case of a 3d
1ion in an octahedral ligand field, the single electron occupies the t
2glevel in the ground state. Then the lowest excitation corresponds to a transfer of the electron to the e
glevel. This is a local excitation, no charge is transferred between different metal ions. For the contribution to the optical conductivity the selection rules for electric-dipole transitions have to be considered (Tab. 2.1). As mentioned above d-d excitations are not infrared- allowed because of the orbital and parity selection rule. However, in real spectra d-d transitions are often observed because there are effects that evade the strict selection rules. The most relevant, according to Ref. [78], are the following:
(i) Spin-orbit coupling can be responsible for the admixing of terms of different spin multiplicity which gives rise to the observation of spin-forbidden transi- tions. As an example we consider a transition from
1W + α
3Z to
3X + β
1Y with α and β being the mixing coefficients that are parameterized by the spin-orbit coupling coefficient λ
h
3X + β
1Y | p| ˆ
1W + α
3Zi = h
3X|ˆ p|
1W i
| {z }
=0
+ αβ h
1Y |ˆ p|
3Zi
| {z }
=0
(2.20) + αh
3X|ˆ p|
3Zi
| {z }
6=0
+ βh
1Y |ˆ p|
1W i
| {z }
6=0
.
While terms with different spin multiplicity vanish, terms with equal ones con- tribute to the optical conductivity, and it is said that the transition ’
1W →
3X’
becomes weakly ’allowed’, certainly depending on λ.
(ii) If no inversion symmetry is present at the metal site it is possible that proper wave functions involve a mixture of e.g. d and p wave functions:
hd
0+ δp
0| p|d ˆ + γpi = hd
0|er|di
| {z }
=0
+ γδhp
0|er|pi
| {z }
=0
+ γhd
0|er|pi
| {z }
6=0
+ δhp
0|er|di
| {z }
6=0
. (2.21)
The last two terms survive both, the parity and the orbital selection rule to
the extent that the mixing coefficients γ and δ are non-zero in non-centric
complexes. In this case spin-allowed transitions are observed with intensities
Figure 2.3.:
An
ungeradevibration of an octa- hedron. Reproduced from [78].
100 times larger than spin-forbidden ones, but still a few orders of magnitude less intense than fully allowed transitions.
(iii) If inversion symmetry is present on the metal site the only way to avoid the selection rules is the simultaneous excitation of a phonon that removes the center of inversion. An example of such a symmetry-breaking mode is depicted in Fig. 2.3. At any instant during the vibration, d-p mixing can occur and, in the manner of Eq. 2.21, a d-d transition can become partially allowed. Because the p-d mixing is smaller in the dynamic environment than in the static one, the intensity of phonon-induced transitions is expected to be noticeably weaker.
(iv) In real samples, inversion symmetry may additionally be broken by impurities or other lattice imperfections, e.g. oxygen non-stoichiometry. However, the contribution is expected to be still much smaller than the phonon-assisted one in the case of low impurity concentrations.
If the crystal structure shows no inversion symmetry on the transition-metal site (item (ii)), clear predictions on the polarization dependence of the orbital absorption features can be made. The (local) symmetry of the mixed states can be determined unambiguously within a point-charge model [15, 79]. In the case of a simultaneously excited odd-symmetry phonon (item (iii)), the polarization dependence is less pro- nounced because in general phonons of arbitrary polarization may contribute, i.e.
p
x, p
yas well as p
zcharacter can be mixed into the 3d states. In order to determine the orbital excitation energy, the phonon energy has to be subtracted from the ex- perimentally observed peak position. However, different phonons may participate in breaking the symmetry. Typically, stretching and bending modes of the metal- oxygen bonds are most effective in doing so (Fig. 2.3). These modes have typical energies of the order of 50 - 80 meV for the compounds considered here.
Independent of the mechanism to evade the strict selection rules, the absorption bands identified with local d-d transitions typically show a pronounced broadening due to the Franck-Condon effect [80–83]. The Franck-Condon principle assumes that a crystal-field transition most likely occurs without changing the positions of the nuclei [78], i.e. crystal-field transitions taking place in about 10
−15sec are essentially instantaneous compared with the time scale of nuclear motions of about 10
−13sec. Therefore the transition is vertical in the corresponding energy diagram
18
energy
bond length ground state
excited state
1 2
3 4
0 1
2 3
4
0
energy
absorption
∆x
Figure 2.4.:
Sketch of the Franck-Condon principle depicting the energy diagram of a crystal-field transition coupled to phonons. The two curves (parabola) cor- responds to the orbital ground (excited) state and represents the harmonic potential of the lattice. The horizontal bars within each potential represent the energy levels of the normal modes of the lattice. Strong bonds correspond to steep potentials with large spacings between the energy levels, while weak bonds have shallow potentials with smaller separations. The horizontal off- set
∆xbetween the minima of the two potentials indicates that the relaxed bond length differs between ground state and excited state. The upward ar- row represents the absorption process. Quantum mechanically, the intensity of a vibronic transition is proportional to the square of the overlap integral between the phonon wave functions of the two orbital states that are involved in the transition. By summing up the contributions from the different ex- cited states, a broad absorption peak is obtained as shown on the upper right side of the figure. Due to the phonon dispersion and the contribution of phonons with different energies, the sharp sub-bands of individual excited states are usually not resolved in a solid, yielding a single broad band. For details see [80–83] and text books, e.g. [54, 78].
(for details we refer to the caption of Fig. 2.4). At low temperatures an incident
phonon yields a transition from the zero-vibronic ground state that ends in a higher
vibronic excited state (higher, with respect to the relaxed one). The probability
for the transition to end in a particular vibronic excited state is determined by the
overlap of the phonon wave functions at the initial and final state. In Fig. 2.4 the
transition from the relaxed ground state (0) to the second-vibronic excited state (2) is the most likely. But also the transitions to the 0, 1, 3, 4 states may exhibit a finite probability, resulting in several absorption lines for the corresponding d-d transition.
Beside spin-orbit coupling (item (i)), there is another possibility to evade the spin selection rule. This is, to excite two spin-carrying modes simultaneously such that the total spin equals zero. An orbital excitation from e.g. a triplet to a singlet state may gain finite spectral weight by the simultaneous excitation of a magnon, giving rise to a so-called magnon-exciton sideband [84–86]. Typically, the spectral weight of these processes is even smaller than in the cases where spin was not involved.
But, occasionally some bands which otherwise are expected to be weak are observed to be quite strong, e.g. when the energy of a spin-forbidden excitation is comparable with those of spin-allowed transitions [78]. Such an effect can be due to the so-called
’intensity stealing’ where a spin-forbidden transition acquires intensity by ’stealing’
from e.g. a spin-allowed (e.g. as described above in item (i)) or a charge-transfer band.
Collective Orbital Excitations (Orbitons)
As mentioned in the beginning, transition-metal oxides with strong electron corre- lations are promising candidates for the observation of so-called orbital waves or orbitons [11, 17, 87–89]. It is known for a long time that the orbital degree of free- dom shows long-range order, the so-called orbital order [34]. There exists different mechanisms that can cause orbital order, e.g. the electron-lattice coupling, the Jahn- Teller interaction [6], or a purely electronic (exchange) interaction [90]. The latter is of particular interest, because in general any kind of order from a spontaneously broken symmetry gives rise to new elementary excitations [91]. In the case of e.g.
long-range magnetic order these new excitations are the well-known spin waves or magnons. In analogy, a collective orbital excitation is termed orbital wave and its quantized objects are called orbitons [11, 17, 87–89].
Orbital and spin degrees of freedom are intimately connected with each other
Figure 2.5.:
![Figure 4.6.: Crystal structure of YVO 3 in several phases reported by [29, 76]. (a) Or- Or-thorhombic crystal structure of YVO 3 below 77 K and above 200 K](https://thumb-eu.123doks.com/thumbv2/1library_info/3700411.1505971/49.892.165.737.164.488/figure-crystal-structure-phases-reported-thorhombic-crystal-structure.webp)
![Figure 4.9.: Comparison of the results of the two optical studies of the electronic structure of YVO 3 [75, 135]](https://thumb-eu.123doks.com/thumbv2/1library_info/3700411.1505971/53.892.147.749.176.932/figure-comparison-results-optical-studies-electronic-structure-yvo.webp)