in a distributed web service environment
I n a u g u r a l - D i s s e r t a t i o n
zur
Erlangung des Doktorgrades
der Mathematisch-Naturwissenschaftlichen Fakultät der Universität zu Köln
vorgelegt von Anika Jöcker
aus Haan
2009
Prof. Dr. Martin Hofmann-Apitius
Tag der letzten mündlichen Prüfung: 24 April 2009
Während die Anzahl öffentlich verfügbarer genomischer Sequenzen stetig steigt, sind die meisten Gene nicht ausreichend funktionell charakterisiert. Die Bestimmung der Genfunktion und die Entdeckung funktionaler Beziehungen zwischen Genen wird die nächste große Herausforderung im post-genomischen Zeitalter.
In diesem Kontext sind einerseits verbesserte Pipelines und Programme notwendig, denn die Durchführung von Experimenten würde zu viel Zeit in Anspruch nehmen. Andererseits müssen automatische Vorhersagen manuell überprüft werden, um ihre Glaubwürdigkeit beurteilen zu können und um ein umfassenderes Bild über die Funktion jedes einzelnen Gens zu bekommen.
Häufig findet die automatische funktionale Annotation von Genen durch den Transfer von Funktionen von bereits funktional charakterisierten Genen statt, wobei Programme wie Blast benutzt werden. Allerdings hat dieser Ansatz viele Nachteile und macht systematische Fehler, da Speziations- und Duplikationsereignisse nicht mitberücksichtigt werden. Der phylogenomische Ansatz allerdings ist in der Lage die Vorhersagegenauigkeit wesentlich zu verbessern, indem die evolutionäre Geschichte von Genen mit in Betracht gezogen wird.
In dieser Arbeit wird der manuelle Prozess von der Assemblierung der DNS bis zu der funktionalen Charakterisierung von Genen und der Identifikation und dem Vergleich von syntänischen Regionen am Beispiel einer Region im Kartoffelchromosom V erklärt und Probleme diskutiert. Weiterhin werden Kandidatengene in der Region ermittelt, die bei der Pathogenresistenz eine Rolle spielen.
Um die automatische funktionale Annotation in Genomprojekten zu verbessern, wird eine phylogenomische Pipeline vorgestellt, welche SIFTER, eins der besten phylogenomischen Programme, beinhaltet. Diese Pipeline wird verbessert und an den Genomen von Medicago truncatula, Sorghum bicolor und Solanum lycopersicum getestet. Um neue Kandidatengene herauszufinden, die zur Entwicklung von Medikamenten und Pflanzenschutzmitteln verwendet werden könnten, werden nicht-pflanzenspezifische Gene, wie zum Beispiel die Transferrin Familie, die bis jetzt in Pflanzen unbekannt war, aus dem Genom von M. truncatula und S. bicolor herausgefiltert und näher untersucht.
Um die Annotation weiter zu verbessern, wird ein neuer phylogenomischer Ansatz entwickelt.
Dieser benutzt annotierte Funktionsattribute wie zum Beispiel Interaktionspartner, Proteindomänen usw., um die Funktionsmutationsrate zwischen Genen und Gengruppen in einem phylogenetischen Baum zu ermitteln und um herauszufinden, ob die Funktion von einem Gen oder einer Gengruppe auf ein anderes oder eine andere übertragen werden kann. Dieser neue Ansatz wird in das SIFTER Programm integriert und wird an der Blue-light photoreceptor/Photolyase Familie und an einem Testdatensatz von manuell kurierten Arabidopsis thaliana Genen getestet. Die Vorhersagegenauigkeit konnte für beide Datensätze signifikant verbessert werden.
Da Genfunktionen mit bioinformatischen Methoden nie mit hundertprozentiger Genauigkeit vorhergesagt werden können, wird das AFAWE System zur manuellen Annotation vorgestellt. In AFAWE werden verschiedene Web Services zur funktionalen Annotation gestartet und die Ergebnisse und Zwischenergebnisse so dargestellt, dass sie einfach zu vergleichen sind. AFAWE kann für jeden Organismus und jede Art von Gen verwendet werden. Aufgrund seiner flexiblen Struktur, können neue Web Services und Workflows leicht in AFAWE integriert werden. Zur Zeit ist neben Blast-Suchen in verschiedene Datenbanken und Programmen zur Suche von Proteindomänen, auch die phylogenomische Pipeline in AFAWE als Analyse verfügbar.
Verschiedene Filter helfen dem Benutzer glaubwürdige Vorhersagen von unglaubwürdigen zu unterscheiden. Weiterhin kann eine detaillierte manuelle Annotation zu jedem Gen angegeben werden, welche dazu benutzt werden soll, die automatische Annotation in öffentlichen Sequenzdatenbanken wie MIPSPlantsDB zu ersetzen.
While the number of genomic sequences becoming available is increasing exponentially, most genes are not functionally well characterized. Finding out more about the function of a gene and about functional relationships between genes will be the next big bottleneck in the post-genomic era.
On the one hand improved pipelines and tools are needed in this context, because running experiments for all predicted genes is not feasible. On the other hand manual curation of the automatic predictions is necessary to judge the reliability of the automatic annotation and to get a more comprehensive view on the function of each individual gene.
For the automatic functional annotation often a homology based function transfer from functionally characterized genes is applied using methods like Blast. However, this approach has many drawbacks and makes systematic errors by not taking care of speciation and duplication events.
Phylogenomics has shown to improve the functional prediction accuracy by taking the evolutionary history of genes in a phylogenetic tree context into account.
In this thesis the manual process from the assembly of the DNA sequence to the functional characterization of genes and the identification and comparison of shared syntenic regions, including the identification of candidate genes for pathogen resistance in potato chromosome V, is explained and problems discussed. To improve the automatic functional annotation in genome projects, a phylogenomic pipeline, which includes SIFTER one of the best phylogenomic tools in this area, is introduced, improved and tested in the Medicago truncatula, Sorghum bicolor and Solanum lycopersicum genome projects. To obtain new candidate genes for the development of new drugs and crop protection products, non-plant specific genes, like the transferrin family which is not known in plants yet, are extracted from the M. truncatula and S. bicolor genomes and further investigated.
For further improvement of the annotation, a new phylogenomic approach is developed. This approach makes use of annotated functional attributes to calculate the functional mutation rate between genes and groups of genes in a phylogenetic tree and to find out if the function of a gene can be transferred or not. The new approach is integrated into the SIFTER tool and tested on the blue-light photoreceptor/photolyase family and on a test set of manually curated Arabidopsis thaliana genes. Using both test sets the prediction accuracy could be significantly improved and a more comprehensive view on the gene function could be obtained.
But because still no tool is able to annotate all functions of a gene with 100% accuracy, I introduce a system for manual functional annotation, called AFAWE. AFAWE runs different web services for the functional annotation and displays the results and intermediate results in a comprehensive web interface that facilitates comparison. It can be used for any organism and any kind of gene. The inputs are the amino acid sequence and the corresponding organism. Because of its flexible structure, new web services and workflows can be easily integrated. Besides Blast searches against different databases and protein domain prediction tools, AFAWE also includes the phylogenomic pipeline. Different filters help to identify trustworthy results from each analysis. Furthermore a detailed manual annotation can be assigned to each protein, which will be used to update the functional annotation in public databases like MIPSPlantsDB.
I am very grateful to many people for helping me attain my Ph.D. Without their help it would not have been possible for me to succeed.
First of all I like to express special thanks to Dr. Heiko Schoof who gave me the possibility to realize my ideas as a member of his bioinformatics research group at the Max-Planck Institute for Plant Breeding Research in Cologne. I am very grateful for his guidance, all the inspiring discussions, his support and his critical reading. From him I learned to work independently and I had the possibility to work together with many different people within the institute and around the world in research projects.
I also like to say special thanks to Prof. Dr. Thomas Wiehe from the Genetics Institute at the University of Cologne for being my supervisor, for his guidance, his support and the valuable discussions we had. I also like to thank him for all the commentaries and suggestions he gave me on my thesis and for his constitutive words.
My gratitude goes also to my co-advisors, Prof. Dr. Martin Hofmann-Apitius from the Fraunhofer Institute SCAI and Dr. Ulrike Göbel for their interest in the projects, their support and their critical reading of the thesis.
Thanks also to Prof. Dr. Martin Hülskamp for being the chairman of the examination committee.
Many thanks to Ph.D. Barbara Engelhardt and Prof. Ph.D. Steven Brenner for providing me with the SIFTER code and for very helpful discussions and advice. Special thanks also to Dr. Michael Plümer for helping me in questions concerning the SIFTER framework and Jens Warfsmann for discussions and reading.
Also I like to thank Dr. Agim Ballvora, members of the MIPS institute in Munich, members of the international tomato annotation group (ITAG) and members of the international Medicago annotation group (IMGAG) for successful collaboration. In particular Dr. Chris Town, Manuel Spannagl, Dr. Klaus Mayer and Dr. Remy Bruggmann I am deeply grateful for providing me necessary data and analysis results, for their support and their very helpful advice.
I am also indebted to my parents and my best friend Sabrina Heinhaus for their support. They were always willing to listen to my problems although they do not really understand what I am doing here.
Especially I like to thank my beloved husband Andreas, my workmate, flat mate, travel mate and constituent partner in many discussions. Thank you for your love, patience, support and motivation.
I am deeply grateful for all your comments and suggestions being the first reader of the chapters of my thesis. I dedicate this thesis to you. Thank you for the wonderful two years we had together in Cologne. I am looking forward to our future in Heidelberg and all the things we have planned.
I. Introduction & Motivation...1
II. Aim of the thesis...3
III. Background...4
1) Automatic functional prediction...4
a) Function description with ontologies...5
b) Homology based transfer...6
c) Chromosomal proximity...8
d) The Rosetta Stone method...8
e) Phylogenetic profiles...9
f) Structural information...9
g) Expression data...9
2) Web services...10
a) Introduction data integration...10
b) The BioMOBY project...10
3) Web service workflows and reusement of workflows...11
a) The Taverna project...11
b) MyExperiment...11
IV. Manual annotation and comparison of shared syntenic regions in a hot spot for pathogen resistance in Solanum tuberosum, Solanum demissum and Arabidopsis thaliana to discover new QTLs...12
1) Introduction and aims of the project...12
2) Materials and Methods...12
a) Sequencing, assembly and gene prediction...12
b) Manual functional annotation...13
c) Shared micro-synteny with the Arabidopsis thaliana and the Solanum demissum genome. 13 3) Results...13
a) Shared micro-synteny with Solanum demissum...16
b) Shared micro-synteny with Arabidopsis thaliana...16
4) Discussion...17
V. Automatic annotation in genome projects...19
1) Introduction...19
2) Material & Methods...22
a) Homolog detection...22
b) Pipeline implementations to assign Gene Ontology terms to genes...25
c) GO term annotation...28
d) Comparison of the number of proteins annotated in the most general GO term categories.28 e) The accuracy of SIFTER...29
f) Looking for genes, which are unknown in plants, but have been functionally characterized in animals...29
g) Verification of the gene prediction results in the tomato genome project...30
3) Results...31
a) GO term annotation...31
b) SIFTER accuracy...36
c) Non-plant specific genes...38
d) Validation of the gene prediction results in the tomato genome project...41
4) Discussion...42
VI. An accurate phylogenomic tool for automatic function prediction...46
b) Extension of the SIFTER algorithm (SIFTER-X)...48
c) Building the first test set “The Blue-Light Photoreceptor/Photolyase family”...50
d) Building a curated data set of A. thaliana genes...50
e) Applying SIFTER and SIFTER-X on the test datasets...51
f) Evaluation of the SIFTER and SIFTER-X results...51
g) Evaluation of the Blast results...52
3) Results...52
a) Application I: The Blue-Light Photoreceptor/Photolyase family...52
b) Prediction accuracy comparison for molecular function GO terms between SIFTER & SIFTER-X...63
c) KEGG ontology, MapMan bin and EC term prediction accuracy...65
4) Discussion...67
VII. Manual curation in genome projects...70
1) Introduction...70
2) Material & Methods...71
a) Finding suitable web services for the AFAWE system...71
b) The AFAWE design...73
c) Analyses...74
d) AFAWE Filter...75
e) Implementation of the AFAWE database...75
f) Data Access Objects and Transfer Objects...77
g) Integration of the Taverna workflow engine...77
h) Development of the AFAWE web interface...77
i) Connection to the MIPSPlantsDB database...77
3) Results...79
a) Finding suitable web services for the AFAWE system...79
b) How to do a manual annotation using AFAWE...81
4) Discussion...87
VIII. Summary and Discussion ...88
IX. Outlook...93
X. Appendix...94
1) 100 manual inspected Medicago gene predictions made by SIFTER...94
2) Alignment of the photolyase/blue-light photoreceptor family...103
XI. References...111 List of Publications...
Declaration...
Curriculum vitae...
Table 1: Initial probabilities given by SIFTER for the GO evidence codes...7
Table 2: Gene association files downloaded from Gene Ontology and files/web services used to build a database of proteins, which have an experimentally verified or reviewed GO term assignment...23
Table 3: Mapping between GO terms and RefSeq identifiers via database identifiers from the gene association files from Gene Ontology...25
Table 4: Number of genes in the main "molecular function" GO categories of M. truncatula, S. bicolor, O. sativa, A. thaliana, M. musculus, H. sapiens and R. norvegicus...34
Table 5: Number of genes annotated in the most common molecular function Gene Ontology categories by the phylogenomic pipeline with SIFTER and InterProScan in combination with InterPro2GO...35
Table 6: Number of genes annotated in the most common biological process Gene Ontology categories by InterProScan in combination with InterPro2GO...36
Table 7: Wrong annotations made by SIFTER...36
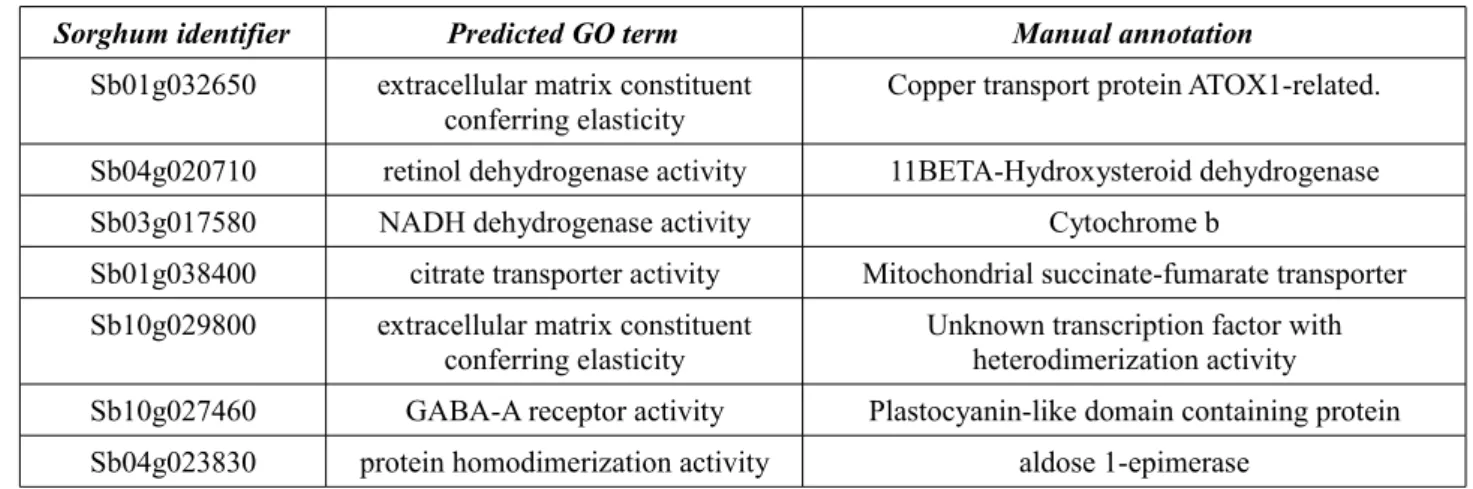
Table 8: Sorghum genes, for which the best predicted GO term is wrong...38
Table 9: Non-plant specific genes found in the Sorghum genome...41
Table 10: Number of tomato genes with an overall overlap smaller than 50%, 60% and 70% to the best matching Arabidopsis gene...41
Table 11: Overlap between aligned region and query is smaller than the threshold, i.e. the tomato sequence is longer...41
Table 12: Overlap between aligned region and hit is smaller than the threshold, i.e. the tomato sequence is shorter...42
Table 13: New XML elements of the new PLI file used as input by SIFTER-X...47
Table 14: Annotated biological process GO terms for A. thaliana Cryptochrome1 and Cryptochrome2...55
Table 15: Molecular function GO term predictions made by SIFTER and SIFTER-X for proteins of the blue-light photoreceptor family...57
Table 16: Biological process GO term predictions by SIFTER-X for photolyase proteins (subgroup I) at a posterior probability cutoff of 0.1...59
Table 17: Biological process GO term predictions by SIFTER-X for blue-light photoreceptor proteins...63
Table 18: Comparison between the sensitivity and specificity of SIFTER and SIFTER-X on a test set of 232 Arabidopsis genes...65
Table 19: The sensitivity and specificity of SIFTER-X in the prediction of KO terms, MapMan bins and EC numbers on a test set of 232 Arabidopsis genes...66
Table 20: Tested web services from the VBI, EBI and NCBI...71
Table 21: EBI web services and other programs were wrapped as BioMoby web services...72
Table 22: AFAWE web services to retrieve data from the AFAWE database and run remotely AFAWE analysis tools...79
Figure 1: Setting of the initial likelihood for each candidate GO term to each gene in the
phylogenetic tree by SIFTER...8
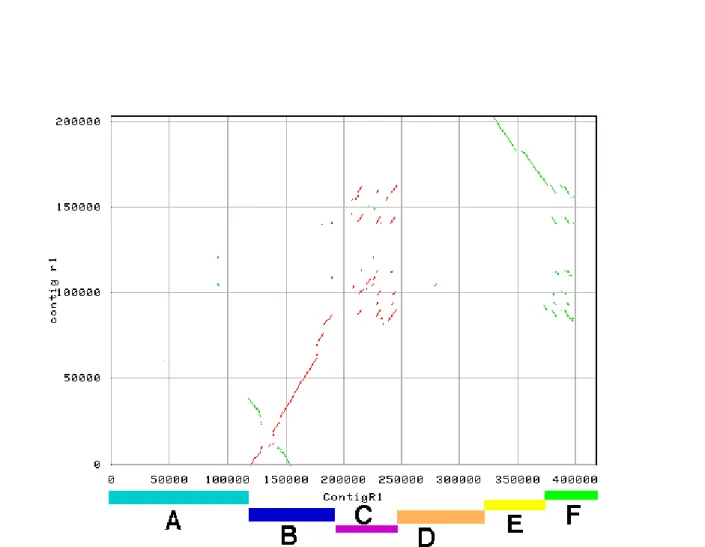
Figure 2: Comparison of the haplotypes R1 with r1 of Solanum tuberosum...14
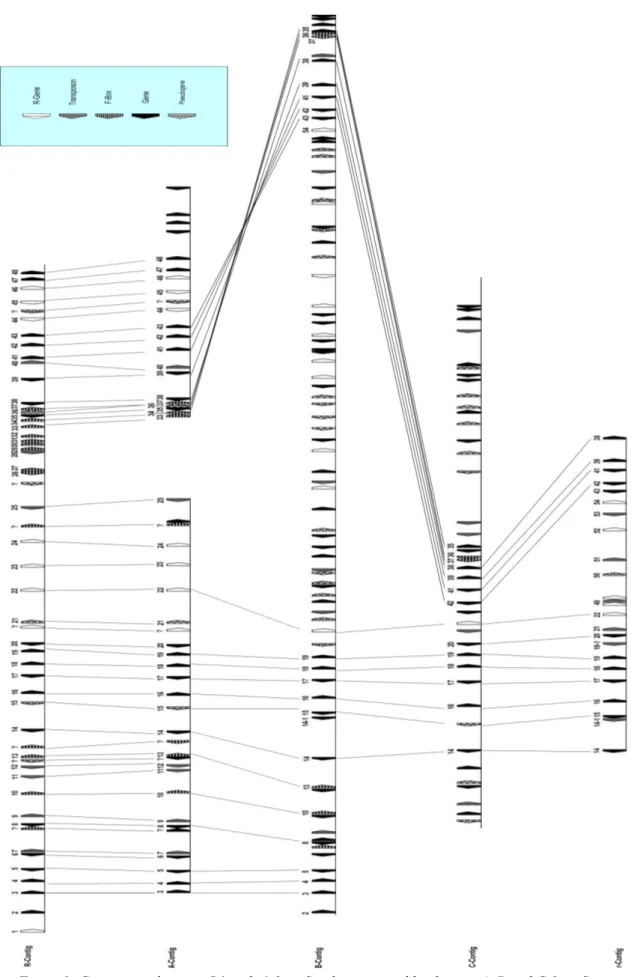
Figure 3: Comparison between R1 and r1 from S. tuberosum and haplotypes A, B and C from S. demissum...15
Figure 4: Harvesting of tomato fruits for research...21
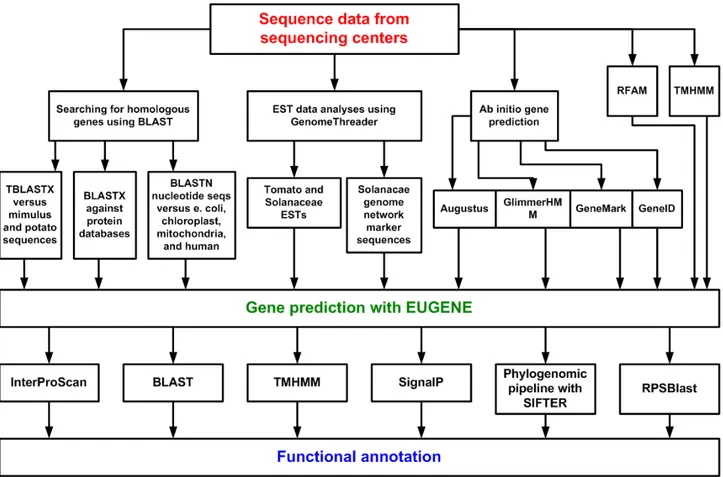
Figure 5: ITAG pipeline...22
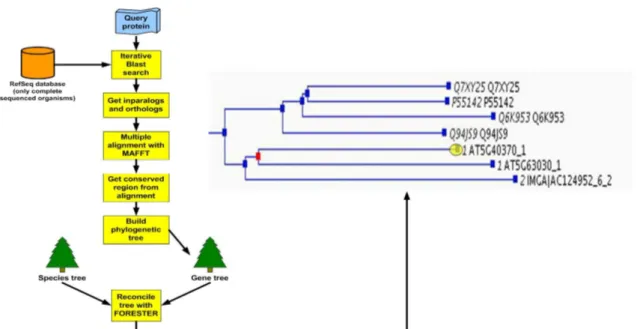
Figure 6: Pipeline for the automatic annotation of M. truncatula genes...26
Figure 7: New SIFTER pipeline...27
Figure 8: Taverna SIFTER workflow in MyExperiment...27
Figure 9: Comparison between InterProScan and SIFTER in number of annotated genes...31
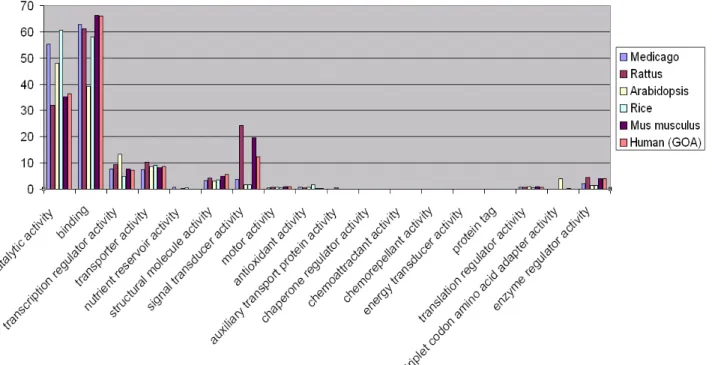
Figure 10: Comparison between genomes of different species and the Medicago genome in number of annotated genes in most general "molecular function" Gene Ontology categories...31
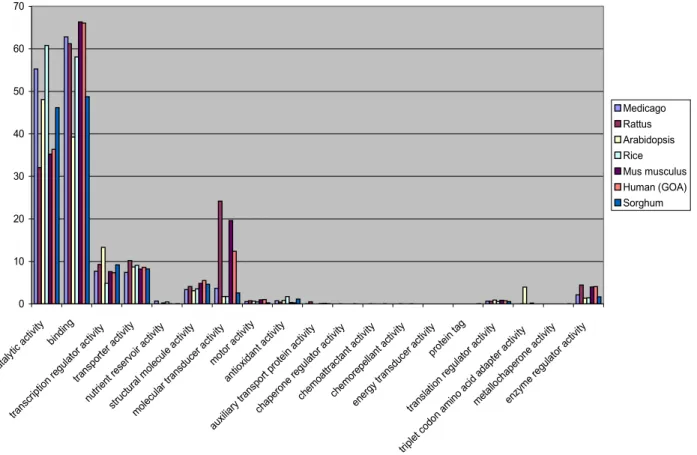
Figure 11: Comparison of the number of genes in the most general "molecular function" Gene Ontology categories between different organisms...33
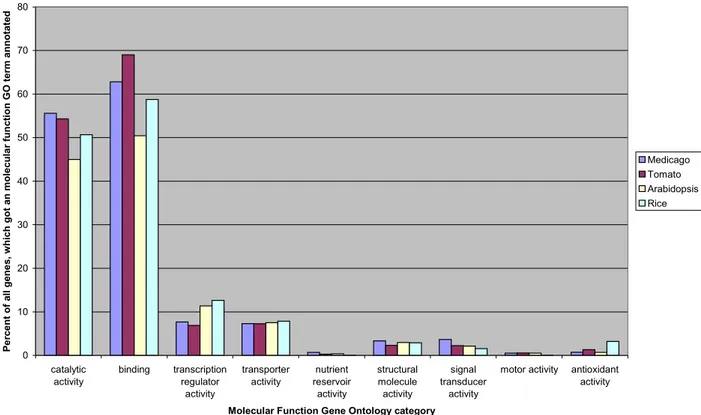
Figure 12: Comparison between the number of genes in the most general Gene Ontology categories from different plants...36
Figure 13: Wrong prediction made by SIFTER in case of Medicago gene AC149131_5.2...37
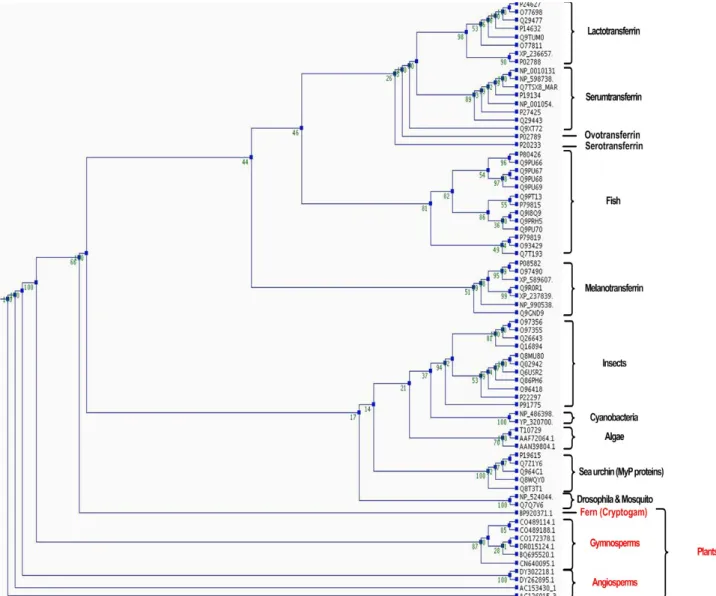
Figure 14: Phylogenetic tree of the first transferrin domain of proteins from Lambert et al. and transferrin proteins found in plants and cyanobacteria...39
Figure 15: SIFTER molecular function Gene Ontology annotation for the photolyase/blue-light photoreceptor family...53
Figure 16: SIFTER-X molecular function Gene Ontology annotation for the photolyase/blue-light photoreceptor family...54
Figure 17: SIFTER-X biological process Gene Ontology annotation for the photolyase/blue-light photoreceptor family...58
Figure 18: Sensitivity and Specificity of SIFTER, SIFTER-X, Blast hits and the best Blast hit for different cutoffs...64
Figure 19: ROC plot for different functional ontologies...66
Figure 20: Three layer structure in AFAWE...73
Figure 21: AFAWE application overview...74
Figure 22: AFAWE database table schema...76
Figure 23: Element Report of the tomato gene C12.5_contig9_11.1 in MIPSPlantsDB with a cross- reference to the corresponding analysis results in AFAWE...78
Figure 24: Three ways to get analysis results from AFAWE...81
Figure 25: SIFTER result for gene AC144389_35.2 from Medicago truncatula...82
Figure 26: Reconciled phylogenetic tree for gene AC144389_35.2 from Medicago truncatula, which is used as input for SIFTER...83
Figure 27: AFAWE analysis results of an EBI WU-Blast search against the SwissProt database and using the Molecular Function filter afterwards...84
Figure 28: AFAWE InterProScan result for Medicago gene AC144389_35.2...85
Figure 29: Manual annotation added to the Medicago gene AC144389_35.2...86
I. Introduction & Motivation
Since the first complete genomic sequence of an Eukaryote was published in 1996 [Goffeau et al.
1996], more and more sequence data is becoming publicly available and this data will increase in the next years, because next-sequencing technologies enable a fast and cheap sequencing of whole genomes [Hall 2007].
However, deciphering the DNA is just the first step in understanding the molecular machinery of an organism. Next steps include the detection and definition of gene structures and regulatory elements and their functional characterization. This information can afterwards be used to identify interactions between genes, to map genes to known regulatory and metabolic pathways or to search for candidate genes for further experiments.
The gene finding process in genome projects is done fully automatically by using bioinformatic algorithms which are trained for the considered organisms to increase the detection accuracy. In some projects the structural annotation is also checked and updated afterwards by a community to curate wrong predictions and to provide a useful dataset for further analyses [Thibaud-Nissen et al.
2007]. However, this is often not done in case of the functional characterization of genes. The automatic functional characterization of predicted genes in genome projects is often done by annotation transfer, which confers functional annotations to a query sequence from a putative homologous gene, which is already functionally characterized. Unfortunately this general method has many drawbacks and often leads to wrong functional assignments, which then are propagated through public databases [Galperin and Koonin 1998] [Gilks et al. 2002].
In this thesis different approaches for the automatic transfer of functions between genes are introduced, tested and discussed. To improve the automatic function transfer in genome projects an existing approach is extended, tested and integrated in a flexible workflow. The workflow is afterwards integrated into a system, which facilitates a fast comparison between results from different automatic functional annotation programs and enables scientists to add a manual functional annotation to each gene. These manual annotations will be used in the future to update the automatic functional annotation in genome projects.
The thesis is divided into nine chapters. This Chapter (Chapter I) gives a general introduction to the topic, whereas Chapter II explains the goals of the thesis. Background information about the thesis topic and the current status and limitations of approaches for automatic function prediction are introduced in Chapter III. Furthermore web services and web service workflows are explained, which enable the integration of additional functional information about genes. Web services are used by tools described in the thesis to increase the flexibility and scalability of tools and workflows. The manual process from the determination of the DNA sequence to the functional characterization of genes and the identification and comparison of syntenic regions including the identification of candidate genes for pathogen resistance in potato chromosome V is described in Chapter IV. Chapter V introduces an automatic pipeline used for the automatic functional annotation in the Medicago truncatula, Sorghum bicolor and Solanum lycopersium (tomato) genome projects, because a manual functional annotation would not be feasible for whole genomes. To further improve the automatic function annotation in these and other genome projects a phylogenomic tool SIFTER-X is described and tested in chapter VI. However, to verify the automatically annotated functions (no tool is 100% accurate) and to provide a more comprehensive view of the function of
each gene in a genome, a flexible system called AFAWE is introduced in chapter VII. AFAWE incorporates different analysis tools and enables users to add manual annotations to genes by providing an intuitive web interface and different filters to highlight trustworthy results.
Furthermore AFAWE is connected to the public sequence database MIPSPlantsDB. In Chapter VIII results from the different approaches are discussed and an outlook how the manual and automatic annotation could be further improved is given in Chapter IX.
II. Aim of the thesis
One goal of the project is the improvement of functional annotation in genome projects. That is, sensitivity should be increased while at the same time decreasing the false discovery rate.
Increasing the sensitivity means that more true functions are added to more genes. However, a low false discovery rate indicates that most assigned functions are true and only few are wrong.
Another goal of the project is to facilitate the manual functional annotation of unknown protein coding genes from arbitrary origins for every scientist. The user should be able to give as input an amino acid sequence and the corresponding organism name. Different analyses, which are selected by the user, are run and the results are shown in an intuitive and easily comparable way.
In the beginning of the project different analysis tools have been tested in collaborations with biologists of the Max-Planck Institute for Plant Breeding Research to find the best of them and to detect problems. To enable a fast access and an easy ex-changeability and scalability of the different programs, web services and web service workflows have been implemented and tested afterwards in the Medicago truncatula, Sorghum bicolor and Solanum lycopersicum genome projects. Because it was found that additional functional information (e.g. interaction partners, domain information) can further improve the automatic function prediction [Xiao and Pan 2005] [Hsing et al. 2008] [Zhao et al. 2008] [Mostafavi et al. 2008] one tool is extended by this kind of information and tested afterwards on a manually checked test set.
To achieve the second goal, all tested tools and workflows have been integrated in a system, which facilitates a fast comparison between the analysis results. The most trustworthy results of each analysis are highlighted by applying dynamic thresholds to the results, so that the user does not need any knowledge about the output score from the analysis and can concentrate on the comparison of the results. In this context a fast and easy integration of new tools or workflows into the system is required. Because of that all analysis tools are run as web services, because web services improve the scalability, accessibility, maintainability, efficiency and simplify the process.
Furthermore each user is able to add his/her own manual annotation to each gene. This manual annotation will be used afterwards to update the automatic functional annotation in genome projects.
III. Background
1) Automatic functional prediction
With the increasing amount of genomic data becoming available the need of tools for automatic function prediction and data integration will be the next big challenge in biological science.
Running experiments to find the function for a few genes takes month to years and therefore running experiments for all 20000 to 40000 genes of an organism is not feasible. In this case an automatic pipeline is needed. However the automatic function prediction of genes is not easy, although a huge amount of genes and their functions are conserved in all organisms. The challenge is to find out which of the genes share the same functions and which do not and which functions can be transferred from genes with known functions to genes with unknown functions. A search for homologous genes in sequence databases via Blast [Altschul et al. 1997] can lead to wrong predictions in cases such as duplication events, gene loss, domain shuffling or errors in databases [Gilks et al. 2002] [Galperin and Koonin1998]. If there is no high sequence identity between two genes, which share the same functions, the function prediction becomes very hard. In this case other functional information like expression patterns, interaction partners, structure prediction, search for protein domains or gene-neighborhood analysis can give clues to the true function of the gene. This information is also valuable for validation of orthologous1 relationships [Xiao and Pan 2005] [Hsing et al. 2008] [Zhao et al. 2008] [Mostafavi, et al. 2008]. If no sequence similarity to functionally characterized genes can be found other methods can be used instead like gene fusion (Rosetta stone method), phylogenetic profiling, amino acid composition or critical residues detection (for review see [Friedberg et al. 2007] and [Lee et al. 2007]). However, each of these approaches has limitations and by using only one of them the result is often restricted to a specific class of proteins [Karimpour-Fard et al. 2008].
In the last few years many hybrid tools have become available, which predict gene functions by using many different data sources together (e.g. MAGIC [Troyanskaya et al. 2003], ProKnow [Pal and Eisenberg 2005], STRING [von Mering et al. 2007]). Unfortunately in most cases the user is not able to see intermediate results and it is not shown whether the underlying databases are up-to- date.
A big bottleneck in the functional annotation is the missing standard for describing the function of a gene or protein. In contrast to sequence or structure information the functional annotation of a protein is written in a human readable fashion. This has many drawbacks like problems with synonyms or the missing relationships between descriptions. Furthermore the human readable description gives no clues how this function was assigned; for example, whether it has been experimentally verified or not or what kind of method was used to predict the function. Ontologies were introduced to solve this problem. However there is not one single comprehensive ontology for all gene classes, but many small and specific ontologies (for example the Enzyme Catalogue (EC) [Webb et al. 1992]) is only adapted for enzymes). To simplify the prediction, most tools deal with only one ontology. But it has been shown that by annotating different kinds of ontology terms to describe the function of a gene, it can be described in a more specific way [Thomas et al. 2007].
1 Genes are orthologous, if they were separated by a speciation event. In most cases they share the same function.
In this chapter a short overview about common ontologies used for function is given. Afterwards different approaches for function prediction are explained. Finally web services and web services workflows are introduced, which are used in this thesis for the integration of different data sources and tools.
a) Function description with ontologies
Often the function of a gene or protein is written in a human readable way. However, because the vocabulary is often invented and reinvented in science, many terms are synonymous [Friedberg 2006]. This makes it hard for humans and machines to interpret it. To make functional annotation accessible to machines, a controlled and well-defined vocabulary is necessary. In the following I will give an introduction to the most frequently used ontologies for function assignment.
Enzyme Commission Classification number (EC): [Webb et al. 1992] This hierarchically organized vocabulary was introduced in 1956 to classify enzymes by the chemical reactions they catalyze. Each enzyme is described by an EC number, which consists of four numbers, separated by dots. While the first three numbers describe the enzyme reaction, the fourth number is used for unique identification. In this process the first number denotes the functional class of the enzyme (Transferase, Hydrolase, etc.), the second and third describe the group of donors or acceptors, which are used by the enzyme.
Gene Ontology term (GO term): [Ashburner et al. 2000] The gene ontology project provides controlled vocabularies to describe genes and gene products in any organism. Three ontologies are publicly available to describe the function of a gene: Molecular function, Biological process and Cellular component. Gene Ontology terms are represented as a directed acyclic graph (DAG) and linked by the two relationships, is_a and part_of. These relationships enable an easier navigation through the ontology and a faster comparison between the terms. In addition it is possible to add evidence codes2 to the GO terms, which indicate the method, by which this function has been annotated.
KEGG Ontology term (KO term): [Kanehisa et al. 2004] This hierarchical scheme for orthologous genes was introduced by KEGG to overcome problems with EC numbers and to provide an ontology suited to map genes to regulatory and metabolic pathways. The KEGG ontology was automatically build and manually curated from ortholog clusters of the SSDB database [Sato et al. 2001].
MapMan bin: [Thimm et al. 2004] MapMan bins were developed by the Max-Planck Institute for Plant Physiology to provide a hierarchical system especially suited for plant metabolism. Genes are both mapped automatically and manually by analyzing expression arrays and gas chromatography (GC)/MS metabolite profiles. In addition to that, text search in research papers is used.
FunCat term: [Ruepp et al. 2004] This annotation scheme has a hierarchical, tree-like structure with up to six levels of increasing specificity and is suited for prokaryotes, unicellular eukaryotes, plants and animals. FunCat version 2.1 includes 1362 functional categories of which 28 belong to the main categories, that cover general fields like cellular transport, metabolism and cellular communication/signal transduction.
2 http://www.geneontology.org/GO.evidence.shtml
b) Homology based transfer
Homology-based transfer by database search
This approach uses sequence conservation to transfer the function of a functionally annotated gene to an unknown gene. The most common tool in this field is Blast [Altschul et al. 1997], which searches for homologous sequences in sequence databases. However this method has many drawbacks and makes systemic errors by not accounting for duplication events, evolutionary rate variation, and incorrect annotations. In spite of high sequence conservation the function of the genes can be different [Rost 2002] and gene loss and domain shuffling can lead to wrong annotations, because only part of the putative homologous gene matches to the query sequence very well, which resulted in a high score. These wrong annotations are propagated afterwards through sequence databases [Galperin and Koonin 1998] [Gilks et al. 2002]. Moreover sequence based tools are not in all cases sensitive enough to discover functionally related proteins in other organisms. If the sequence identity drops, as in distantly related organisms, it becomes harder for these tools to detect homologous relationships. In this case and for validation of putative hits it is necessary to check sequences for functionally significant subregions like active sites in enzymes.
Detection of protein domains
Protein domains are conserved parts of a protein structure and sequence, which constitute units of evolution and function. Because most domains are conserved between protein families, they can give clues to the overall function of the protein although no orthologous gene was found by a homology search.
Common methods for protein domain detection are [Durbin et al. 1998]:
Profile Hidden Markov Models (HMMs): Used by HMMER to search HMM databases like PFAM [Bateman et al. 2002]
Profile Specific Scoring Matrices (PSSMs): Included in the Conserved Domain Database (CDD), which can be searched by RPSBlast [Marchler-Bauer et al. 2007]
Regular expressions: Used by PROSITE [de Castro et al. 2006] [Hulo et al. 2006] to search any sequence database Methods like HMMs are very sensitive, because they allow insertions and deletions. But there is one HMM for each protein domain and each HMM has its own trusted cutoffs. A big bottleneck here is that the seed-alignment of sequences from which the HMM is constructed must be correct.
Sequences which do not belong to this domain can decrease the sensitivity and increase the false discovery rate. One of the disadvantages of HMMs is that they are very slow and so this step can be very time-consuming.
In contrast searching with PSSMs is much faster, but not as sensitive as an HMM search. Still, this method is more sensitive than a Blast search.
Regular expressions are used to search domains in sequence databases. Their disadvantages are, that they do not score amino acid frequencies in ambiguous positions and there is no score assigned.
To avoid problems with cutoffs (like in case of HMMs) one can also use so called umbrella databases and tools like InterPro and InterProScan [Mulder and Apweiler 2007], which include many different domain databases and apply tested cutoffs for each method. Each database is searched independently by its own tool. Afterwards all trusted cutoffs are applied and equivalent domains are connected by a unique InterPro identifier. By applying only the trusted cutoffs they
achieve a low false discovery rate, but can miss true hits with a lower score. Furthermore some domains are not present in InterPro yet.
The Phylogenomic approach
Phylogenomics considers the evolutionary history of genes to predict functions of uncharacterized genes. A phylogenetic tree is generated from a set of homologous sequences and ontology terms for functional description (see chapter IIIa) are assigned to its leaves (genes). The terms are then transferred within the tree to uncharacterized nodes (uncharacterized genes) by considering speciation and duplication events and branch lengths [Eisen JA et al. 1998].
Because phylogenomics takes the evolutionary history of genes into account, a change of function in a group of paralogous genes can be detected and wrong annotations can be avoided. However, if the number of ontology terms assigned to genes inside the tree is too sparse or the tree is inaccurate, also the phylogenomics approach can lead to wrong annotations.
One of the best performing tools in this area is SIFTER [Engelhardt et al. 2005], which uses a statistical inference algorithm to propagate molecular function Gene Ontology (GO) terms within a phylogenetic tree. Two inputs are required by SIFTER. A reconciled phylogenetic tree and a so- called PLI file, a XML file which includes the gene annotations. SIFTER only uses the lowest level annotated GO terms as candidate functions and is therefore able to assign very specific GO terms to genes. In addition to speciation/duplication events and the branch length between nodes in the tree, SIFTER also considers evidence codes assigned to GO terms. The user of SIFTER can decide which GO terms with which evidence codes should be considered.
For each gene in the tree an initial probability, which is based on the annotated evidence codes (see table 1), is added to each candidate GO term.
GO evidence code Description Initial probability
IEA Inferred from Electronic Annotation 0.2
IMP Inferred from Mutant Phenotype 0.8
IGI Inferred from Genetic Interaction 0.8
IPI Inferred from Physical Interaction 0.8
ISS Inferred from Sequence or Structural
Similarity 0.4
IDA Inferred from Direct Assay 0.9
IEP Inferred from Expression Pattern 0.4
TAS Traceable Author Statement 0.9
NAS Non-traceable Author Statement 0.3
RCA Inferred from Reviewed
Computational Analysis
0.4
ND No biological Data available 0.3
IC Inferred by Curator 0.4
Table 1: Initial probabilities given by SIFTER for the GO evidence codes.
The initial probability is then changed into a likelihood (see figure 1) and added to the corresponding node in the GO DAG. Afterwards the likelihood for each GO term is combined with a prior value and is down-propagated in the GO DAG to the candidate terms. At the end the likelihood at the candidate GO terms is extracted from the GO DAG and assigned to the gene.
In a second step SIFTER propagates the candidate GO terms to the root of the phylogenetic tree and afterwards back to the leaves of the tree by considering an internally calculated mutation rate. This mutation rate is based on the type of the node (speciation or duplication node) and on the branch length between nodes. The lower the mutation rate is, the more likely it is to transfer functions between nodes. If the node is a duplication node, the mutation rate is increased, because it is assumed that, after a duplication event occurs, the function of one or both genes is modified. The propagation step is based on the approach of Felsenstein et al. [Felsenstein 1981] and is described in [Engelhardt et al. 2006].
c) Chromosomal proximity
Mainly in Prokaryota, but also in other organisms, functionally related genes (e.g. genes working in the same complex [Teichmann and Veitia 2004] or in operons [Blumenthal 2004] [Salgado et al.
2000]) are often placed at the same location on a chromosome. Additionally the gene order is often conserved between related species [Teichmann and Babu 2002]. By comparing these so called
“syntenic regions” or shared synteny3 of related species or individuals, functionally related genes can be identified and functional coherences between genes like physical interactions or activity in the same pathway can be predicted [Poyatos and Hurst 2007] [Enault et al. 2005] [Kolesov et al.
2001].
d) The Rosetta Stone method
The Rosetta stone approach relies on the assumption that in some organisms genes are fused together which in other organism are separate (e.g. α and β subunits of the Trp synthetase in bacteria are fused in fungi [Burns et al. 1990]). By detecting fused genes co-regulation and interaction can
3 Shared synteny is defined as the conserved co-localization of genes on chromosomes of related species Figure 1: Setting of the initial likelihood for each candidate GO term to each gene in the phylogenetic tree by SIFTER.
be predicted and functions can be transferred [Date 2008].
e) Phylogenetic profiles
The idea of that approach is that functionally related genes should be co-inherited, because if one gene is lost during evolution the overall function is different due to the lack of the interaction partner. Algorithms in this area cluster profiles of the presence or absence of an orthologous group in a set of species (for review see [Harrington et al. 2008] and [Lee et al. 2007]). However, because the detection of orthologous genes is a crucial step in this analysis and is non-trivial in Eukaryotes, methods in this area are more accurate for prokaryotic genes [Lee et al. 2007].
f) Structural information
In case of low sequence similarity to known genes structural information about the protein can give new insights to the function of the protein of interest, because structure is better conserved than sequence [Brenner et al. 1996] [Rost 1997]. On the one hand that can be done by looking for similar structures of already functionally characterized proteins available in databases like PDB [Kirchmair et al. 2008] and PDBj [Standley et al. 2008] using structure alignment programs (reviewed in [Friedberg et al. 2006]). On the other hand functional critical residues or functionally relevant 3D templates can be identified by looking at the protein stability [Capriotti et al. 2008], the location of the residue in the structure [Kinoshita et al. 2002] [Ng and Henikoff 2006] and the conservation of structural motifs between known proteins [Pazos and Sternberg 2004]. Furthermore structural binding sites can be predicted [Glaser et al. 2006] [Kinoshita et al. 2002] [Ivanisenko et al. 2004]
[Golovin and Henrick 2008] [Wei et al. 2007]. For comparison to known binding sites and catalytic sites several public databases are available like the Catalytic Site Atlas (CSA) [Porter et al. 2004]
and SCOPEC, a database for catalytic domains [George et al. 2004].
If the 3D structure of the protein is not known the prediction by ab initio programs (for a review and testing of the programs see [Jauch et al. 2007]) can be used as a substitute, or the 2D structure can be used instead.
g) Expression data
Microarray experiments enable the investigation of the expression behavior of many genes together in one experiment. The most common method to predict information about the function of genes from expression data is the clustering of genes based on their expression profile. Information about the function of a known gene in the cluster is then transferred to other genes in the cluster. The hypothesis behind this approach is that genes which are working in the same cellular pathway or interact in some way are required at the same time and are expressed in unison [Boutros and Okey 2005]. Furthermore co-expressed genes can be regulated via one or a few common mechanisms [Boutros and Okey 2005] and by the identification and investigation of gene clusters, hypotheses can be generated about the underlying regulatory mechanism. Of course these hypotheses have to be proven in the lab e.g. by knockdown or knockout experiments.
Many different clustering algorithms exist [Emmert-Streib and Dehmer 2008] [Khatri and Draghici 2005] [Hand and Heard 2005] and all of them have their strengths and weaknesses [Kerr et al.
2008]. To choose an appropriate tool for the clustering process some tools need background knowledge about the underlying data e.g. how many clusters are expected or what is the structure of the cluster [Hand and Heard 2005]. A bottleneck of all algorithms is also the decision on which
variables (features) the clustering should be done. If one does not take the right variables, wrong predictions can occur. However, with knowing the data the decision which algorithm to use is biased and therefore the result may not be universally valid. Algorithms like k-means which require the pre-specification of a relatively small number of cluster deal poorly with genes that have no close neighbors in feature space and therefore should ideally form singleton clusters. In this case pattern discovery methods can help, which detect groups of genes which have similar profiles and do not consider the profile shapes of other genes [Hand and Heard 2005].
Besides these problems, there are many other sources of error by investigating expression data like non-complementary binding, varying values because of changed lab conditions, and missing values (e.g. Gene Ontology terms, expression data points). Furthermore, comparing expression data from different Microarrays can also lead to wrong assumptions [Jarvinen et al. 2004] if lab conditions [Irizarry et al. 2005] and the underlying technologies used (e.g. which chip and which normalization is used) are different and the circadian clock had not been considered etc.
Clustering algorithms and pattern discovery methods are mainly useful to predict the biological process of the gene of interest, but should be used with precaution to predict the molecular function of genes. In all cases it is important to look manually at the results afterwards and verify them by running further experiments in the lab.
2) Web services
a) Introduction data integration
Data integration is the cross-association of diverse data organized and presented with a certain purpose. In the current time the amount of biological data increases rapidly and one can find information distributed in several databases. The number of resources that are made available over the web is growing. This creates a need for systems which are able to find the data and to process them in the way that they are not only available at one place, but also combined and collated. There is already a long history of data integration. One of the common examples is the so called data warehouse, in which one extracts data from several data sources and loads them into one database, which then can be queried. But there are some drawbacks about data warehouses, for instance, one needs the space and the compute power to host and integrate all collected data and has to ensure that the data warehouse is always up-to-date.
Another method to face these issues are web services. Web services are software systems that enable the interoperability between two machines in a common network and offer the possibility to compute and/or retrieve data from a distant computer in a machine processable way. Institutes which already provide their data can offer web services to propagate them, so that one does not need to implement a data warehouse. This also means, that it is most important to encourage institutes to make their data publicly available via web services.
b) The BioMOBY project
In 2001 the BioMoby project [The BioMOBY Consortium 2008] was initiated, which also addresses the issues of finding web services and shared data schemata. BioMoby offers a central repository, at which service providers can register their web services and users can find those.
Additionally standardized data schemata are offered, which define semantically the input and the output of a service. Normally, a biological web service, which defines a string as input does not give any hint on what kind of string is needed (it can be a protein sequence, a database identifier or a
publication abstract). In the BioMoby world a service would be defined for example, as a service which uses a database identifier as input and returns the protein sequence in FASTA format.
3) Web service workflows and reusement of workflows
a) The Taverna project
Taverna [Oinn et al. 2004] is an open source software tool developed by the myGrid team in Manchester for designing and executing workflows. Workflows can be a line-up of web services (see chapter III2) or local tools. Because each component in the workflow is independent, workflows are very flexible.
The common way to execute and develop workflows in Taverna is the use of the standalone application. But workflows can also be executed without using the graphical user interface by interacting with the Taverna application programming interface (API).
b) MyExperiment
To provide an intuitive web interface to find, use and share Taverna workflows the MyExperiment website [Goble and De Roure 2007] was developed by the MyGrid team. Besides uploading, finding, updating and sharing workflows the user of MyExperiment is able to establish new groups and build new scientific communities. Furthermore workflows can be directly loaded, modified and executed in Taverna (reusement of workflows).
IV. Manual annotation and comparison of shared syntenic regions in a hot spot for pathogen resistance in Solanum tuberosum, Solanum demissum and Arabidopsis thaliana to discover new QTLs.
1) Introduction and aims of the project
Solanum tuberosum (cultivated potato) is one of the most important crops of the Solanaceae family.
In comparison to the hexaploid wild potato (Solanum demissum) the cultivated potato is tetraploid.
Both species are non-inbred, annual plants with a genome size between 800 and 1000 megabases and twelve chromosomes. However, cultivated potato genotypes are heterozygous at all ploidy levels, because if the ploidy level is reduced from 4n to 2n the plants become incompatible [Gebhardt et al. 2004]. The whole genome of potato plants is not sequenced yet, but sequencing of both potato and their closest relative tomato (Solanum lycopersium) is in progress (see chapter V3).
Because of their agronomic relevance, hot spots for pathogen resistance were identified by comparing RFLP (restriction fragment length polymorphism) linkage maps of the twelve chromosomes [Bonierbale et al. 1988] [Gebhardt et al 1989] [Gebhardt and Valkonen 2001]. One of the identified hot spots is located on potato chromosome V in the region between DNA-based markers GP21 and GP179 [Meksem et al. 2000]. In this region resistance genes and QRLs (quantitative resistance loci) are located for resistance to Potato Virus X [De Jong et al. 1997], Phytophthera infestans [Leonards-Schippers et al. 1992], G. rostochiensis and G. pallida [Kreike et al. 1994]. However, only two of them, Rx2 for extreme resistance to Potato Virus X [Bendahmane et al. 2000] and R1 for resistance to Phytophthera infestans [Ballvora et al. 2002] are functionally characterized. These two genes belong to the superfamily of plant resistance genes, which contain a coiled coil (CC) domain, a nucleotide binding domain and a leucine rich repeat (LRR) domain. The overall sequence identity of genes in this family is not very high. R1 has been introgressed from the wild potato into the cultured potato germ plasm pool.
The aim of this project was to find genes in this hotspot, which can be further examined for function as quantitative trait loci (QTLs), first in silico by functional annotation and then experimentally. In doing this the corresponding region in both haplotypes (~200kbp and ~400kbp) of Solanum tuberosum genotype P6/210 was sequenced, manually annotated and genes were functionally characterized. Furthermore syntenic regions in the wild potato Solanum demissum [Kuang et al.
2005] and in Arabidopsis thaliana were identified and compared.
2) Materials and Methods
a) Sequencing, assembly and gene prediction
BAC clones were sequenced by a company using the shotgun sequencing strategy. The assembly was done first in a company using PreGAP4 and GAP4 from the Staden software package [Krawetz et al. 2003]. After identifying and removing the remaining vector sequences the Megamerger program from the EMBOSS package (Version: 6.0.1) [Rice et al. 2000] was used to merge sequences of overlapping BAC insertions. The assembled contigs were afterwards submitted to the EMBL database [Kulikova et al. 2004] (EMBL accession numbers: R1: EF514212; r1: EF514213)
Different gene prediction tools (GenMark.hmm [Lukashin et al. 1998], FgeneSH [Salamov et al.
2000] and GenomeThreader [Gremme et al. 2005] were run by Remy Bruggmann at the MIPS institute in Munich. Afterwards the APOLLO Genome Annotation Curation Tool (Version: 1.6.4) [Misra et al. 2006] was used to provide a manually annotation for all genes based on the automatic gene prediction of the different tools. Therefore the predicted exons and open reading frames (ORFs) from the gene prediction programs were combined with homologous genes and ESTs found in public databases. The trace files, provided by the company, were manually checked for sequencing errors by using Consed [Gordon et al. 1998], if a putative pseudo gene was discovered.
Further details about materials and methods used for the sequencing and the initial assembly can be retrieved from [Ballvora et al. 2007].
b) Manual functional annotation
Functional annotation was done manually combining homologous genes in the SwissProt database (Release 51) with protein domains and patterns found in the InterPro database (Release 13). For the homolog detection BlastP (Version: 2.2.13) [Altschul et al. 1997] was used. To discover evolutionary relationships inside the disease resistance superfamily a phylogenetic tree from all sequences was build using protpars from the Phylip package [Felsenstein 1993].
c) Shared micro-synteny with the Arabidopsis thaliana and the Solanum demissum genome
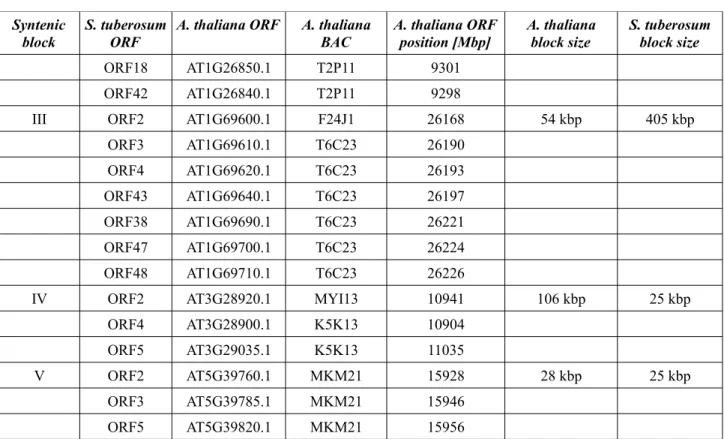
Dotter (Version:3.1) and MUMer (Version: 3.18) [Delcher et al. 2002] were used to align and compare the shared syntenic region from different haplotypes of S. tuberosum and S. demissum. The corresponding BACs in S. demissum had been taken from [Kuang et al. 2005]. For the identification of syntenic genes in A. thaliana Inparanoid (Version: 1.35) [O'Brien et al. 2005] in combination with BlastX (Version: 2.2.13) [Altschul et al. 1997] against the TAIR6 database [Weems et al. 2004]
were used. We defined shared syntenic blocks by the criterion, that at least three orthologous genes are identified within a roughly comparable physical distance on the chromosome. Because of their limited information value transposons and resistance genes were excluded from the comparison.
3) Results
The assembly of 743,152 kbp of genomic sequence from seven R1 and three r1 BAC insertions results two distinguished and unambiguous DNA contigs with a length of 417,445 kbp and 202,781 kbp of R1 and r1.
R1 and r1 share a high conserved region (see region B and E in figure 2), which is interrupted and extended by two hyper variable regions, which were non-alignable (see region C,D and F in figure2). All identified resistance genes in R1 (8 genes) and r1 (4 genes) are located in this hyper variable region. One of them in R1 (gene between 20 and 21 (see figure 3)) and one gene in r1 (gene 49 (see figure 3)) seem to be incomplete (putative pseudo genes), because they were disrupted by transposons. The first gene of R1 (gene 1 in figure 3) could also not be well annotated, because there have not been more sequences available at this side of the R1 contig and the corresponding region (region A in figure 2) was not obtained from r1. Region B (see figure 2) shows a palindromic structure, which corresponds to an inverted repeat of two RNA-directed RNA polymerases, which were separated by hypothetical protein and a retro-transposon. In R1 four and in r1 one of these hypothetical proteins could be identified, but no expression data was available to confirm their transcription. However all hypothetical proteins seem to belong to the same protein family. Blast and profile searches only returned hits to potato proteins, which support the idea that it is an unknown potato specific protein family. We could also identify a genomic inversion in region E (see figure 2), which is highly conserved (sequence identity: 99%) and contains 5 genes (gene 43–
38 in figure 3).
Figure 2: Comparison of the haplotypes R1 with r1 of Solanum tuberosum. The figure was taken from Ballvora et al.
2007.
Figure 3: Comparison between R1 and r1 from S. tuberosum and haplotypes A, B and C from S.
demissum. The figure was taken from Ballvora at al. 2007.