A Measurement of the Photon Detection Efficiency of Silicon Photomultipliers
A. N. Ottea,∗, J. Hosea, R. Mirzoyana, A. Romaszkiewicza, M. Teshimaa, A. Theaa,b
aMax Planck Institute for Physics, F¨ohringer Ring 6, 80805 Munich, Germany
bUniversity of Genova and INFN, Via Dodecaneso 33, I-16146 Genova, Italy
Abstract
We describe a new method to determine the photon detection efficiency of silicon photomultipliers. This method can also be applied to other photon detectors with single photoelectron resolution.
Key words: silicon photomultiplier (SiPM), avalanche photo diode (APD).
1 Introduction
The silicon photomultiplier (SiPM) is a novel photon detector concept based on avalanche photo diodes operating in Geiger mode. This concept is developed by several groups (e.g. [1], [2], [3], [4]). In many applications of SiPMs one needs to know the absolute number of photons which were incident on the SiPM. Thus an absolute calibration of the SiPM is necessary. The overall conversion factor from photons to the number of detectable photoelectrons is called photon detection efficiency (PDE). In the vacuum photomultiplier user community this is called the effective quantum efficiency. In order to determine the PDE of SiPMs one should avoid commonly used methods in which a calibrated, monochromatic DC light source is compared with the sensor signal. The reason are intrinsic features of the SiPM like rate effects, recovery time and optical crosstalk. We have developed a new method to determine the PDE which is independent of those features and which will be reported here.
∗ Corresponding author
Email address: otte@mppmu.mpg.de (A. N. Otte).
2 The Silicon Photomultiplier
A SiPM is a matrix of small avalanche photo diode cells operating in the limited Geiger mode i.e. a few Volt above breakdown (hereafter called Geiger cells). The Geiger cells are connected in parallel via integrated resistors to a common load. The integrated polysilicon resistors act as quenchers in case of an avalanche breakdown triggered by a photoelectron in a cell. The output signal of a cell is independent of the number of electrons which have initi- ated the Geiger breakdown. Due to the parallel connection of all cells the output signal of the SiPM is the sum signal of all cells which underwent a Geiger breakdown. After a cell breakdown a characteristic time is needed for the recovery to its original state1, as the diode capacitance as well as para- sitic capacitances have to be recharged to the bias voltage. Therefore, SiPMs can only be used in environments in which the average count rate per cell is much less than the inverse of the recovery time. For example in applications in which SiPMs are used to read out e.g. scintillators, one obtains an output signal directly proportional to the number of photons, if the number of pho- toelectrons is much less than the number of cells of the SiPM. Otherwise, the SiPM signal will become highly non linear because of saturation. Similarly, high rate operation or DC measurements can become problematic.
Optical crosstalk is another feature of SiPMs which has to be taken into ac- count when measuring the photon detection efficiency. The origin of optical crosstalk the photon generation by the electrons in the avalanche [6]. These photons can generate photoelectrons in neighboring cells, thus triggering them basically at the same time, i.e. within 100 psec. The optical crosstalk can some- times be quite high, exceeding sometimes 10% if the gain of the SiPM is high.
3 Measurement Principle
When measuring a signal different from zero from a SiPM and correlating it with the incoming photons one cannot directly infer to the number of photo- electrons. The reason is the optical crosstalk phenomenon by which additional cells can fire. Disentangling of the optical crosstalk contribution from the sig- nal is rather difficult and if not done correctly it apparently results in a too high PDE. In order to solve the problem we illuminated the SiPM with short low intensity light flashes (∼10 nsec) and count the number of events (N(0)) in which no photoelectron has been detected by the SiPM . As we also know the total number of flashes Ntotal, we can calculate the mean number (µ) of
1 The recovery time in this application is not the usual 1-1/e but ≥ 90% of the initial amplitude
SiPm
Pin Diode Spectralon
Cylinder
Alu Cylinder
AluCylinder 50 mm
Endcap
Endcap
(a) Schematics (b) Picture
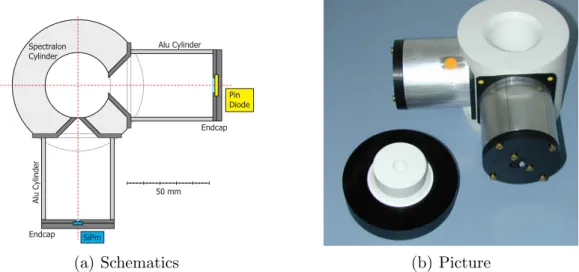
Figure 1. Left side: Horizontal cut through the mechanical setup we used for our PDE measurement. Right side: Photograph of the mechanical setup with the opened cap through which the pulsed LED is emitting light into the sphere. The setup guarantees a fixed light splitting ratio between the reference detector (PiN diode) and the detector under investigation.
detected photoelectrons (µ) detected per flash if we assume a Poisson distri- bution for the number of detected photoelectrons per light pulse
P(0) = e−µ= N(0)
Ntotal (1)
⇒ µ=−ln N(0)
Ntotal (2)
whereP(0) is the probability of no photoelectron being detected if the SiPM is flashed by the light source. In this way the determination of the mean number of photoelectrons is reduced to a counting experiment that is only dependent on how well one can separate a signal from the background.
If, in a second measurement the mean number of incident photons can be determined separately one can determine the PDE. We have built an apparatus that allows us to do so. For each light flash a PiN diode is illuminated in parallel to the SiPM in this apparatus. From the PiN diode signal we can calculate the mean number of photons (Nphotons) at the position of the SiPM as will be explained later and finally obtain the PDE:
PDE = µ
Nphotons
(3)
4 Measurement Procedure
In the following we will describe in more detail our setup, its calibration and the measurement procedure. Our setup consists of a small integrating sphere, which is actually approximated by a cylinder closed with two caps made from sintered Teflon powder, a diffuse high reflectivity material [5] (c.f. Fig. 1).
The cylinder wall is 25 mm thick, and the inner diameter of the cylinder is 40 mm. The cylinder has two orthogonal viewing ports of 2 mm and 10 mm diameter, respectively. In one of the caps a LED of prechosen color illuminated the sphere though a small inlet port. Behind each exit port a small aluminium cylinder with precision diaphragm at a well defined distance is mounted. The diaphragms have a diameter of 0.8 mm and 8 mm respectively. This geometry was chosen to guarantee a highly uniform and parallel light beam. In order to avoid any stray light from the aluminum walls we covered all surfaces by black fleece. Behind the larger diaphragm we normally place a calibrated PiN photodiode2 to measure the light flux of the pulsed light source. The unit to be tested will be installed behind the 0.8 mm diaphragm. From Monte Carlo simulation we have concluded that a photon is, on average 100 times diffusely reflected within the integrating sphere before it gets absorbed or exists through one of the viewing ports.
Two more calibrations have to be carried out: (1) determination of the ex- act partition ratio of the light intensity behind both diaphragms and (2) the calibration of the measured PiN diode signal pulse in terms of photoelectrons.
(1) It is not sufficient to calculate the intensity ratios through the small and the large diaphragm because of small unknown effects. Therefore we measured the ratio directly by a LED constantly emitting light into the cylinder. At each diaphragm we placed a PiN diode and measured the photocurrents with a picoampere meter. We then exchanged the PiN diodes and measured the currents again. The ratio of the currents (after pedestal substraction) obtained with one diode at the two positions is the intensity ratio. The procedure was repeated e.g. with LEDs of different colors and intensities. Within 2% all trials yielded the same result of an intensity ratio of 3660.
(2) For the absolute calibration of the PiN diode signal we irradiated the PiN diode by 59keV–γ’s from an Am241–source and recorded the spectrum. A fully absorbed 59keV–γ generates in the depleted layer of the PiN diode
2 As a gain 1 device the photodiode is a perfect device to measure the light pulse intensity even in the pulsed mode. The only requirement is that the light pulse must be significantly larger than the noise of the readout system.
on average [7]
59000 eV
3.62e-h-pairseV = 16300 electrons. (4)
In this way we converted the PiN diode signal generated by the light flashes into the number of photoelectrons. In combination with the quan- tum efficiency of the PiN diode and the intensity ratio one can calculate the average number of photons passing the small diaphragm.
Before the PDE measurement we placed the SiPM under investigation behind the diaphragm with the smaller (0,8 mm diameter) hole and by means of a microscope made sure that the hole was completely covered by the active area of the SiPM. The SiPM signal was amplified by a broadband 500 MHz voltage amplifier MAN–1LN from Mini–Circuits. A monochromatic LED in pulsed mode3 (full width of a light flash was < 4 nsec) was then flashing into the spectralon cylinder. For each light pulse the signal of the PiN diode4 (located behind the diaphragm with the larger hole) was amplified with a charge sensitive amplifier (Canberra BT2003) and a spectroscopy amplifier (Canberra 2020 shaping time 3µs).
To determine the mean number of photoelectrons per flash detected by the SiPM we recorded in parallel to the PiN diode signal the possible signal in the SiPM within 140 nsec after the LED trigger. Afterwards we calculated with the above described method (s. Eqn. 2 the mean number of photoelectrons detected by the SiPM, and subtracted the dark count rate which had been obtained in the same way, but with the LED turned off.
Finally we obtained by applying Formula 3 the PDE by dividing the mean number of photoelectrons detected by the SiPM and the average number of photons at the SiPM position that resulted from the PiN diode signal.
5 Results
We have verified our method by measuring the PDE of a Hybrid Photo De- tector (HPD) R9792U-40 from Hamamatsu which is currently under study for being used in the MAGIC II experiment [8]. Due to the capability of HPDs to resolve single photoelectrons, our method can be applied without any modi- fication. As the gain of HPDs is < 105 and the single photoelectron signal is very fast (∼ 2 nsec), we reduced the gate of the SiPM signal search window from 140 nsec to 60 nsec for a sufficient signal to noise ratio. We measured
3 The emission spectra of the LEDs in pulsed mode have been verified with a spectrograph and match within 5 nm the specifications given by the manufacturers.
4 Hamamatsu APD S3590-08
Table 1
Measurement of a HPD Typ R9792U-40 by Hamamatsu. PDE (this meas.) is the result of our measurement, QE (in house) is the result of a ”conventional” QE mea- surement performed at our institute andQE (Hamamatsu) the values from the HPD ticket
λ[nm] PDE (this meas.) QE (in house) QE (Hamamatsu)
395 24±1 30.1 28.7
590 27±1 32.1 31.5
610 23±1 28.2 27.0
the PDE at three different wavelengths and compared them in Table 1 with the values from a standard quantum efficiency setup in our institute and the values given by Hamamatsu. Our results are systematically about 15% below those measured by Hamamatsu and the standard QE setup in our group. Most likely this mismatch can be attributed to the backscattering of photoelectrons from the APD of the HPD in our measurement. Nevertheless, this issue is still under investigation and has to be verified.
[nm]
λ Wavelength
400 450 500 550 600 650
Photon Detection efficiency [%] 0.5 1 1.5 2 2.5 3 3.5
λ Silicon Photomultiplier PDE vs.
[nm]
λ Wavelength
400 450 500 550 600 650
Photon Detection efficiency [%] 0.5 1 1.5 2 2.5 3 3.5
Figure 2. Photon detection efficiency of a SiPM vs. wavelength. The SiPM used here has 1024 cells on one square millimeter sensor area with a geometrical efficiency of about 10 %.
We tested prototype SiPMs with 1024 Geiger cells per mm2 and a geometrical efficiency of about 10%. The measurement has been done at room temperature and the result is shown in Figure 2. As expected from the structure of these devices (n–on–p structure), the maximum efficiency is in the red wavelength region and decreasing towards blue wavelengths.
6 Summary
We have presented a new method to measure the photon detection efficiency of SiPMs that is independent on intrinsic SiPM features. The method can also be applied to other photon detectors which show single photoelectron resolution
like e.g. HPDs or classical photomultiplier tubes (PMTs) with a high gain first dynode. For PMTs this is especially interesting as the photoelectron collection efficiency onto the first dynode is difficult to measure. The systematic offset we have observed for a HPD when comparing our results with those obtained with different setups is still a subject of investigation.
Acknowledgements
We would like to thank L. Weiss for his excellent work making the integrating sphere and the mechanics and M. Hayashida for providing us with a calibrated HPD. We are grateful for various helpful discussions with E. Lorenz.
References
[1] Golovin V. et al.,NIM A 518 (2004) p. 560–564 [2] Dolgoshein B. et al.,NIM A 504(2003) p. 48–52 [3] Bisello D. et al.,NIM A 367(1995) pp. 212
[4] Buzhan P., et al.,ICFA(Fall 2001), http://www.slac.stanford.edu/pubs/icfa/
[5] Pichler B., et al., NIM A 442(2000) p. 333–336
[6] Lacaita A. et al.,IEEE TED Vol 40 No. 3 (1993) p. 577–582 [7] Knoll G., John Wiley & Sons(2001) p. 395
[8] Hayashida M. et a.,Proceeding Beaune(2005)