ATLAS-CONF-2013-063 18July2013
ATLAS NOTE
ATLAS-CONF-2013-063
July 9, 2013
Search for single top-quark production via FCNC in strong interactions in
√ s = 8 TeV ATLAS data
The ATLAS Collaboration
Abstract
A search for single top production via flavour changing neutral current processes from initial states of gluon plus light quark in proton proton collisions at the LHC is presented.
Data collected with the ATLAS detector in 2012 at a centre-of-mass energy of
√s =
8 TeV and corresponding to an integrated luminosity of
Lint =14.2 fb
−1are used. Candidate events for top quarks decaying into leptons and jets are selected and classified into signal- and background-like candidates using a neural network. As no signal is observed, an upper limit on the production cross-sections multiplied by the
t → Wbbranching fraction is set.
The observed 95% CL limit is
σqg→t × B(t
→ Wb) <2.5 pb which can be converted into upper limits on the coupling constants of the FCNC interactions
κugt/Λ<5.1
·10
−3TeV
−1and
κcgt/Λ<1.1
·10
−2TeV
−1and on the branching fractions
B(t →ug) <3.1
·10
−5and
B(t
→cg)<1.6
·10
−4.
c
Copyright 2013 CERN for the benefit of the ATLAS Collaboration.
Reproduction of this article or parts of it is allowed as specified in the CC-BY-3.0 license.
1 Introduction
The top quark is the heaviest elementary particle known, with a mass of m
top =173.2
±0.9 GeV [1] close to the electroweak symmetry breaking scale. This makes it an excellent object to test the Standard Model (SM) of particle physics.
The dominant process for single top-quark production at LHC is the t-channel exchange of a virtual W boson. This mode has been measured by ATLAS and CMS [2–5]. The two sub-leading processes are Wt production, measured for the first time at the LHC with
√s
=7 TeV [6, 7], and the s-channel production.
As a consequence of the large value, close to one, of the V
tb-element in the Cabibbo-Kobayashi- Maskawa (CKM) unitary matrix, the predominant decay channel of top quarks is t
→Wb. Transitions between top quarks and other quark flavours mediated by neutral gauge bosons, so-called Flavour Chang- ing Neutral Currents (FCNC), are forbidden at tree level and highly suppressed at higher orders in the SM [8]. However, there exist several extensions to the SM which significantly enhance the rates and hence the branching fractions of FCNC processes. These extensions include new exotic quarks [9], new scalars [10,11], supersymmetry [12–15], or technicolour [16] (for a review see Ref. [17] and [18]). If the new particles are heavy, which is consistent with the non-observation of new low-mass particles at the Tevatron and the LHC, their e
ffects on FCNCs involving top quarks can be parametrised in terms of a set of dimension-six gauge-invariant operators [19]. The predicted branching fractions
Bfor top quarks decaying to a quark and a photon, Z boson, or gluon can be as large as 10
−5to 10
−3[17, 18] for certain regions of the parameter space in the models mentioned.
Among FCNC top-quark decays of the form t
→qV with V
=Z, γ, g, modes involving a Z boson or photon are usually studied directly by searching for final states with the corresponding decay particles.
However, the t
→qg mode, where q denotes either an up quark u or a charm quark c, is nearly in- distinguishable from the overwhelming background of multijet production via quantum chromodynamic (QCD) processes. For the t
→qg mode a much better sensitivity can be achieved by searching for anomalous single top-quark production (qg
→t) where a u or c quark and a gluon
goriginating from the colliding protons interact to produce a single top quark. The most general e
ffective Lagrangian
Lefffor this process resulting from dimension-six operators contains only tensor couplings [20] and can be written as [21]:
Leff =gs
X
q=u,c
κqgt
Λ
t ¯
σµνT
a( f
qLP
L+f
qRP
R) q G
aµν+h.c., (1)
where the
κugt,
κcgtare dimensionless parameters that relate the strength of the new coupling to the
strong coupling constant
gs.
Λis the new physics scale. T
aare the Gell-Mann matrices and f
qL,Rare
chiral parameters normalised such that:
|f
qL|2+|f
qR|2 =1, while P
L,Rare the left-handed and right-hand
projection operators. G
aµνis the gauge-field tensor of the gluon and ¯ t and q are the fermion fields of the
top antiquark and light quark, respectively. This Lagrangian contributes to both production and decay
of top quarks. In the allowed region of parameter space for
κqgt/Λ, the FCNC production cross-sectionfor single top quarks is of the order of picobarns, while the branching fraction for FCNC decays is very
small, and top quarks are therefore reconstructed in the SM decay mode t
→Wb. The W boson can decay
into quark-antiquark pairs (W
→q
1q ¯
2) or a lepton-neutrino pair (W
→`ν): only the latter is used here.¯
Thus the complete process searched for is qg
→t
→W(→
`ν)¯ b. Events are characterised by an isolated
high-energy lepton (electron or muon), missing transverse momentum from the neutrino and exactly one
jet, produced by the hadronisation of the b quark. Events with a W boson decaying into a
τlepton, where
the
τdecays into an electron or a muon, are also included. Several SM processes have the same final state
topology and are considered as background to the FCNC analysis. The main backgrounds are W/Z
+jets
production, especially in association with heavy quarks, SM top-quark production, diboson production,
and multijet-production via QCD processes.
The qg
→t
→b`ν process is characterised by three main differences from SM processes. First, the top quark is produced singly with transverse momentum arising only from initial state QCD radiation.
Therefore the resulting W and b quark from the top-quark decay tend to be produced back to back in azimuth in contrast to the main standard model processes. Secondly, compared to the W/Z
+jet anddiboson backgrounds, the W boson from the top-quark decay has a higher momentum and its decay products have smaller opening angles. Lastly, the production ratio between top quarks and top antiquarks differs between FCNC processes and SM processes. The FCNC processes are predicted to produce more than three times more top quarks than top anti-quarks, whereas in SM single top-quark production and all other SM backgrounds this ratio is at most two [22].
Experimental limits on the branching fractions of the FCNC top quark decay channels were estab- lished by experiments at the LEP, HERA, Tevatron and LHC accelerators. At present the most stringent upper limits at 95% CL for the coupling constants
κtqγand
κqgtare
κtqγ/mtop <0.12 GeV
−1[23] (ZEUS, HERA) and
B(t→qg)
<5.7
×10
−5(ugt) and
B(t→qg)
<2.7
×10
−4(cgt) [24] (ATLAS, LHC). In the case of t
→qZ only upper limits on the branching fractions of the top-quark decay have been determined to be
B(t→qZ)
<0.07% [25] (CMS, LHC).
This note is organised as follows: Section 2 provides a description of the ATLAS detector and an overview of the data and Monte Carlo (MC) samples used for the simulation of signal and expected background events from SM processes. In Section 3 the event selection is presented. The methods of event classification into signal- and background-like events using a neural network are discussed in Section 4 and sources of systematic uncertainties summarised in Section 5. The observed and expected upper limits on the total cross section, the coupling constants and branching fractions of the investigated FCNC processes are given in Section 6.
2 The ATLAS detector and simulated event samples
The ATLAS detector [26] is composed of an inner tracking system close to the interaction point, sur- rounded by a superconducting solenoid providing a 2 T axial magnetic field, electromagnetic and hadronic calorimeters, and a muon spectrometer
1. The electromagnetic calorimeter is a lead liquid-argon sam- pling calorimeter (LAr) with high granularity. An iron-scintillator tile calorimeter provides hadronic energy measurements in the central pseudorapidity range. The endcap and forward regions are instru- mented with LAr calorimeters for both electromagnetic and hadronic energy measurements. The muon spectrometer consists of three large superconducting toroids, a system of trigger chambers, and precision tracking chambers.
This analysis is performed using
√s
=8 TeV pp-collision data recorded by ATLAS between April 4th and October 24th, 2012. Only the periods in which all the sub-detectors were operational are considered, resulting in a data sample with a total integrated luminosity of 14.2 fb
−1.
Detector and trigger simulations are performed with the standard simulation of ATLAS within the GEANT4 framework [27, 28]. The same offline reconstruction methods used with data events are ap- plied to the simulated samples. Minimum bias events generated by PYTHIA8 [29] are used to simulate multiple pp interactions in the same and nearby bunch crossings, corresponding to the LHC operation with 50 ns bunch separation and an average of 18 additional pp interactions per bunch crossing.
For the direct production of top quarks via FCNC, ME
top[30], a new generator for simulating strong FCNC processes at the NLO approximation is used. This analysis is based on the assumption
1In the right-handed ATLAS coordinate system, the pseudorapidityηis defined asη = −ln[tan(θ/2)], where the polar angleθis measured with respect to the LHC beam-line. The azimuthal angleφis measured with respect to thex-axis, which points towards the centre of the LHC ring. Thez-axis is parallel to the anti-clockwise beam viewed from above. Transverse momentum and energy are defined as pT = psinθand ET = Esinθ, respectively. The angular distance∆Ris defined as
∆R=p
(∆η)2+(∆φ)2.
of a purely left-handed top-quark production like in the SM, since a priori the magnitude of any right- handed contribution is unknown. Right-handed top quark production might give rise to di
fferent signal kinematics which would need to be handled separately in the training of the neural network. It has been shown that the kinematics of FCNC single top-quark production does not depend on the choice of the coupling constants
κugtand
κcgtin the production.
The matrix element generator ALPGEN v2.14 [31] interfaced to the shower generator PYTHIA v6.4 [32] and the Perugia2011C [33] tune is used to generate W
+jets,Wb b ¯
+jets,Wc¯ c
+jets,Wc
+jetsand Z
+jets events with up to 5 partons. For both the matrix element calculations and the parton shower evolution the CTEQ6l1 [34] parton distribution function (PDF) is used. In order to remove overlaps between the n and n
+1 parton samples the ‘MLM’ matching scheme [31] is used. To remove the double counting between the inclusive W
+n parton samples and samples with associated heavy quark pair production an overlap removal based on
∆R matching is applied. The inclusive cross-sections of W/Z- boson production is calculated to next-to-next-to-leading order (NNLO) with FEWZ [35] leading to an uncertainty of
±4%. For theW
+jets and Z
+jets backgrounds in association with one additional jet, the Berends-Giele scaling [36, 37] uncertainty (W
+n
+1/W
+n) of
±24% is used. The cross section ofWc production, which is the dominant contribution to W
/Z-boson production in association with heavyquark jets, is calculated at NLO using MCFM [38]. The relative uncertainties on the heavy flavour contributions are 50% for Wb b ¯
+jets, Wc c ¯
+jets and Wc
+jets, estimated using a tag counting method in control regions [2].
The POWHEG [39] generator with the CT10 PDF set is used to generate t¯ t, Wt and s-channel single top events. The parton shower and the underlying event is added using PYTHIA v6.4 and the Peru- gia2011C tune. Electroweak t-channel single top-quark events are generated with AcerMC v.3.7 [40]
and PYTHIA v.6.4 using the the Perugia2011C tune. The cross section of the t¯ t process is normalized to 238 pb obtained from approximate next-to-next-to leading order (NNLO) QCD calculations using the HATHOR tool [41]. Theoretical uncertainties include the correlated PDF+
αSuncertainty, according to the MSTW prescription [42], and scale uncertainty, yielding an 8% relative uncertainty. The SM single top-quark production cross-sections are also calculated to approximate NNLO [43–45]. Production via a t-channel exchange of a virtual W boson has a predicted production cross section of 87 pb [43]. The cross section of the associated production of an on-shell W boson and a top quark (Wt-channel) has a predicted value of 22.3 pb [44] and the s-channel production a predicted cross section of 5.6 pb [45].
The resulting weighted average of the theoretical uncertainties including PDF and scale uncertainties of these three process is 10%. All top-quark processes are simulated with a top-quark mass of 172.5 GeV. Diboson events (WW, WZ and ZZ) are produced using HERWIG [46] and normalised to the NLO cross-section prediction. The cross-section uncertainty for these processes is 5%.
3 Event selection
Based on the expected signature of signal events, we select events with exactly one isolated electron or muon, missing transverse momentum and one jet, which we require to be identified as a b-quark jet. Events are considered only if they are accepted by a single-lepton trigger [47]. Electrons have to be accepted by either one of two single-electron triggers, with thresholds of E
T >24 GeV plus an isolation criterion, or E
T >60 GeV without isolation criteria. The single-muon trigger thresholds are either p
T >24 GeV with, or p
T>36 GeV without an isolation criterion.
Electron candidates are defined as clusters of cells in the electromagnetic calorimeter associated with
a well-measured track fulfilling several quality requirements [48]. Electron candidates are required to
satisfy p
T >25 GeV and
|ηclus|<2.47, where
ηclusis the pseudorapidity of the cluster of energy deposits
in the calorimeter. A veto is placed on electron candidates in the calorimeter barrel-endcap transition re-
gion, 1.37
<|ηclus|<1.52, that has a limited calorimeter instrumentation. High-p
Telectrons associated
with the W-boson decay can be mimicked by hadronic jets reconstructed as electrons, electrons from the decay of heavy quarks, and photon conversions. Since electrons from the W-boson decay are typically isolated from hadronic jet activity, these backgrounds can be suppressed by isolation criteria which re- quire minimal calorimeter activity and only low p
Ttracks in an
η-φcone around the electron candidate.
Isolation cuts optimized to achieve a uniform isolation e
fficiency across
ηclusand the transverse energy E
Twith the direction taken from the associated track are imposed on the electron candidates. For the calorimeter isolation a cone size of
∆R
=0.2 is used. The efficiency for electrons from W boson de- cays to pass this isolation requirement is 90%. In addition, the p
Tof all tracks within a cone of radius
∆
R
=0.3 around the electron direction, excluding the track belonging to the electron, is restricted to fall below an E
T-dependent threshold. The efficiency for this track-based isolation requirement is 90% for electrons from W boson decays.
Muon candidates are reconstructed by matching track segments or complete tracks in the muon spec- trometer with inner detector tracks. The final candidates are required to have a transverse momentum p
T >25 GeV and to be in the pseudorapidity region of
|η|<2.5. Isolation criteria are applied to reduce background events in which a high-p
Tmuon is produced in the decay of a heavy flavour quark. A mini- isolation variable [49] is defined as the scalar sum of the transverse momenta with p
Tabove 1 GeV from all tracks (except the one matched to the muon) within a cone with radius R
iso =10 GeV/ p
T(µ). Muon candidates are accepted that have a mini-isolation to muon p
Tratio of less than 0.05.
Jets are reconstructed using the anti-k
talgorithm [50] with a width parameter of 0.4, using topological clusters as inputs to the jet finding and are at first required to have p
T >25 GeV and
|η|<2.5. If any jets fall within
∆R
<0.2 of an electron, the closest jet is removed, as in these cases the jet and the electron are very likely to correspond to the same physics object. Remaining electron candidates overlapping with jets within
∆R
<0.4 are rejected subsequently. To reject jets from pile-up events a so-called jet- vertex fraction criterion is applied, where at least 50% of the scalar sum of the p
Tof tracks within a jet is required to be from tracks compatible with the primary vertex
2associated to the hard-scattering collision.
The final selected jet is required to have p
T >30 GeV and has also to be identified (b-tagged) as a b- quark jet. The tagging algorithm exploits the properties of a b-quark decay in a jet using neural-network techniques and the reconstruction of a secondary vertex [51]. The b- and c-tagging efficiencies, and the mis-tag rate for the taggers, are measured using the same methods as described in [52–54] and updated using the 2012 data set. The b-tagging algorithm has an e
fficiency of about 50% for b-jets in simulated t¯ t events, while only 0.1% of light-quark jets and 3.7% of c-quark jets are mis-tagged as b-quark jets.
The magnitude of the missing transverse momentum is defined as E
missT = |E
~missT |, whereE
~missTis calculated using the calibrated three-dimensional calorimeter energy clusters associated with the jet to- gether with either the calibrated calorimeter energy cluster associated with an electron or the p
Tof a muon track [55]. Transverse energy deposited in calorimeter cells but not associated with any high-p
Tobject is also included in the E
missTcalculation. Due to the presence of a neutrino in the final state of the signal process, E
Tmiss>30 GeV is required. To further reduce the number of multijet background events, which are characterised by low E
missTand low transverse W-boson mass
3m
T(W), the event selection requires m
T(W)
>50 GeV.
Two kinematical regions are defined in this analysis, both being subject to the same event selection requiring exactly one lepton, missing transverse momentum from the neutrino and exactly one b-tagged jet: the “signal region” using the default b-tagging requirement, and a “control region”, where a less stringent b-tagging requirement with a b-tagging efficiency of 85% is applied and events, where the jet passes the tighter b-tagging requirement are rejected. The control region is defined such that the compo- sition of the resulting sample is dominated by W
+jets production and that the same object definitions can
2The primary vertex is defined as the vertex with the largestP
pTof the associated tracks.
3The transverseWboson mass is defined as:mT(W) = q 2h
pT(`)EmissT −~pT(`)·E~missT i
, where~pT(`) denotes the transverse momentum of the lepton andpT(`)=|~pT(`)|
be used as in the signal region in order to check the correct modelling of kinematic variables. Assuming a cross-section of 1 pb for FCNC single top-quark production, about 500 signal events in 14.2 fb
−1of collision data are expected in the signal region and about 350 signal events in the control region.
For all background processes except the multijet background, the normalisations are estimated by using Monte Carlo simulation scaled to the theoretical cross-section predictions. Multijet events may be selected if a jet is misidentified as an isolated lepton or if the event has a non-prompt lepton that appears to be isolated. Different methods are used to estimate this background in the electron and muon channel. In the electron channel the jet electron model is used through which a shape for the multijet background is obtained by selecting simulated events where a jet is mis-reconstructed as an electron.
The normalization of the template is obtained by a fit to the observed data in the E
Tmissdistribution. In the muon channel the data driven matrix method is used, where the shape and normalisation of the multijet background is obtained by estimating the number of fake leptons in the signal region using measured efficiencies of real and fake leptons passing different isolation requirements as determined from collision data.
The jet electron model used in the electron channel establishes a shape for the multijet background using events from a Pythia dijet sample which are selected using similar criteria to the signal selection but with a jet used in place of the electron. Each jet has to fulfil the same p
Tand
ηrequirements as a signal lepton, contain at least four tracks to reduce the contribution from converted photons, and deposit 80–95% of its energy in the electromagnetic calorimeter. To avoid a contamination of the jet-electron sample by real electrons, events are vetoed if they contain one or more leptons that are identified ac- cording to high-e
fficiency but low-purity identification criteria. The event is accepted if exactly one
‘jet-electron’ is found. To determine the normalisation of the multijets background template in the elec- tron channel, a binned maximum likelihood fit is performed to the observed data in the E
missTdistribution after applying all selection criteria, leaving out the cut on E
missTonly. Fits are performed separately in two channels for electrons in the endcap (|η|
>1.5) and central (|η|
<1.5) region of the electromag- netic calorimeter, for both the signal and control regions in the 1-jet bin. The multijet template is fitted together with templates derived from MC simulation for all other background processes (top, W
+jets, W
+HF+jets,Z
+jets, dibosons) whose rate uncertainties are accounted for in the fitting process in theform of additional constrained nuisance parameters. For the purpose of these fits the contributions from W
+jets and W
+HF
+jets, the contributions from t¯ t and single top-quark production, and the contributions from Z
+jets and diboson production, were each joined into one template.In the muon channel, the matrix method [56] is used to obtain both the shape and normalisation of the multijet background. The method estimates the number of fake events in the signal region based on loose and tight lepton isolation definitions, the latter being a subset of the loose definition. Hence, the loose selection is defined to contain leptons of similar kinematics, but resulting in much higher yields and is, except for the muon isolation requirement, identical to the signal selection. The number of fake leptons passing the tight (signal) isolation requirements can be expressed by using measured efficiencies of real and fake leptons of the loose selection to also pass the tight isolation requirements.
These fake e
fficiencies are determined from collision data in a sample of selected muon candidates with high impact parameter significance. The real efficiencies are estimated from data in a high m
T(W) mass region (m
T(W)
>100 GeV). Both efficiencies are then applied to data in the form of event weights.
Based on comparisons of the rates obtained by using alternative methods, i.e. the matrix method in the electron channel and the jet-lepton method in the muon channel, and using an alternative variable, i.e.
m
T(W) instead of E
Tmissfor the binned likelihood fit, we assign a systematic uncertainty of 50% on the estimated multijet fractions.
In order to obtain scale factors for the non-multijet processes in the muon channel, which are not
determined as part of the matrix method, a fit to the E
missTdistribution in the muon channel is performed,
fixing the multijet rate to the value from the matrix method. The scale factors so obtained are only
applied to scale the corresponding backgrounds in the control plots in order to check the modelling of the kinematic distributions and are not used in the later analysis because all rate and cross-section uncertainties are fully accounted for in the final limit evaluation, see Section 6. The corresponding E
missTdistributions after rescaling the different backgrounds and the multijets template to their respective fit results are shown in Figure 1 for both the electron and muon channel.
[GeV]
miss
ET
0 50 100 150
Events / 5 GeV
0 10000 20000 30000 40000
data top W+jets Z+jets multijets MC stat. uncert.
Multijets norm. + = 8 TeV
s
-1, L dt = 14.2 fb
∫
ATLAS PreliminaryElectron control region
[GeV]
miss
ET
0 50 100 150
Events / 5 GeV
0 2000 4000
6000 data
top W+jets Z+jets multijets MC stat. uncert.
Multijets norm. + = 8 TeV
s
-1, L dt = 14.2 fb
∫
ATLAS PreliminaryElectron signal region
a) b)
[GeV]
miss
ET
0 50 100 150
Events / 5 GeV
0 5000 10000 15000 20000
data top W+jets Z+jets multijets MC stat. uncert.
Multijets norm. + = 8 TeV
s
-1, L dt = 14.2 fb
∫
ATLAS PreliminaryElectron control region
[GeV]
miss
ET
0 50 100 150
Events / 5 GeV
0 1000 2000 3000
data top W+jets Z+jets multijets MC stat. uncert.
Multijets norm. + = 8 TeV
s
-1, L dt = 14.2 fb
∫
ATLAS PreliminaryElectron signal region
c) d)
[GeV]
miss
ET
0 50 100 150
Events / 5 GeV
0 20000 40000 60000 80000
data top W+jets Z+jets multijets MC stat. uncert.
Multijets norm. + = 8 TeV
s
-1, L dt = 14.2 fb
∫
ATLAS PreliminaryMuon control region
[GeV]
miss
ET
0 50 100 150
Events / 5 GeV
0 5000 10000 15000
data top W+jets Z+jets multijets MC stat. uncert.
Multijets norm. + = 8 TeV
s
-1, L dt = 14.2 fb
∫
ATLAS PreliminaryMuon signal region
e) f)
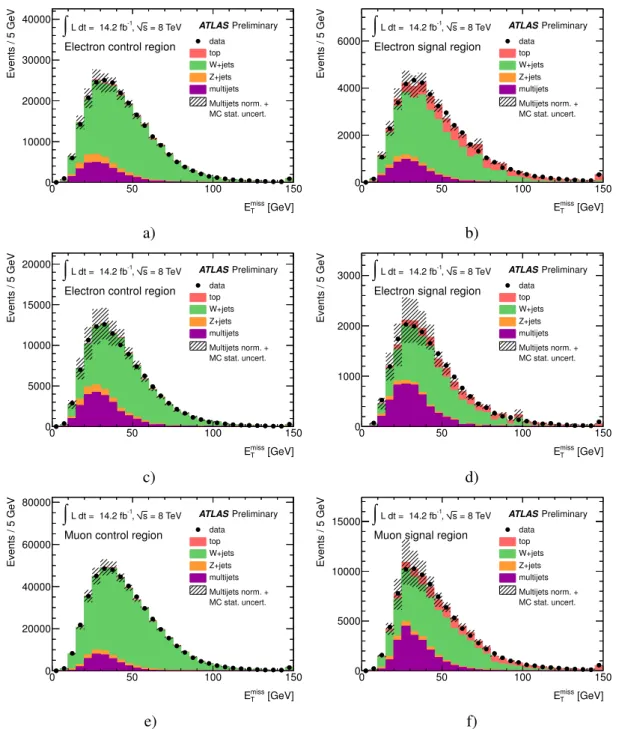
Figure 1: Fitted E
Tmissdistributions in the control region without the cut on E
missTapplied for electrons in the central (a) and forward (c) regions and for muons (e). The multijet rate in the muon channel is estimated using the matrix method. (b,d,f) show the respective distributions in the signal region.
The uncertainty bands denote the MC statistical uncertainty combined with the assigned multijet rate
uncertainty of 50%.
In the control region 596587 events are observed in data compared to a prediction of 560000± 160000 events from the estimates of SM backgrounds. Table 1 summarises the event yield in the control region for each of the background processes considered. In the signal region 112525 events are observed in data while the expectation from SM backgrounds amounts to 105000
±31000 events. The corresponding event yields in the signal region are summarized in Table 2. The yields in the signal and control region are calculated using the acceptance from MC samples normalised to their respective theoretical cross sections including the (N)NLO k factors. Each event yield uncertainty in Table 1 and 2 combines the statistical uncertainty, originating from the limited size of the simulation samples, with the uncertainty in the cross section or normalisation.
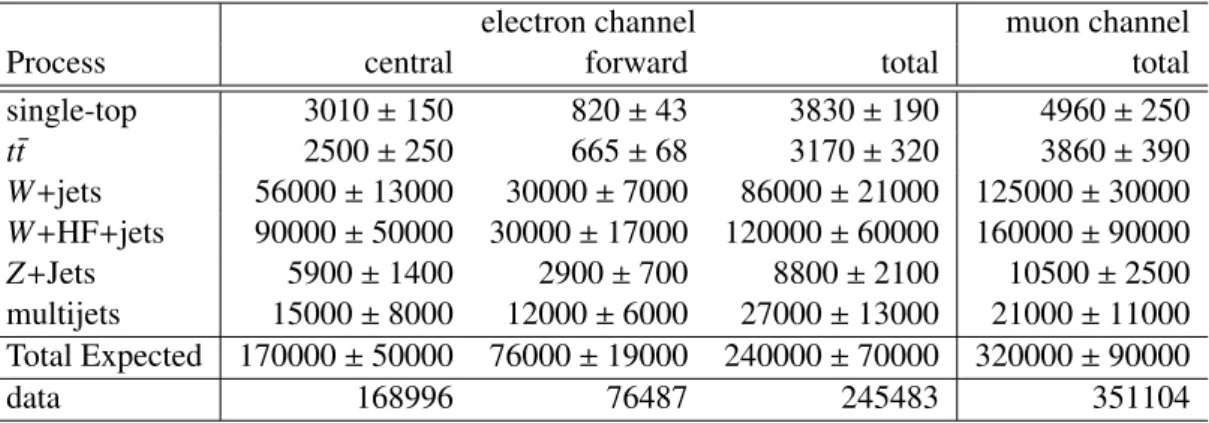
Table 1: Number of observed data events and expected number of background events for the control region. The event yields reflect the acceptance from MC samples normalised to their respective theoreti- cal cross sections and the data-driven multijet estimates. The uncertainties shown include the statistical uncertainties from the limited sizes of the simulation samples, the cross-section uncertainties and the multijet normalization uncertainty.
electron channel muon channel
Process central forward total total
single-top 3010
±150 820
±43 3830
±190 4960
±250
t¯ t 2500
±250 665
±68 3170
±320 3860
±390
W
+jets56000
±13000 30000
±7000 86000
±21000 125000
±30000 W
+HF
+jets 90000
±50000 30000
±17000 120000
±60000 160000
±90000
Z
+Jets 5900
±1400 2900
±700 8800
±2100 10500
±2500
multijets 15000
±8000 12000
±6000 27000
±13000 21000
±11000 Total Expected 170000
±50000 76000
±19000 240000
±70000 320000
±90000
data 168996 76487 245483 351104
Table 2: Number of observed data events and expected number of background events for the signal region. The event yields reflect the acceptance from MC samples normalised to their respective theoreti- cal cross sections and the data-driven multijet estimates. The uncertainties shown include the statistical uncertainties from the limited sizes of the simulation samples, the cross-section uncertainties and the multijet normalization uncertainty.
electron channel muon channel
Process central forward total total
single-top 4190
±210 1091
±57 5280
±270 6870
±350
t¯ t 3300
±330 870
±88 4200
±400 5300
±500
W
+jets2400
±700 1130
±350 4000
±1000 5100
±1300 W
+HF
+jets 16000
±9000 7000
±4000 23000
±13000 31000
±17000
Z
+jets720
±170 279
±74 990
±240 2000
±500
multijets 2800
±1400 2500
±1300 5400
±2700 13000
±6000 Total Expected 30000
±9000 12000
±4000 42000
±13000 63000
±18000
data 31271 12680 43951 68574
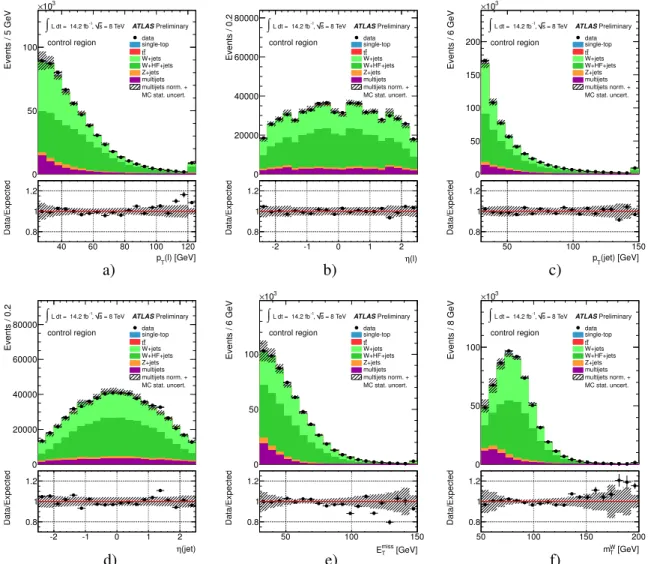
Kinematic distributions in the control region of the identified lepton, reconstructed jet, E
missTand
m
T(W) are shown in Figure 2. The distributions are normalised using the scale factors obtained in the
binned maximum likelihood fit in the E
Tmissdistribution. A very good agreement between the observed
and simulated distributions can be seen.
(l) [GeV]
pT
40 60 80 100 120
Data/Expected 0.8
1 1.2
Events / 5 GeV
0 50 100
103
×
data single-top
t t W+jets W+HF+jets Z+jets multijets MC stat. uncert.
multijets norm. + = 8 TeV
s -1, L dt = 14.2 fb
∫ ATLAS Preliminary
control region
η(l)
-2 -1 0 1 2
Data/Expected 0.8
1 1.2
Events / 0.2
0 20000 40000 60000 80000
data single-top
t t W+jets W+HF+jets Z+jets multijets MC stat. uncert.
multijets norm. + = 8 TeV
s -1, L dt = 14.2 fb
∫ ATLAS Preliminary
control region
(jet) [GeV]
pT
50 100 150
Data/Expected 0.8
1 1.2
Events / 6 GeV
0 50 100 150 200
103
×
data single-top t t W+jets W+HF+jets Z+jets multijets MC stat. uncert.
multijets norm. + = 8 TeV
s -1, L dt = 14.2 fb
∫ ATLAS Preliminary
control region
a) b) c)
(jet) η
-2 -1 0 1 2
Data/Expected 0.8
1 1.2
Events / 0.2
0 20000 40000 60000
80000 data
single-top t t W+jets W+HF+jets Z+jets multijets MC stat. uncert.
multijets norm. + = 8 TeV
s -1, L dt = 14.2 fb
∫ ATLAS Preliminary
control region
[GeV]
miss
ET
50 100 150
Data/Expected 0.8
1 1.2
Events / 6 GeV
0 50 100
103
×
data single-top
t t W+jets W+HF+jets Z+jets multijets MC stat. uncert.
multijets norm. + = 8 TeV
s -1, L dt = 14.2 fb
∫ ATLAS Preliminary
control region
[GeV]
WT
m
50 100 150 200
Data/Expected 0.8
1 1.2
Events / 8 GeV
0 50 100
103
×
data single-top t t W+jets W+HF+jets Z+jets multijets MC stat. uncert.
multijets norm. + = 8 TeV
s -1, L dt = 14.2 fb
∫ ATLAS Preliminary
control region
d) e) f)
Figure 2: Basic kinematic distributions of the combination of muon and electron channels in the control region. The distributions are normalised using the scale factors obtained in the binned maximum like- lihood fit in the E
missTdistribution. a) transverse momentum and b) pseudorapidity of the lepton, c) the transverse momentum and d) pseudorapidity of the jet, e) the missing transverse momentum and f) trans- verse W-boson mass. The last histogram bin includes overflow events and the hatched bands in the main and the ratio plot indicate the statistical uncertainty from the simulated samples size and the uncertainty on the multijet normalisation.
4 Data analysis
As no single variable provides su
fficient discrimination between signal and background events by itself and the separation power is distributed over many correlated variables, multivariate analysis techniques are necessary to separate signal candidates from background candidates. A neural-network classifier [57]
that combines a three-layer feed-forward neural network with a preprocessing of the input variables is
used. In order to improve the performance and to avoid overtraining, Bayesian regularisation is imple-
mented during the training processes. The network infrastructure consists of one input node for each of the 13 input variables plus one bias node, 20 nodes in the hidden layer, and one output node which gives a continuous output in the interval [
−1, 1]. The training is performed with a mixture of 50% signal and 50% background events, where the different background processes are weighted according to their number of expected events. We consider all backgrounds apart from the multijet sample in the training process.
All possible discriminating variables such as momenta, relative angles, pseudorapidity, reconstructed particles masses and lepton electric charge are explored, including variables obtained from the recon- structed W boson and the top quark. To reconstruct the four-momentum of the W boson, the neutrino four-momentum is derived from the measured E
~Tmiss, since it cannot be measured directly. Given the lepton four-momentum, the neutrino longitudinal momentum, p
νz, is calculated by imposing a kinematic constraint on the invariant mass of the W boson, (p
W)
2 =(p
`+p
ν)
2 =m
2W =(80.4 GeV)
2, where p
W, p
`and p
νare the four vectors of the W boson, lepton and neutrino, respectively. In case of a solution where p
νzis real, the twofold ambiguity is resolved by choosing the smallest
|pνz|solution, since the W boson is expected to be produced with small pseudorapidity. In about 30% of the events the relation has imaginary solutions. In this case, the E
missTis rescaled by a factor such that the imaginary part van- ishes. The top-quark candidate is reconstructed by adding the four-momentum of the b-tagged jet to the four-momentum of the reconstructed W boson.
Variables are selected as inputs to the neural network such that for a minimal number of variables the best possible separation between the signal and background processes is achieved. Each variable beforehand is tested for agreement between the background model and observed events in the control region and, taking account of potential signal contributions, also in the signal region. This leads to 13 variables remaining for the network. Table 3 shows a summary of the variables used ordered by their importance. The importance of the variables is estimated using an iterative procedure after their preprocessing. In this step the correlation matrix of the input variables is computed and their significance determined by removing each single variable and calculating the loss of correlation between the network output and the true desired values (target) caused by its removal. The variable causing the smallest loss of correlation is discarded, after which the correlation matrix is computed again and the procedure is repeated on the remaining (n
−1)-dimensional correlation matrix. At the end, a list of variables ordered in importance is obtained, where the fractional loss of total correlation to the target caused by its removal is given. Distributions of the three most important variables in the control and signal region are shown in Figure 3. The distributions are normalised using the scale factors obtained in the binned maximum likelihood fit to the E
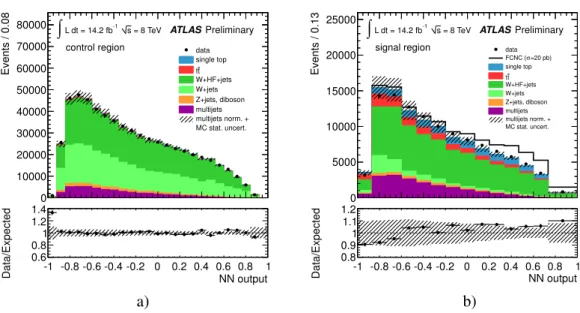
missTdistribution. Figure 4 shows the corresponding shape distributions for simulation for the signal and three most important background processes. The resulting neural network output distributions for the various processes in the control region are shown in Figure 5 a), while in Figure 5 b) the same distribution in the signal region is shown. Signal-like events have output values close to 1, whereas background-like candidate events accumulate near
−1. Overall, good agreement in both the control and signal regions is seen between data and predicted background processes.
5 Systematic uncertainties
In this analysis a variety of systematic uncertainties are considered which affect the normalisation of the individual background processes and the signal acceptance (rate uncertainties) as well as the shape of the neural network output distribution (shape uncertainties).
Object modelling
Systematic uncertainties due to the residual di
fferences between data and Monte
Carlo simulation, uncertainties on jets, electron and muon reconstruction after calibration, and uncer-
tainties on corrective scale factors are propagated to the event yields.
The uncertainties on the muon (electron) trigger, reconstruction and selection efficiency scale factors are estimated in measurements of Z
→µµ(Z
→ee and W
→eν) production. To evaluate uncertainties on the lepton momentum scale and resolution, the same processes are used. The jet energy scale (JES) uncertainty depends on the p
Tand
ηof the reconstructed jet [58]. It includes uncertainties in the flavour composition of the samples and mis-measurements from close-by jets. Additional contributions to this uncertainty due to the larger pile-up effects in 2012 data are included. An additional jet energy scale uncertainty, depending on the p
Tof the jet, is applied for b-quark induced jets due to differences between light and gluon jets as opposed to jets containing b-hadrons. The change in the JES is propagated to the missing transverse energy calculation. Smaller uncertainties result from the modelling of the jet energy
(b) [GeV]
pT
50 100 150
Data/Expected 0.8
1 1.2
Events / 6 GeV
0 50 100 150 200
103
×
data single-top
t t W+jets W+HF+jets Z+jets multijets MC stat. uncert.
multijets norm. + = 8 TeV
s -1, L dt = 14.2 fb
∫ ATLAS Preliminary
control region
(W) [GeV]
pT
0 50 100 150
Data/Expected 0.8
1 1.2
Events / 8 GeV
0 50 100
103
×
data single-top
t t W+jets W+HF+jets Z+jets multijets MC stat. uncert.
multijets norm. + = 8 TeV
s -1, L dt = 14.2 fb
∫ ATLAS Preliminary
control region
| [rad]
t-rest
ν) φ(W,
∆
|
0 1 2 3
Data/Expected 0.8
1 1.2
Events / 0.2 rad
0 20000 40000 60000 80000
data single-top t t W+jets W+HF+jets Z+jets multijets MC stat. uncert.
multijets norm. + = 8 TeV
s -1, L dt = 14.2 fb
∫ ATLAS Preliminary
control region
a) b) c)
(b) [GeV]
pT
50 100 150
Data/Expected 0.8
1 1.2
Events / 6 GeV
0 10000 20000
30000 datasingle-top
t t W+jets W+HF+jets Z+jets multijets MC stat. uncert.
multijets norm. + = 8 TeV
s -1, L dt = 14.2 fb
∫ ATLAS Preliminary
signal region
(W) [GeV]
pT
0 50 100 150
Data/Expected 0.8
1 1.2
Events / 8 GeV
0 5000 10000 15000 20000
data single-top
t t W+jets W+HF+jets Z+jets multijets MC stat. uncert.
multijets norm. + = 8 TeV
s -1, L dt = 14.2 fb
∫ ATLAS Preliminary
signal region
| [rad]
t-rest
ν) φ(W,
∆
|
0 1 2 3
Data/Expected 0.8
1 1.2
Events / 0.2 rad
0 5000 10000 15000
data single-top t t W+jets W+HF+jets Z+jets multijets MC stat. uncert.
multijets norm. + = 8 TeV
s -1, L dt = 14.2 fb
∫ ATLAS Preliminary
signal region
d) e) f)
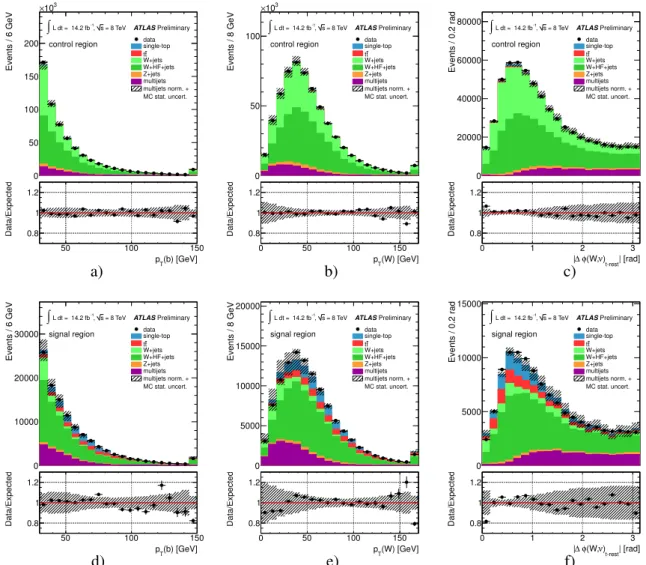
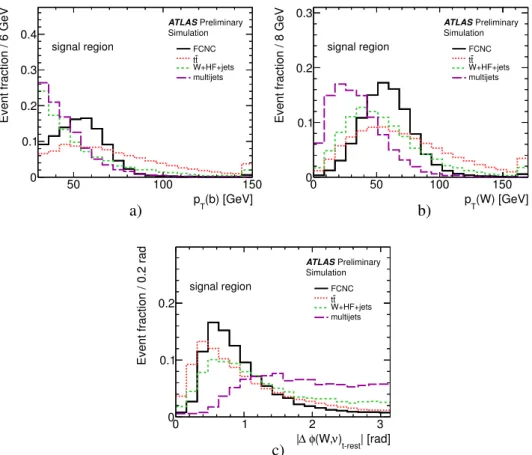
Figure 3: Kinematic distributions of the three most significant variables: transverse momentum of the b-
jet p
T(b) a),d), the transverse momentum of the W boson p
T(W) b),e), and the difference of the azimuthal
angle between the W boson and the neutrino in the top quark rest frame
|∆φ(W, ν)t−rest|c),f) shown in
the control region a)-c) and the signal region d)-f). All processes are normalised using the scale factors
obtained in the binned maximum likelihood fit to the E
Tmissdistribution. The last histogram bin includes
overflow events and the hatched bands in the main and the ratio plot indicate the statistical uncertainty
from the simulated samples size and the uncertainty on the multijet normalisation.
(b) [GeV]
pT
50 100 150
Event fraction / 6 GeV
0 0.1 0.2 0.3 0.4
FCNC t tW+HF+jets multijets Simulation
Preliminary ATLAS signal region
(W) [GeV]
pT
0 50 100 150
Event fraction / 8 GeV
0 0.1 0.2 0.3
FCNC t tW+HF+jets multijets Simulation
Preliminary ATLAS signal region
a) b)
| [rad]
t-rest
) ν (W, φ
∆
|
0 1 2 3
Event fraction / 0.2 rad
0 0.1 0.2
FCNC t tW+HF+jets multijets Simulation
Preliminary ATLAS signal region
c)
Figure 4: Kinematic distributions of the three most significant variables in the signal region normalised to unit area: transverse momentum of the b-jet p
T(b) a), the transverse momentum of the W boson p
T(W) b), and the di
fference of the azimuthal angle between the W boson and the neutrino in the top quark rest frame
|∆φ(W, ν)t−rest|c). The last histogram bin includes overflow events.
Table 3: Variables used as input to the neural network ordered by their importance, as estimated from the total correlation loss to the target caused by its removal.
loss of total loss of total
Variable correlation (%) Variable correlation (%)
p
T(b) 34
∆φ(`,W) 6
p
T(W) 19
∆φ(b, `νb)5
∆φ(W, ν) in the top quark rest frame
13
∆R(`, `νb) 5
Charge of the lepton q(`) 12
∆φ(W, `νb)4
η(`)
11
η(ν)4
∆φ(`,
b) 9 E
Tmiss4
η(`νb)
9
resolution and the missing transverse energy, which accounts for contributions of calorimeter cells not
associated to any jets and soft jets. Since the analyses makes use of b-tagging, the uncertainties on the b-
and c-tagging efficiencies and the mistag rate [52–54] are taken into account.
Events / 0.08
0 10000 20000 30000 40000 50000 60000 70000 80000
data single top
t t W+HF+jets W+jets Z+jets, diboson multijets MC stat. uncert.
multijets norm. + = 8 TeV
s
-1 L dt = 14.2 fb
∫
ATLAS Preliminarycontrol region
NN output -1 -0.8 -0.6 -0.4 -0.2 0 0.2 0.4 0.6 0.8 1
Data/Expected
0.6 0.8 1 1.2 1.4
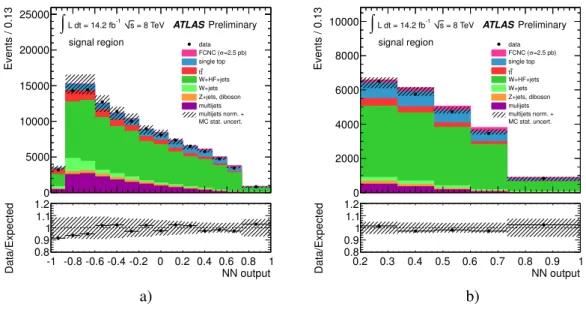
Events / 0.13
0 5000 10000 15000 20000 25000
data
=20 pb) FCNC (σ single top
t t W+HF+jets W+jets Z+jets, diboson multijets MC stat. uncert.
multijets norm. + = 8 TeV
s
-1 L dt = 14.2 fb
∫
ATLAS Preliminarysignal region
NN output -1 -0.8 -0.6 -0.4 -0.2 0 0.2 0.4 0.6 0.8 1
Data/Expected
0.8 0.9 1 1.1 1.2
a) b)
Figure 5: a) Neural network output distribution in the control region and b) in the signal region. Figure b) shows the signal shape stacked on top of the backgrounds and scaled to 20 pb. All background processes are shown normalised to the result of the binned maximum likelihood fit used to determine the fraction of multijet events. The hatched band indicates the statistical uncertainty from the simulated samples size and the uncertainty on the multijet normalisation.
Monte Carlo generators
Systematic e
ffects from the modelling of the signal and background pro- cesses are taken into account by comparing di
fferent generator models and varying parameters of the event generation. The MC modelling of the t¯ t process is studied by comparing two NLO generators interfaced to the HERWIG shower generator, namely MC@NLO
+HERWIG and POWHEG
+HERWIG and a multi-leg generator ALPGEN
+HERWIG. E
ffects of the parton shower modelling are evaluated by comparing POWHEG samples interfaced to two different shower generators, HERWIG and PYTHIA.
For all top-quark processes the amount of initial (ISR) and final state radiation (FSR) was varied by modifying parameters in samples generated with AcerMC and interfaced to the PYTHIA generator. The range of parameter variations was determined using collision data and is described in more detail in [59].
The W
+jets processes are produced using the multi-leg generator ALPGEN matched to the parton showergenerator HERWIG. Uncertainties connected with the matching are estimated by varying the matching scale and the functional form of the renormalisation and factorisation scale. Finally, an uncertainty is included due to the statistical precision of the limited size MC samples.
The systematic uncertainties related to the parton distribution functions are taken into account for all samples using simulated events. The events are reweighted according to each of the PDF uncertainty eigenvectors. The uncertainties are calculated using the formula given in Equation 43 of Ref. [60].
The final PDF uncertainty is calculated as the envelope of the estimated uncertainties for the CT10, MSTW2008nlo [61] and NNPDF2.3 [62] PDF sets, following the PDF4LHC recommendations [63].
Luminosity
The uncertainty on the integrated luminosity is 3.6%. It is derived, following the same methodology as in [64], from a preliminary calibration of the luminosity scale derived from Van der Meer scans taken throughout 2012.
The total uncertainty is dominated by the statistical uncertainty from the simulated samples size and
those on the cross-sections and the multijet normalization, see Table 2. Other important contributions
arise from uncertainties on the jet energy scale, jet energy resolution, the ISR/FSR variations, PDF
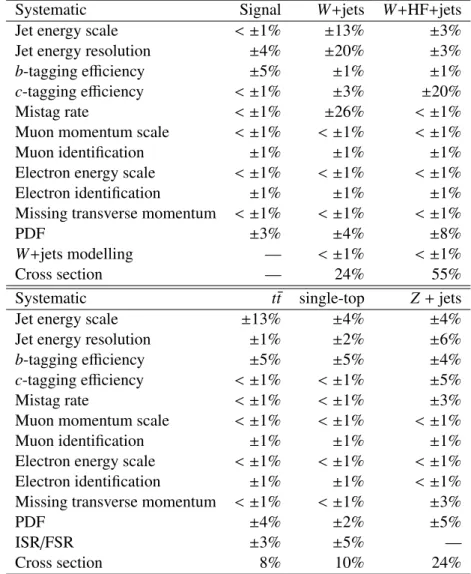
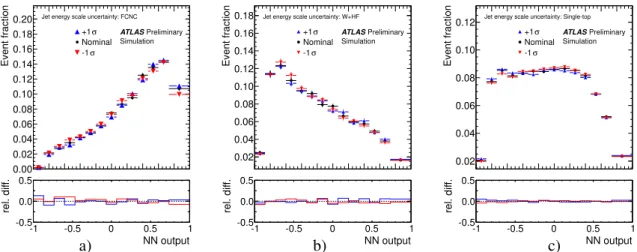
sets and uncertainties on b-tagging efficiencies and mis-tagging rates. Table 4 summarizes the resulting rate uncertainties for each considered process, while Figure 6 shows examples of shape uncertainties corresponding to jet energy scale variations for the three most important processes.
Table 4: Uncertainties on the number of expected candidate events on each signal and background source for the systematic variations explained in Section 5.
Systematic Signal W
+jets W
+HF
+jets
Jet energy scale
<±1% ±13% ±3%Jet energy resolution
±4%
±20%
±3%
b-tagging efficiency
±5% ±1% ±1%c-tagging e
fficiency
<±1% ±3% ±20%Mistag rate
<±1%
±26%
<±1%
Muon momentum scale
<±1% <±1% <±1%Muon identification
±1% ±1% ±1%Electron energy scale
<±1%
<±1%
<±1%
Electron identification
±1% ±1% ±1%Missing transverse momentum
<±1% <±1% <±1%3%
±4%
±8%
W
+jets modelling—
<±1% <±1%Cross section — 24% 55%
Systematic t¯ t single-top Z
+jets
Jet energy scale
±13% ±4% ±4%Jet energy resolution
±1% ±2% ±6%b-tagging efficiency
±5% ±5% ±4%c-tagging efficiency
<±1% <±1% ±5%Mistag rate
<±1% <±1% ±3%Muon momentum scale
<±1%
<±1%
<±1%
Muon identification
±1% ±1% ±1%Electron energy scale
<±1% <±1% <±1%Electron identification
±1%
±1%
<±1%
Missing transverse momentum
<±1% <±1% ±3%ISR/FSR
±3%
±5% —
Cross section 8% 10% 24%
6 Results
A Bayesian statistical analysis [65] using a binned likelihood method applied on the full neural net- work output distribution is performed to measure or set an upper limit on the FCNC single top-quark production cross-section.
Systematic uncertainties and their correlations among processes are included with a direct sampling
approach. For each source of uncertainty a Gaussian prior with the width of the corresponding uncer-
tainty for a given process and in case of shape uncertainties for each bin is used. The prior density for
the signal cross section is assumed to be flat. The posterior density function (pdf) is obtained by creating
a large number of samples, each drawn from the prior distributions. A separate likelihood distribution is
Event fraction
0.00 0.02 0.04 0.06 0.08 0.10 0.12 0.14 0.16 0.18
0.20 Jet energy scale uncertainty: FCNC Simulation
Preliminary ATLAS +1 σ Nominal -1 σ
NN output
-1 -0.5 0 0.5 1
rel. diff.
-0.5 0.0 0.5
Event fraction
0.02 0.04 0.06 0.08 0.10 0.12 0.14 0.16
0.18 Jet energy scale uncertainty: W+HF Simulation
Preliminary ATLAS +1 σ Nominal -1 σ
NN output
-1 -0.5 0 0.5 1
rel. diff.
-0.5 0.0 0.5
Event fraction
0.02 0.04 0.06 0.08 0.10
0.12 Jet energy scale uncertainty: Single-top Simulation
Preliminary ATLAS +1 σ Nominal -1 σ
NN output
-1 -0.5 0 0.5 1
rel. diff.
-0.5 0.0 0.5
a) b) c)
Figure 6: Shape differences caused by the jet energy scale uncertainty for a) the signal, b) W
+heavy flavour and c) SM single top-quark templates.
obtained for each sample, and the final pdf is averaged over all the individual likelihoods. This signal pdf gives the probability of the signal hypothesis, as a function of the signal cross-section, to be true. Since no significant rate of FCNC single top-quark production is observed, an upper limit is set by integrat- ing the pdf. To estimate the a priori sensitivity, a pseudo data set corresponding to the prediction from simulations (Asimov dataset) is used and treated in the same way as the observed dataset.
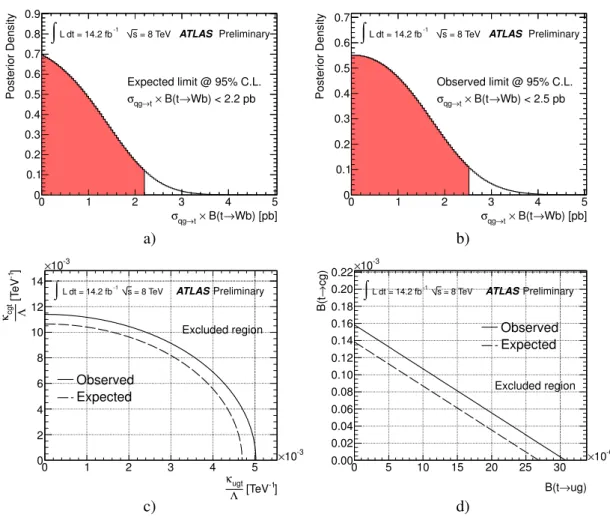
The posterior probability function using the Asimov dataset and including all systematic uncertainties is shown in Figure 7 a) together with the expected upper limit which is calculated by integrating the posterior probability function. The resulting expected upper limit on the anomalous FCNC single top- quark production cross section is 2.2 pb. The posterior probability function for the observed data sample, including all systematic uncertainties, is shown in Figure 7 b) together with the observed upper limit.
The observed 95% CL upper limits on the anomalous FCNC single top-quark production cross section including all uncertainties is 2.5 pb. To visualise the observed upper limit in the neural network output distribution, Figure 8 shows the FCNC signal process scaled to 2.5 pb stacked on top of all background processes normalised to the mean values of their posterior rate distributions as obtained from the limit calculation. Using the NLO predictions for the FCNC single top-quark production cross-section [21, 66]
and assuming
B(t →Wb)
=1, the measured upper limit on the production cross-section is converted into limits on the coupling constants
κugt/Λand
κcgt/Λ. Assuming
κcgt/Λ =0 one finds
κugt/Λ <5.1
·10
−3TeV
−1and assuming
κugt/Λ =0 one finds
κcgt/Λ <1.1
·10
−2TeV
−1. Figure 7 c) shows the distribution of the upper limit for combinations considered in [21]. Limits on the coupling constants can be converted into limits on the branching fractions using
B(t→qg)
=c
·κqgtΛ
2