Contents lists available atScienceDirect
Ore Geology Reviews
journal homepage:www.elsevier.com/locate/oregeorev
Invited Review Article
Geological fate of seafloor massive sulphides at the TAG hydrothermal field (Mid-Atlantic Ridge)
Bramley J. Murton
a,⁎, Berit Lehrmann
a, Adeline M. Dutrieux
b, Sofia Martins
c,d,
Alba Gil de la Iglesia
a,f, Iain J. Stobbs
b, Fernando J.A.S. Barriga
c, Jörg Bialas
d, Anke Dannowski
d, Mark E. Vardy
a,g, Laurence J. North
a, Isobel A.L.M. Yeo
a, Paul A.J. Lusty
e, Sven Petersen
daNational Oceanography Centre, European Way, Southampton SO14 3ZH, UK
bUniversity of Southampton, Waterfront Campus, European Way, Southampton SO14 3ZH, UK
cDepartamento de Geologia, Faculdade de Ciências, Universidade de Lisboa, 1749-016 Lisboa, Portugal
dGEOMAR Helmholtz Center for Ocean Research Kiel, Wischhofstrasse 1-3, 24148 Kiel, Germany
eEnvironmental Science Centre, British Geological Survey, Nicker Hill, Keyworth NG12 5GG, UK
fUppsala Universitet, Institutionen för geovetenskaper, Geofysik, Villavägen 16, SE-752 36 Uppsala, Sweden
gSAND Geophysics, Ltd., Unit 15. The Sidings, Hound Round, Southampton SO31 5QA, UK
A R T I C L E I N F O Keywords:
Seafloor massive sulphide Seafloor drilling Seismic imaging High-resolution mapping
A B S T R A C T
Deep-sea mineral deposits potentially represent vast metal resources that could make a major contribution to future global raw material supply. Increasing demand for these metals, many of which are required to enable a low-carbon and high-technology society and to relieve pressure on land-based resources, may result in deep sea mining within the next decade. Seafloor massive sulphide (SMS) deposits, containing abundant copper, zinc, gold and silver, have been the subject of recent and ongoing commercial interest. Although many seafloor hydrothermally systems have been studied, inactive SMS deposits are likely more accessible to future mining and far more abundant, but are often obscured by pelagic sediment and hence difficult to locate. Furthermore, SMS deposits are three dimensional. Yet, to date, very few have been explored or sampled below the seafloor. Here, we describe the most comprehensive study to date of hydrothermally extinct seafloor massive sulphide (eSMS) deposits formed at a slow spreading ridge. Our approach involved two research cruises in the summer of 2016 to the Trans-Atlantic Geotraverse (TAG) hydrothermal field at 26°N on the Mid-Atlantic Ridge. These expeditions mapped a number of hydrothermally extinct SMS deposits using an autonomous underwater vehicle and re- motely operated vehicle, acquired a combination of geophysical data including sub-seafloor seismic reflection and refraction data from 25 ocean bottom instruments, and recovered core using a robotic lander-type seafloor drilling rig. Together, these results that have allowed us to construct a new generic model for extinct seafloor massive sulphide deposits indicate the presence of up to five times more massive sulphide at and below the seafloor than was previously thought.
1. Introduction
Demand for mineral raw materials is increasing as a result of po- pulation growth, rising living standards, urbanisation and, more re- cently, the transition to a low-carbon economy (Zepf et al., 2014). Yet the mining industry faces numerous challenges including rising costs, reducing ore grades and declining discovery rates of new deposits (Calvo et al., 2016). As a result, alternative sources of these minerals
are being considered, including the deep-ocean.
Seafloor massive sulphide deposits, formed through hydrothermal venting, are considered to be the modern analogous of ancient volca- nogenic massive sulphide deposits preserved on land. Although the number of hydrothermal vent discoveries has been steadily increasing since the first discovery at the Galapagos Rift in 1977 (Corliss et al., 1979), and more than 600 sites are known today (Beaulieu et al., 2015), the economic importance of the associated SMS deposits is poorly
https://doi.org/10.1016/j.oregeorev.2019.03.005
Received 1 October 2018; Received in revised form 4 March 2019; Accepted 6 March 2019
⁎Corresponding author.
E-mail addresses:bramley.murton@noc.ac.uk(B.J. Murton),berit.lehrmann@noc.ac.uk(B. Lehrmann),A.Dutrieux@noc.soton.ac.uk(A.M. Dutrieux), smartins@geomar.de(S. Martins),alba.gil@geo.uu.se(A.G. de la Iglesia),Iain.Stobbs@soton.ac.uk(I.J. Stobbs),fbarriga@fc.ul.pt(F.J.A.S. Barriga), jbialas@geomar.de(J. Bialas),adannowski@geomar.de(A. Dannowski),mark.vardy@noc.ac.uk(M.E. Vardy),l.j.north@noc.ac.uk(L.J. North), isyeo@noc.ac.uk(I.A.L.M. Yeo),plusty@bgs.ac.uk(P.A.J. Lusty),spetersen@geomar.de(S. Petersen).
Available online 22 March 2019
0169-1368/ © 2019 The Authors. Published by Elsevier B.V. This is an open access article under the CC BY license (http://creativecommons.org/licenses/BY/4.0/).
T
known. Recent estimates suggest modern hydrothermally active sites account, globally, for at least 650 million metric tonnes (Mt) of massive sulphides containing 10 Mt of copper (Cu), 29 Mt of zinc (Zn), 1 Mt of lead (Pb), 33 Mkg silver (Ag), and 750,000 kg gold (Au) (Hannington et al., 1999, 2011). Published bulk geochemical data from 95 of these modern SMS deposits suggest a median grade of 3 wt.-% Cu, 9 wt.-% Zn, 2 g/t Au and 100 g/t Ag (Hannington et al., 2011; Monecke et al., 2016). However, these analyses are mainly derived from easily re- coverable surface grab-samples, such as high-temperature sulphide chimney and related talus material, and may not be representative of the average composition of the deposits at depth. It is likely that the vast majority of SMS deposits are no longer hydrothermally active and are increasingly covered by pelagic sediment as they age. It remains unknown what low temperature geological and environmental pro- cesses affect hydrothermally extinct SMS (eSMS) deposits once the flow of chemically reduced hydrothermal fluid ceases, whether the metal tenor becomes enriched, depleted or disappears with time, and what the structure and composition of these deposits is beneath the seafloor.
To enhance our understanding of modern eSMS deposits, two re- search expeditions (M127 on RV Meteor and JC138 on RRS James Cook) were conducted at the TAG hydrothermal field at 26°09′N, 49°30′W, on the Mid-Atlantic Ridge, in 2016, as part of the EU-funded Blue Mining project. The objectives were to determine the sub-seafloor morphology, mineralogy, composition and extent of the sulphide mi- neralisation in eSMS deposits. Here, we report the results of that work and combine observations based on surface geology, sub-seafloor dril- ling and seismic imaging, to yield a new model for eSMS deposits at slow-spreading ridges.
2. Geological setting
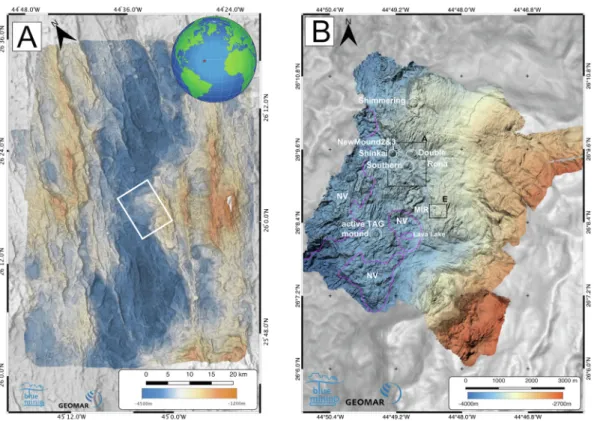
The Mid-Atlantic Ridge is a slow-spreading (22 mm/year) ridge (Kleinrock and Humphris, 1996), and the associated TAG hydrothermal field is one of the most intensively studied seafloor hydrothermal sys- tems (e.g.Rona et al., 1975, 1984, 1986; 1993a,b; Humphris et al., 1995, 2015; Humphris and Kleinrock, 1996; Evans, 1996; Tivey et al., 1995, 1996; Petersen et al., 2000; DeMartin et al., 2007; Zhao et al., 2012). It lies at water depths ranging from 3,430 to 3,670 m on the eastern and shallowest part of a 75 km-long, second-order spreading segment bounded by two right-lateral non-transform discontinuities at 25°58′N and 26°17′N (Fig. 1A). The TAG segment is characteristic of most slow-spreading ridge segments, having a fault-bounded graben, bound by abyssal hills and faults (here oriented NNW-SSE) forming a deep axial valley that hosts a neovolcanic zone comprising young lavas, hummocky volcanic ridges and isolated volcanoes (White et al., 1998).
The active TAG mound is the current locus of venting of high temperature (up to 363 °C) hydrothermal fluids, that has resulted in the formation of a 200 m diameter, 50 m high circular deposit topped by a number of 12 m-tall black-smoker chimneys (Humphris et al., 2015).
During ocean drilling programme (ODP) Leg158, in 1994, seventeen holes were drilled at five locations into the active TAG mound (Humphris et al., 1995). The maximum depth of penetration was 125 m below seafloor (mbsf). The holes intersected massive pyrite breccia in the upper part of the mound overlying anhydrite-rich breccia, below which a silicified, pyritised, altered basaltic stockwork was en- countered. The lowermost part of the drill holes intersected highly-al- tered basaltic host rock. Metals of economic interest such as Cu, Zn, Ag and Au were only found to be enriched in the upper 5 m of the mound (Hannington et al., 1998) whereas mainly barren massive pyrite body was identified below this depth.
Radiometric dating indicates hydrothermal activity at the active TAG mound first started 50,000 years ago with episodic periods of ac- tivity of tens to hundreds of years (Lalou et al., 1990) characterised by accumulation and recrystallisation of sulphides, precipitation of sub- stantial amounts of anhydrite, and remobilisation of metals. Intervening periods of hydrothermal inactivity lasted 3,000 to 5,000 years, during
which mass wasting, anhydrite dissolution and interior brecciation occurred. The current period of hydrothermal activity at the active TAG mound commenced about 80 years ago (Lalou et al., 1998).
In addition to the active TAG mound, at least seven other hydro- thermally inactive or eSMS deposits have previously been identified (Fig. 1B) in an area of ∼2.5 km2(Rona et al., 1993a,b). The largest cluster of deposits is known as the Alvin Zone and lies ∼1.5 km north- northeast of the active TAG mound, at a depth of 3,400 to 3,600 m. It consists of a number of roughly circular individual mounds (Fig. 2A) that are typically up to 60 m high, 100 to 300 m in diameter, formed from weathered sulphide talus, variably covered in pelagic and hy- drothermal sediment (Humphris et al., 2015and references therein), and are between 6,000 to 75,000 years old (Lalou et al., 1990, 1993, 1998). These mounds include Double, Shinkai and Southern (Fig. 2B,C).
Another 200 m diameter area of iron-oxide and weathered sulphide material, called Shimmering Mound, occurs 1 km to the north of Shinkai Mound where low temperature fluids (≤22 °C) diffuse through iron-bearing silicates, iron-oxyhydroxides (FeOOH) and iron-manga- nese oxides (Humphris et al., 2015). During cruise M127 (Petersen and Shipboard Scientific party, 2016), further hydrothermal structures were discovered including a 30 m high, 100 m diameter, dome-shaped mound, named Rona Mound (Fig. 2D) after the late Peter Rona, who was the first to discoverer hydrothermal activity at the Mid-Atlantic Ridge (Rona et al., 1975, 1984). Two smaller mounds (~20–30 dia- meter) on the north-eastern and south-eastern side of Shinkai Mound, are called New Mound #2 and New Mound #3 (Fig. 2A-B).
In addition to the extensive Alvin Zone, a second hydrothermally inactive site occurs, called the MIR Zone (Fig. 2E). This site is located two kilometres to the east-northeast of the active TAG Mound in water depths of 3,430 to 3,575 m. In comparison to the Alvin Zone, this area lacks mound-like features, and instead comprises a raised area of irre- gular and undulating seafloor, several 100′s m in diameter and a few 10′s m high, composed of an accumulation of weathered sulphide ma- terial and iron-rich sediments with a discontinuous pelagic sediment cover (White et al., 1998).Rona et al. (1993a)divide the MIR Zone into three distinct areas. The western part comprises weathered sulphide debris and hydrothermal sediments that are underlain by hydrothermal breccia. In contrast, the central zone is dominated by toppled and standing relict chimneys. No sulphides are recorded from the eastern zone where FeOOH, iron-rich clays and manganese oxy-hydroxide (MnOOH) crusts occur. Radiometric dating indicates that hydrothermal activity commenced 140,000 years ago with the last active episode ceasing only 600 years ago (Lalou et al., 1993; Humphris and Tivey, 2000).
The TAG hydrothermal field is a basalt-hosted system (Rona et al., 1993a,b) and the composition of the vent fluids and their mineral de- posits are consistent with fluid interaction with a mafic host rock (Campbell et al., 1988). As such, the TAG hydrothermal field can be considered a classic example of a modern, volcanogenic massive sul- phide deposit and is distinct from deposits formed in intra-continental rift zones, back-arc basins and volcanic arcs. Recent studies have shown that the TAG hydrothermal field is formed on the hanging wall of an active detachment fault (Tivey et al., 2003), with seismic data in- dicating the footwall comprises lower-crustal or serpentinised upper- mantle lithologies (DeMartin et al., 2007).
No accurate resource estimates are available for the whole TAG hydrothermal field, although attempts have been made using bulk geochemical data from the literature and combining them with the volume of the mounds above the surrounding seafloor under the pre- mise that Alvin and MIR zones consist of similar lithologies to those observed in the sub-seafloor beneath the TAG mound. Based on these data, the mass of sulphides in the active TAG Mound is thought to be up to 3.9 million tons (Hannington et al., 1998) and the Alvin and MIR zones each range between 1 to 4 million tons. However, many of the samples used to estimate the composition of the eSMS mounds are surface grab material, such as chimney fragments enriched in Cu, Zn,
Fig. 1.(A) Ship-board multibeam swath bathymetry map (50 m grid) of the axial valley of the Mid-Atlantic Ridge containing the TAG hydrothermal field, at 26°08°N on the Mid-Atlantic, and indicated by the location of the red star on the inset globe. Inset white outlined box is location ofFig. 1B. (B): AUV-derived, near bottom multibeam swath bathymetry map (5 m grid) of the TAG hydrothermal field showing the location of the active TAG mound and other eSMS mounds (outlined in white) and young neovolcanic areas (outlined in magenta and denoted NV). Inset black boxes (A) and (E) show the location ofFig. 2A, the ‘Three Mounds’ area, and Fig. 2E, the MIR zone, respectively.
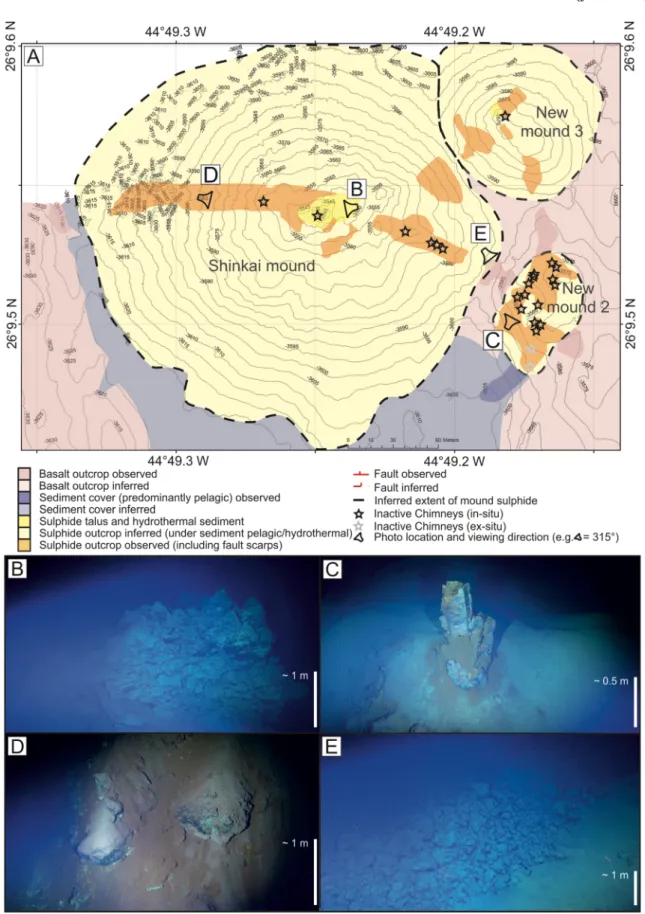
Fig. 2.(A) Colour-shaded bathymetry maps (0.5 m resolution) of the ’Three Mounds’ area surveyed by the AUVAbyssduring expedition M127 and OBS positions (red diamonds) reported in this contribution and used to image dimensions of the sulphide mounds and their physical properties (P-wave velocity) while recording the air- guns shots (white dashed line). Thin white lines depict the base of the mounds. Note depth scale bar (lower right) applies to all panels. (B) Detail showing Shinkai Mound and the smaller New Mound #2 and #3, located NE and SE of main Shinkai Mound, respectively. (C) Detail showing Southern Mound, its fault scarps and drill locations occupied during expedition JC138 (yellow stars). (D) Detail showing Rona Mound and the location of the drill holes occupied during JC138. (E) Detail showing MIR Zone and drill locations occupied during JC138.
Au and Ag, and may not be representative of the three-dimensional deposit at depth.
Until now, the focus of the majority of research in the TAG hydro- thermal field has been on the high-temperature active TAG mound.
Here, we focus on the hydrothermally eSMS deposits in the Alvin and MIR zones, with the aim to characterise their structure and composition at depth, and determine common processes affecting their evolution, degradation and preservation on and below the seafloor.
3. Methods
The data reported here were collected during the EU-funded Blue Mining programme expeditions M127 (RV Meteor) and JC138 (RRS James Cook) in May to August 2016. An important and novel aspect of our study was the collection and integration of geological and geo- physical data acquired from the same area. The study area was initially mapped using the ship’s multibeam echosounder, followed by autono- mous underwater vehicle (AUV) missions for high resolution mapping of the eSMS mounds. These were then imaged using a variety of geo- physical methods, that occupied the same profile lines across eSMS mounds, followed by surveys using a robotic underwater vehicle (RUV) and drilling by a robotic lander-type seafloor drilling rig (RD2). From this body of complementary data we are able to describe the common features of the eSMS deposits, starting from the surface geology (in- cluding exposures of basement in fault scarps) and progressing through drilled core to a maximum depth of 12.5 mbsf. Whole-rock material from the core was geochemically and petrologically analysed for major and trace element variations and sulphide mineralogy. To obtain in- formation on the deeper subsurface, i.e. below the maximum drilling depth, geophysical methods were used including seismic data acquired by 25 ocean bottom seismometers placed on and around the eSMS mounds. These mainly recorded internal reflections from within the deposits and the underlying crust, down to depths of ∼400 mbsf.
Refractions from deeper in the crust, down to 3.5 km, were also ac- quired. Controlled source electromagnetic surveys were also conducted but the results are presented elsewhere.
3.1. AUV, RUV mapping and surface sampling
Given their water depth (3,600 m) and relatively small size (100–300 m diameter), high-resolution bathymetry data were acquired from near the seafloor using an AUV operated by GEOMAR (Petersen and Shipboard Scientific party, 2016) during M127. Multibeam swath sonar data were acquired from a RESON Seabat 7125 operated at 200/
400 kHz frequencies and processed to a resolution of between 2 and 0.5 m. The AUV was navigated using a long-baseline acoustic system, and later dead-reckoning using Doppler velocity logging and an Inertial Navigation System. Multiple missions were undertaken over the TAG hydrothermal field, from a variety of altitudes, and the data geo- graphically merged for internal consistency, gridded, and geo- graphically co-registered by locating the images to the 3 m-diameter steel re-entry cones left by the ODP drilling sites on the active TAG mound, which have well-known locations. High-resolution maps of the individual eSMS mounds were generated at a resolution of 0.5 m and reveal details of the deposits including fault scarps, collapse structures and extinct chimneys.
The surface geology of the eSMS mounds was studied during the second cruise (JC138) by videography and sampling from the RUV HyBIS (Murton et al., 2012), focussing on the Shinkai, Southern and Rona mounds (Murton and Shipboard Scientific Party, 2018). Missions were planned on the basis of the AUV-derived bathymetry maps and RUV navigation used ultra-short baseline (USBL) with a precision of ± 5 m and an accuracy of ± 10 m. In total, 52 h of HD video imagery were obtained during seven dives. A total of twenty-nine HyBIS surface samples were obtained mainly from Southern Mound, with a few samples from Rona and Shinkai mounds. These provide information on
the near-seafloor composition and allowed validation of observations made from the video images.
3.2. Coring of sediments
Sediment samples were largely collected by 3 m-long gravity coring to characterise the superficial seafloor geology. The thickest sediment accumulations were identified from the multibeam bathymetry (being smooth and having low acoustic backscatter) and shipboard sub-bottom profiler data. Gravity cores were navigated subsea by USBL and ac- quired from the top and base of the eSMS mounds, and up to several kilometres away, targeting sediment ponds and areas with thinner se- diment. The sediments are classified as being hydrothermally influ- enced when iron and base metals, such as copper and zinc, exceed the value found in the background pelagic sediments (carbonate ooze).
Variation in iron and manganese content relate to hydrothermal plume fall-out, and high-sulphide concentrations are the result of massive sulphide erosion, transport and deposition.
3.3. Drilling
Following the mapping phase, JC138 deployed the RD2, operated by British Geological Survey. The RD2 system is capable of coring up to 55 mbsf in water depths up to 4,000 m. Several sensors allow real-time monitoring of drilling parameters such as revolutions per minute, torque, bit weight, feed force, feed pressure, feed speed, water flow and water flush rates. Landing RD2 on surfaces on the mounds that were flat enough and could support the weight of the rig to ensure a final in- clination of less than 5° proved difficult. Despite the relatively precise navigation provided by our USBL system, these flat target benches were no more than 10 m in diameter. To facilitate the final landing, flashing beacons were placed on the seafloor by the RUV HyBIS, following drill site selection.
3.4. Petrological and geochemical analyses
Full drill cores and sediment gravity cores were described, photo- graphed, split and subsampled on board. Polished thin (30 µm) and thick sections (200 µm) were made from selected pieces for petrological and micro-analytical studies using transmitted and reflected light mi- croscopy.
Bulk geochemical data were obtained from individual or composite quarter-core pieces of the same lithology. These were crushed, pow- dered and homogenised with 10 g of each sample being analysed by Activation Laboratories Ltd. (Actlabs, 2017) in Canada, using: Instru- mental Neutron Activation Analysis (INNA), sodium peroxide fusion with Inductively-Coupled Plasma Optical Emission Spectrometry (ICP- OES) & Mass Spectrometry (ICP-MS) analyses, total sulphur infrared spectroscopy, and cold vapour flow-injection atomic absorption spec- trometry. Sediment analysis performed on approximately 100 mg of acid-digested dried and ground material, after applying an internal spike of Be, Re and In. Analysis was performed by ICP-OES for major elements (e.g. Ca, Cu, Fe, Mn and Zn) and by ICP-MS for minor ele- ments and trace element (e.g. Cu for some depths). Precision and ac- curacy were determined for each analytical run by repeat analysis (n = 3) of the two Certified Reference Materials: (i) marine sediments MESS-1 (National Research Council of Canada) and (ii) sulphide ore mill tailings RTS-1 (National Research Council of Canada). Elemental precision for each run was less than 4% and 2.7%, respectively, except for Zn which was up to 13% by ICP-OES due to a low concentration in RTS-1 and MESS-1. Silica concentrations in jasper samples were de- termined by X-Ray Flourescence (XRF) using approximately 0.5 g of dried, ground and homogenised material, mixed with Lithium Tetra- borate flux and fused into a glass beads. These were analysed on a Philips®MagiX-Pro 4 kW using a Rh X-ray tube.
Mineral identification in sediment was performed on homogenised
dried powder samples using an X-Ray diffractometer (MiniFlexII, Rigaku, Japan) equipped with MiniFlex2 + goniometer and detector.
CuKα1 radiation (1.541 Å) was applied at 30 kV, with 15 mA of beam current. The 2θ incidence angle spanned from 5° to 60° with a scan speed of 1.2°/min using a continuous scan mode. Quartz standards were also run to ensure calibration. The data were analysed using the
“Panalytical Highscore” software with reference to the ICDD minerals database 2018.
3.5. Geophysics
To assess the dimensions and structure of the deep interior of the TAG eSMS mounds, active seismic experiments were performed using two different air-gun source arrays: a G-gun array (760 cubic-inch, 2 m depth, 12 s shot interval) for lines up to 10 km-long, and a GI-gun array (210 cubic-inch, 6 m depth, 9 s shot interval) for the shorter lines up to 5 km-long, respectively. Twenty Ocean Bottom Seismometers (OBS) and five Ocean Bottom Hydrophones (OBH) recorded the airgun shots. To obtain the internal velocity and gross geometries of the deposits, 10 of the 20 OBS were placed on top of the Shinkai and Southern mounds by Table 1
Table of components and P-wave velocities for material recovered from the active TAG mound by drilling (Ludwig et al., 1998) and used here as a starting reference for the velocity structure at the eSMS mounds.
Lithology Sulphide % Silica % Basalt % Porosity Average P-vel (km/s)
Massive sulphide 70 5 0 High 5.5
Pyrite-Breccia 63 34 0 Low 6.3
Silicified Stockwork 46 54 0 Low-intermediate 5.7
Altered Basalt 0 0 100 Very low 4.1
Fig. 3.An example from the flank of Shinkai Mound (OBS #04) of a ray tracing diagram and travel time picks, determined from the data (in colours according to their travel paths; seeFig. 13), and the best fits (in black) derived from forwarding modelling using the RAYINVR code (Zelt and Smith, 1992); colours being: red:
direct arrival; blue: Pb; green: PbP; cyan; PcP; yellow: PeP.
the RUV HyBIS, with an offset between instruments of about 75 m for the central part of the mounds. The other instruments (10 OBS and 10 OBH) were deployed by free-fall along crossing seismic profiles with offsets of 350–750 m between instruments.
Following acquisition, the OBS records were processed by separ- ating the different shot lines, accurately locating the ocean bottom in- struments on the seafloor, filtering to remove source ringing and flat- tening of the records to the first arrival for easier arrival identification/
picking. P-wave velocity-depth models for the profiles were then gen- erated by forwarding modelling the travel-times using the RAYINVR ray-tracing software (Zelt and Smith, 1992). Starting conditions, used to set the initial boundary conditions in the inversion modelling, were based on laboratory measured seismic velocities for materials recovered during ODP drilling of the active TAG mound (Table 1). The model was iterated to establish new velocities for the eSMS mounds that minimise the misfit between the observed and modelled arrivals.Fig. 3shows examples for OBS #04, located on the flank of Shinkai mounds, and the best-fit solutions (in black) between the velocity model and the arrivals picked from the seismic records.
4. Results
4.1. Geology of the TAG hydrothermal field
Multibeam swath bathymetry mapping of the TAG hydrothermal field shows significant variability in tectonic and volcanic processes.
The central part of the TAG hydrothermal field is characterized by hummocky volcanic lavas that coalesce into mounds, 100–500 m in diameter, forming a neovolcanic zone ∼1 km to the west of the eSMS mounds (Fig. 1B). The westernmost part of the area generally comprises unfaulted hummocky lava mounds and ridges, including a frozen lava- lake ∼500 m to the east of the active TAG mound. In the centre of the TAG hydrothermal field, a zone of extensional faulting is dominated by NNE-SSW strikes (Fig. 2A). At ∼29°09.5′N, these fault traces bend to- wards a N-S trend southward, indicative of left-lateral shear. The con- vergence of these fault orientations coincides with the Alvin Zone, where the most prominent eSMS mounds are located, and they are thought to control hydrothermal fluid pathways from deep within the crust (Karson and Rona, 1990; Kleinrock and Humphris, 1996).
4.2. Morphology of eSMS mounds
The highest resolution bathymetry reveals changes in slope and mass wasting features that indicate relative ages for the eSMS mounds
in the Alvin Zone (Fig. 4). Of these, the Shinkai Mound and the adjacent New Mounds appear to be younger, based on their steeper slopes and sharp conical shapes with meter-high pinnacles on the summits, in- dicative of relict hydrothermal chimneys. Double, Southern and Rona mounds appear to be older, despite being located only 500 m further to the east, having much smoother and more rounded features, more dome like than conical, and being intensely dissected by curved faults. The gentle slopes and smoothness of these older eSMS mounds reflects the presence of a thicker sediment cover and the lack of relict chimney structures. Shinkai and the New Mounds have average slope gradients (height/radius) of about 0.5 with average slope angles of 27 ± 3°. In contrast, Southern, Double and Rona mounds have average slope gra- dients of about 0.34–0.39, with average slope angles of 20 ± 1°, re- spectively (Table 2). Although there is some uncertainty ( ± 10%) in these slopes due to asymmetry of the mounds and the true extent of the edge of the sulphide apron, the differences are consistent with the re- lative age of the mounds, described above.
The MIR Zone lies in the south-east corner of the TAG hydrothermal field, on an elevated block formed by a west-facing fault that runs for over a kilometre in a N–S direction (Fig. 2E). It comprises a (450 m × 300 m), oval-shaped zone of inactive sulphides and relict chimneys, and the constructive feature is smaller than previously thought (Rona et al., 1993b). Small mound-like features are arranged around the circumference of the MIR Zone that is incised by slump structures and scours on both the SE and NW sides where mass-wasted blocks and rubble appear to have flowed down-slope.
4.3 Surface geology of the eSMS mounds
Five of the eSMS mounds (Shinkai, the New Mounds, Southern and Rona) were surveyed by the RUV HyBIS in detail, and the geological map produced for Southern Mound is the most comprehensive (Fig. 5).
The majority of Southern and Rona mounds are covered by thin pelagic sediment. NE–SW trending, conjugate inward dipping and arcuate, low Fig. 4.Bathymetric profiles for the three main eSMS mounds in the study area (drawn without vertical exaggeration). Note the steep and rougher slopes of the Shinkai Mound compared with Rona Mound.
Table 2
Geometry of the eSMS mounds in the TAG hydrothermal field, the older mounds have the lower slopes.
Aspect Ratios Shinkai New Mound #2 Southern Double Rona
height (m) 65 30 55 35 30
base radius (m) 130 60 160 90 85
slope gradient 0.50 0.50 0.34 0.39 0.35
slope angle (°) 27° 27° 19° 21° 19°
(caption on next page)
angle (20–30°), 5–10 m high fault scarps dissect these older mounds and expose features of the shallow sub-seafloor geology. These exposures show a similar relationship (Fig. 5B,C,E): the transition from pre- dominantly pelagic sediment into a red-brown, oxidised iron-rich se- diment layer overlying poorly sorted sulphide breccia and variably oxidised sulphide sediments. Locally, fault scarps expose intercalated sulphide-rich and sulphide-poor sediment horizons ‘on-lapping’ onto brecciated basalt basement. Two ‘horseshoe’ shaped slump scarps at the southern edge of Southern Mound expose sulphide-rich layers within the interior of the mound. The summits of these older mounds are generally flat, with occasional pockmarks, and covered in pelagic se- diment with patches of manganese crust. The summit areas of Southern and Rona mounds have relict chimneys and metre-sized boulders of sulphide-rich material that are clearly related to past high-temperature hydrothermal venting (Fig. 5D). Elsewhere, on Southern Mound, sili- cified iron-oxide sediment is exposed that, with the presence of bac- terial mats, provides evidence for diffuse water flow from the seafloor.
In contrast to Southern and Rona mounds, both Shinkai and New Mounds have steep slopes making them relatively free of pelagic sedi- ment cover (Fig. 6A), which results in greater exposure of the hydro- thermal sediments, sulphide talus and relict chimney structures (Fig. 6B,C,D). These remnant features are consistent with their pro- posed younger ages, the morphology of the mounds and radiometric dating (Lalou et al., 1990, 1993). Sediment, comprising a mixture dominated by pelagic and some weathered hydrothermal material, is thickest in depressions between these mounds. Large sulphide boulders are a common feature on the flanks of Shinkai Mound and appear to represent mass-wasted, chimney-derived material mixed with weath- ered sulphide-rich sediments (Fig. 6D). In contrast to Southern and Rona mounds, Shinkai Mound and New Mounds are not faulted. Ba- saltic rocks are present at the base of the western flank of Shinkai Mound, and in a small basin, between the flank of the mounds and a basaltic ridge, where sulphide-rich sediments derived from mass wasting on-lap the basaltic basement (Fig. 6E).
4.4. Surface lithologies from the eSMS mounds
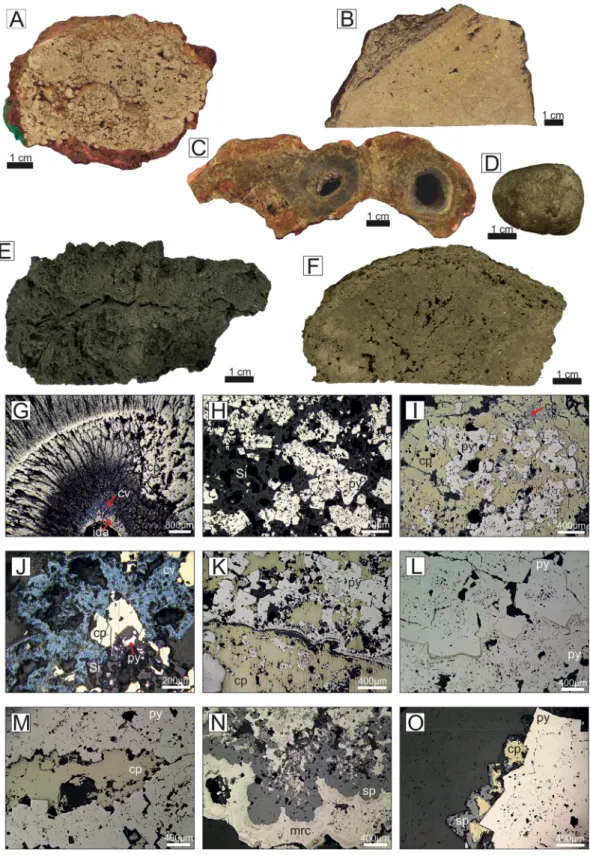
Surface samples from the eSMS mounds comprise both chimney fragments and massive sulphide blocks (Fig. 7A–C). Chimney fragments were only recovered from Shinkai Mound and the New Mounds and include intact fluid conduits lined by marcasite, idaite, covellite with chalcopyrite closer to the outside. Other chimney fragments are com- posed of chalcopyrite with traces of isocubanite, marcasite and pyrite hosted in a matrix of amorphous silica.
At Southern Mound, the surface material includes massive pyrite breccia and layered massive sulphides comprising pyrite and/or mar- casite, chalcopyrite and minor chalcocite. The external surfaces of these samples are coated by a thin FeOOH layer and associated atacamite, jarosite and minerals of the quartz-group or opal, indicating low-tem- perature seawater-related weathering. The interiors comprise mainly porous massive pyrite, with either cubic or coarse-grained subhedral textures with the latter resulting from high-temperature recrystalliza- tion (Fig. 7G). Locally, micro-sized inclusions of sphalerite and/or chalcopyrite occur within massive, porous, colloform and coarse- grained subhedral pyrite (Fig. 7N,O). Sometimes, this pyrite is over- grown by chalcopyrite, that has altered to chalcocite along micro-
fractures, or is surrounded by marcasite (Fig. 7N).
At Rona Mound, surface samples comprise mainly massive sulphide breccia and material from extinct hydrothermal chimneys. These sam- ples contain colloform and recrystallised pyrite, also overgrown by chalcopyrite and with chalcocite replacement along zones of micro- fracturing. Here the matrix of the sulphide breccia consists of quartz with, locally developed, acicular needles of barite.
4.5. Metalliferous sediments
Sediment thickness varies significantly across the TAG hydro- thermal field (Fig. 8). Gravity coring, using a 3 m-long corer, recovered either the full thickness of the sediment column where the basement was intersected, or penetrated sediments in excess of 3.1 m, based on recovery from overshoot by the corer where the basement was not in- tersected. Sediment thickness (Fig. 8A), facies (based on hydrothermal influence) and Cu concentration across the TAG hydrothermal field is shown on maps derived from analyses of the core material (Fig. 8B).
The variation in sediment thickness reflects a combination of topo- graphical and seafloor age variation. For example, on the summits of the eSMS mounds, pelagic and hydrothermal sediment thicknesses range from being largely absent on the summit of Shinkai Mound, to between 1.67 and 2.78 m on top of Southern Mound, reach up to 2.78 m on top of Rona Mound, and between 0.7 and 2.0 m on top of the MIR Zone. This variability correlates with the relative ages of the mounds, as discussed above.
The mineralogy of the sulphide-rich sediments, closest to the base of the mounds, consists mainly of pyrite and chalcopyrite, with sub- ordinate sphalerite and seawater alteration products (e.g. para- tacamite). These sediments contain up to 39 wt.-% Fe, 17.2 wt.-% Cu and 203 ppb Au. In a proximal channel, extending to the south-east of Southern Mound, a thickness of at least 10 m of metalliferous sediment was found exposed in fault scarps several hundred metres from the base of the mound. Here, the sediments comprise alternating centimetre- scale layers of fining-upward, fine-grained FeOOH and sulphide (pyrite and chalcopyrite) sands intercalated with pelagic carbonate ooze en- riched in iron oxides (Fig. 9). These mineralogically and texturally immature sediments indicate rapid deposition as a result of mass wasting of weathered and oxidised hydrothermal chimney materials that are rapidly buried by further sediment deposition. Copper con- centrations in these sediments are relatively high, reaching up to 10 wt.-%. Pelagic carbonate layers indicate pauses in hydrothermal sediment deposition. The dip of layers within some of these cores de- creases from ∼30° at the base to near zero at the top, reflecting local and progressive tilting of the basement, probably in response to NW dipping faults that dissect the channel. Coring and seafloor video sur- veys traced the channel for at least 1 km to the south-east of the eSMS mounds.
In summary, the surface geology reveals a similar structure for a number of eSMS mounds in the TAG hydrothermal field. The tops and flanks of the mounds are composed of unsorted sulphide-talus with iron-oxide sediment, and often largely draped in a veil of pelagic car- bonate ooze. The extent and thickness of the pelagic sediment, the presence of relict hydrothermal structures, and the aspect ratios and slopes of the mounds reflects their relative age. The lower slopes and margins of the mounds are covered by hydrothermal sediments forming Fig. 5.(A) Geological map of Southern Mound and Rona Mound, interpreted from the high-resolution bathymetry, surface samples and video surveys. Note, the white areas are unmapped and trapezoidal-shaped symbol is the viewing direction for the photographs. (B) Slump scarp on the SW side of Southern Mound; coloured lines indicate separation between the pelagic carbonate sediment cover (upper magenta line) and oxidised iron-rich sediments and sulphide rubble (lower yellow line). (C): The western most fault scarp on Southern Mound showing transition from pelagic carbonate to iron-rich sediments (upper magenta line) to underlying sulphide rubble (lower yellow line). (D): blocks of sulphide (dark objects) with yellow coloured jarosite staining on the summit of Southern Mound surrounded by pelagic carbonate sediment. (E): layered sulphide material, deposited by mass-wasting, overlying brecciated basalt at the edge of the flank of Southern Mound (magenta lines delineate boundaries with pelagic carbonate ooze and sulphide-rich sediments and the pink line marks the contact with underlying basaltic breccia.
IMAGES:NATIONAL OCEANOGRAPHY CENTRE.
Fig. 6.(A) Geological map of Shinkai, Mound, New Mound #2 and New Mound #3, interpreted from the surface geology and locations of photographs of features from these mounds. Note, the white areas are unmapped and trapezoidal-shaped symbol is the viewing direction for the photographs. (B) Shows upper section of the
∼15 m high, hydrothermally extinct sulphide ‘spire’ on the summit of Shinkai Mound. (C) Shows a hydrothermally extinct and weathered sulphide chimney on Shinkai Mound. (D) Large sulphide boulders, probably representing chimney material, with atacamite (green) staining, entrained in sulphide-rich oxidised sediment (brown) on the western flank of Shinkai Mound. (E) shows brecciated basalt pillows that may on-lap on to the sediment-draped flank at the base of the Shinkai Mound.IMAGES:NATIONAL OCEANOGRAPHY CENTRE.
Fig. 7.Images and photomicrographs of representative surface and sub-surface sulphide samples from inactive seafloor massive sulphide deposits from the TAG hydrothermal field; A: massive pyrite breccia coated by red-brown FeOOH and green atacamite (JC138-045-5, West of Southern Mound), B: massive sulphide comprised of recrystallised pyrite with intercalated chalcopyrite showing partial brecciation (JC138-021-3, Southern Mound), C: chimney fragment with visible fluid conduits comprising of predominately chalcopyrite and marcasite (JC138-055-2, New Mound #2), D: massive sulphide pebble (JC138-050-14, Southern Mound), E:
porous, sphalerite-bearing silicified massive sulphide (JC138-057-21, Rona Mound), F: massive recrystallised pyrite (JC138-065-23, Rona Mound), G: fluid conduit of chimney fragment comprising of idaite, covellite and chalcopyrite (JC138-055-2, New Mound #2), H: aggregates of pyrite cubes in amorphous silica (JC138-055-6, New Mound #3), I: aggregates of pyrite surrounded by chalcopyrite that has been altered to chalcocite along micro-fractures (JC138-045-7C, Rona Mound), J:
chalcopyrite surrounded by covellite (JC138-055-6, New Mound #3), K: aggregates of pyrite surrounded by chalcopyrite (JC138-073-29, MIR Zone), L: recrystallised pyrite surrounded by massive porous pyrite (JC138-065-23, Rona Mound), M: chalcopyrite layer surrounded by recrystallised pyrite (JC138-050-14, Southern Mound), N: colloform sphalerite rimmed by marcasite (JC138-057-21, Rona Mound), O: massive pyrite overgrown by chalcopyrite that is surrounded by sphalerite (JC138-068-3).IMAGES:NATIONAL OCEANOGRAPHY CENTRE.
upwards-fining layers of sulphide sands and iron oxides. Some of these are intercalated with pelagic carbonates indicating pauses in hydro- thermal sediment deposition. The presence of inward dipping, arcuate faults appears to be a common feature and also correlates with in- creasing age and size of the mounds, with the oldest and largest having the most prominent fault structures. Exposure of the interior of the mounds is limited to these fault scarps and reveals a sequence of pelagic sediment overlying metalliferous turbidite sediments that in turn overly massive sulphide breccia that on-laps a basaltic basement of pillow lavas.
4.6. Drilling results
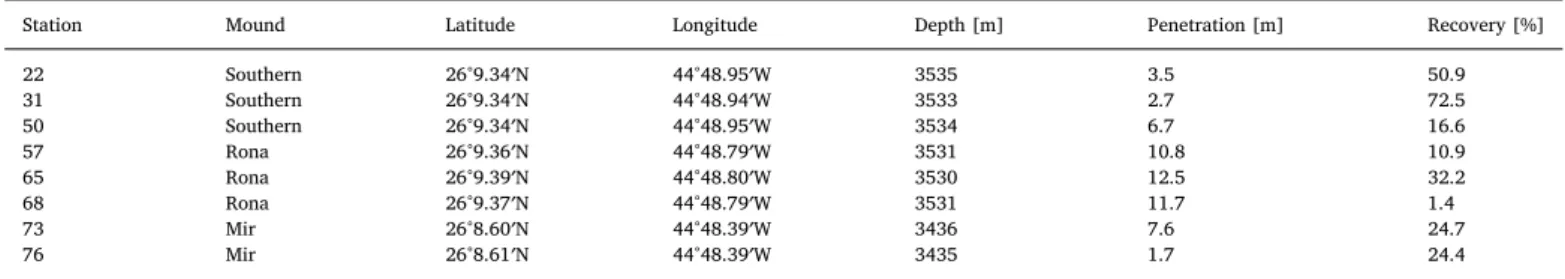
A total of eight holes were drilled on the top of the eSMS deposits at Southern, Rona and MIR (Fig. 2C–E), yielding a total core recovery of 9.51 m, with an average recovery of 29.2%, and a maximum penetra- tion of 12.5 mbsf (Table 3). A general down-hole stratigraphy is shown in Fig. 10, with depths of lithologies reconstructed by correlating re- covered core with drilling telemetry (e.g., weight on bit, torque, rota- tion speed and penetration rate). Geochemical compositions are re- ported for averages of quarter core sections, and discrete facies, up to 0.25 m long. A common lithological sequence was observed at all three eSMS mounds including: a layer of pelagic and metalliferous sediment overlying a layer of dense jasper, several metres thick, that transitions downwards into massive brecciated sulphide dominated by pyrite with chalcopyrite overgrowths and veins.
4.6.1. Southern Mound
At the summit of Southern Mound, core was obtained from three drill holes (stations 022, 031 and 050) (Fig. 10A). The uppermost layer comprises pelagic carbonate sediment, up to 20 cm thick, underlain by 2.5–3.5 m of orange-brown to reddish coloured, soft and
unconsolidated hydrothermal sediment with oxidised, relict chimney fragments, confirming observations and samples obtained by the RUV HyBIS. This material mainly comprises iron-rich clays and rare, centi- metre-thick, blackish MnOOH layers, e.g., at 1.8 mbsf. Beneath the iron- rich sediments, a layer up to 3.1 m thick of jasper (silica-rich iron stained material) occurs. This merges downwards into an intercalated, 0.6 m-thick layer of brecciated jasper at around 5.40–5.85 mbsf. The jasper is quite heterogeneous in appearance, showing a range of colours from orange (upper layers –Fig. 11A-B), to dark red (main portion – Fig. 11C-D), to mottled red–orange and grey (e.g. near the base – Fig. 11E), and it has variable porosity of 5–20%, measured from thin sections. The upper-most portion of the jasper layer has vuggy and sponge-like texture (Fig. 11G) and contains trace quantities of dis- seminated pyrite that become increasingly massive with depth (Fig. 11I). The main minerals in the red jasper and jasper breccia are quartz (∼55–90%) and hematite (∼5–40%), whereas the more massive orange coloured jasper is typically composed of opal-CT, quartz, and goethite, with minor hematite. The lower-most parts of the jasper layer are composed of silicified breccia containing disseminated pyrite and rare grains of chalcopyrite (Fig. 11F,K, L). Massive sulphide was en- countered at the bottom of the hole (6.7 mbsf) and consists of colloidal pyrite surrounded by recrystallised pyrite that is locally surrounded by traces of chalcopyrite (Fig. 7D,M).
4.6.2. Rona Mound
At the summit of Rona Mound, cores were obtained from three drill holes (stations 057, 065, 068 (Fig. 10B). Although the unconsolidated pelagic and hydrothermal sediments observed from the RUV HyBIS images were not recovered, drill telemetry data (rapid penetration rate and low torque) suggest these are about 2.80 m thick. RUV HyBIS ob- servations indicate they are composed of ∼ 30 cm pelagic ooze over- lying 2.5 m of iron-rich sediment. Beneath this, a layer up to 2.5 m thick Fig. 8.Maps showing: (A) the thickness of sediments recovered by coring and their proportion of hydrothermal influence. The sediment thickness is annotated, with the pink column being the minimum measured by the corer (where the bottom of the core terminated in sediment) and the blue being the full thickness as measured by the corer where the entire sediment column was penetrated. The light green areas depict the location of the SMS sites. (B) Sediment types, with hydrothermal materials identified by their high Fe content and reddish colour and background pelagic being carbonate ooze. Based on stratigraphic logs, the percentage of core length with hydrothermal influence has been calculated as 100*(hydrothermal influenced sediment/full length) and is represented by the pie charts for each station.
of dark red, massive textured jasper was encountered, similar to that found at Southern Mound, but with a lower total porosity of 5%. The predominant minerals in the jasper are cristobalite/tridymite (∼80–90%), with subordinate hematite (∼5–10%) and the deepest part of the jasper contains patches of intermixed goethite and haematite with traces of pyrite. This transitions into a zone of mixed red and or- ange-jasper-silica breccia that consists of cristobalite/tridymite with minor hematite, goethite, disseminated pyrite and (rare) sphalerite.
Beneath this transitional zone, brecciated massive sulphide was en- countered down to a depth of 12.5 mbsf. The upper (6–9 mbsf) part is composed of porous (5–15%) and silicified marcasite with minor pyrite, sphalerite and traces of barite (Fig. 7N). The sulphides have a brownish, colloidal core of coliform pyrite with overgrowths of marcasite and sphalerite. The lower (9–12.5 mbsf) part is composed of massive col- loidal textured pyrite, frequently surrounded by recrystallised pyrite that, in turn, is surrounded by chalcopyrite overgrown by sphalerite (Fig. 7L,O).
4.6.3. MIR Zone
At the MIR Zone, two holes were drilled (stations 073, 076) on a small platform on the inner north-eastern side of the deposit (Fig. 10C).
Pelagic sediments, with a thickness of 18 cm, are underlain by hydro- thermal iron-rich sediments extending down to a depth of 70 cm, overlying a ∼10 cm thick layer of FeOOH. This is underlain by a 2.8 m thick zone of jasper, similar to that encountered at Southern and Rona mounds. Here, the jasper ranges from red to orange and has a mean porosity of 15–5%. The red jasper consists of quartz (∼55–85%) and hematite (∼5–35%), with traces of pyrite. The orange jasper is mi- neralogically distinct, containing quartz (∼60–70%), hematite (∼5–15%) and FeOOH (∼10%) but no sulphides. At about 3.6 mbsf, slightly porous massive sulphide breccia is present, dominated by pyrite with minor chalcopyrite occurring in veins and as overgrowths.
4.7 Metal distribution
Although the three SMS mounds drilled have similar lithostrati- graphy, the metal distribution between the mounds is variable (Fig. 10, Table 4). With the exception of Mn-rich horizons or encrustations, both on the surface and within the sediments, in which Cu concentrations can reach 1.42 wt-%, the Fe-rich sediments from the summits of the three sulphide mounds typically have low concentrations of Cu and Zn (i.e. less than 0.5 wt-%). At Southern Mound, the Fe-rich sediments have a Mn-rich horizon (14.9 wt-%) at 1.8 mbsf. At the MIR Zone, Mn—rich horizons are found at the top (2.47 wt-%) of the Fe-rich se- diments and at its base (3.38 wt-%). The Mn-rich horizon deeper in the sediment profile coincides with a peak in Cu (1 wt-%), which otherwise remains low (< 0.2 wt-%) until encountering the massive sulphide zone. At Southern Mound and MIR Zone, the jasper appears to be barren of metals of economic interest, whereas at Rona Mound, just above the brecciated transition zone, it displays some enrichment in Zn (0.98 wt-%).
At all the eSMS mounds we drilled, the massive sulphide zone has the highest base metal concentrations. For example, at Southern Mound, Cu concentrations increase to 0.98 wt.-% at the base of the hole (6.6 mbsf). At Rona Mound, Cu and Zn concentrations also increase towards the base of the hole, with two peaks in Cu occurring at 8–9 mbsf (5.8 wt.-%) and 12 mbsf (3.2 wt.-%), while Zn concentrations Fig. 9.Mineralogical and geochemical characteristics of a sediment core ob- tained from a channel proximal to Southern mound (core M127/627GC), with analyses from selected horizons. The grey shaded boxes indicate the minerals identified by X-Ray diffraction (Gt, goethite; Py, pyrite; Cpy, chalcopyrite; Hem, hematite; Non, nontronite; Cc, calcite; Hal, halite; Qz, quartz), and the white boxes show the mean element concentrations for the respective number of samples (n).
reach a peak of 8.4 wt.-% between 7.4 and 9 mbsf. At the MIR Zone, Cu concentrations in the massive sulphide increase downwards, reaching 16.1 wt.-% (at 4–4.5 mbsf), and then remain high, but variable, reaching a peak of 20.4 wt.-% at 6.4 mbsf (Fig. 10). Covariation of metals in samples from both the drill core and the surface material is summarized inFig. 12. The manganese-rich horizons are distinguished by having < 1 wt.-% Zn, < 10 wt.-% Si and S, up to 28 wt.-% Cu, and up to 35 wt.-% Fe. The jaspers and silicified jasper breccia have up to 45 wt.-% Si and up to 42 wt.-% Fe, but low S, Cu, and Zn. Surface massive sulphides have low Zn and S concentrations, but some samples contain elevated values of Cu and Fe, with a clear trend indicating a mixture of pyrite and Cu-sulphides (Fig. 12). These sulphides contain the highest concentrations of Cu (up to 42 wt.-%) reflecting both the presence of chalcopyrite and possibly bornite. The sub-seafloor
sulphides are dominated by pyrite with low Zn (one sample has up to 8.6 wt.-%) and low Si concentrations. Some samples contain up to 20 wt.-% Cu, especially those from the greatest depth below seafloor. A single sample has up to 8.6 wt.-% Zn.
4.8. Geophysics – seismic results
To assess the dimension, structure and lithology of the deep interior of the eSMS mounds, coincident geophysical lines were occupied in- cluding active seismic studies. Here, we focus on the result of one of the shorter, 5 km-long (NW-SE) seismic lines shot using GI-guns over both Shinkai and Southern mounds, with reflections and refractions recorded on a number of ocean bottom seismometers placed on and around the mounds (seeFig. 2A for the orientation of the line and locations of the Table 3
Drill sites, locations, penetration and core recovery for each successfully drilled hole.
Station Mound Latitude Longitude Depth [m] Penetration [m] Recovery [%]
22 Southern 26°9.34′N 44°48.95′W 3535 3.5 50.9
31 Southern 26°9.34′N 44°48.94′W 3533 2.7 72.5
50 Southern 26°9.34′N 44°48.95′W 3534 6.7 16.6
57 Rona 26°9.36′N 44°48.79′W 3531 10.8 10.9
65 Rona 26°9.39′N 44°48.80′W 3530 12.5 32.2
68 Rona 26°9.37′N 44°48.79′W 3531 11.7 1.4
73 Mir 26°8.60′N 44°48.39′W 3436 7.6 24.7
76 Mir 26°8.61′N 44°48.39′W 3435 1.7 24.4
Fig. 10.Composite stratigraphy obtained for Southern Mound, Rona Mound, and the MIR Zone from coring and drilling, with downhole geochemical trends for manganese, copper and zinc. Data are from bulk samples with depths reconstructed from drilling data and core recovery (see Methods for details).
OBS’s discussed here).Fig. 13shows examples of processed arrivals (see Methods for details) from record sections from four OBS sensors (OBS- 01, 04, 08, 09) located along the Line 1 (the NW-SE profile line (white dashed-line inFig. 2A). The record sections show similar basement and intracrustal reflections (PbP and PmP), from within the altered upper oceanic crust and from the within the unaltered oceanic crust, respec- tively, which informs us of the geometry and thickness of each layer. In addition, a crustal refraction (Pb) yields information about the velocity of the deeper layers. OBS-04 and OBS-08 (located on the crest of the mounds) have an additional reflection horizon (PeP), which corre- sponds to a P-to-P reflection from immediately beneath the eSMS mounds.
OBS sensors located on top of the mounds reveal a P-wave velocity model, derived using the iterative method to best fit the observed ar- rivals (described in the Methods section above) for the eSMS mounds and their sub-seafloor geometry (Fig. 14and inset detailed panels). The deeper structure was obtained from 10 km-long G-gun profiles. The shallow structure reveals a ∼350 m wide, 150–210 m thick downward narrowing cone, with inward-dipping boundaries between relatively higher and lower velocities that we interpret as corresponding to the
mineralised zone and altered basaltic host, respectively. Our travel-time inversion indicates the average P-wave velocity within the high-velo- city sub-seafloor mineralised zone beneath the mounds is c.
5.0 ± 0.4 km/s. Additional, very shallow PeP arrivals from within that zone (Fig. 13B,C) suggest a potential 2-layer architecture, composed of a higher velocity (4.2–6.6, average 5.4 km/s), 50–100 m thick upper- layer (zone 1) and lower velocity (4–5.5 average, 4.75 km/s), ∼100 m thick deeper root (zone 2). This transitions into a lower velocity (3.65 km/s) material (zone 3), which we interpreted as the host rock.
Outside the eSMS mounds, the crustal structure appears as two distinct layers forming a 2–2.5 km thick section with upper crustal ve- locities of 3.5–4.7 km/s (See refraction Pb,Fig. 13A,C,D) and a lower crustal velocity of 5.7 to 7.2 km/s (Fig. 14). The upper crustal layer thins towards the southeast where it is separated from the lower crustal section by a marked velocity change with the higher velocities (7.0 km/
s) almost emerging at the seafloor.
In summary, the seismic data yield significant details about the geometry of the eSMS mounds and their associated velocity, and hence lithological, structure at depth. Both Southern and Shinkai mounds have a similar high velocity, cone-shaped body that narrows Fig. 11.Selection of core samples (A–F) and Thin section images (G–L) of the jasper material recovered from the inactive seafloor massive sulphide deposits from the TAG hydrothermal field: A and B: partially silicified iron oxyhydroxide dominated jasper (A: JC138-050-3, B: JC138-050-7). C and D: Typical vuggy jasper material (C: JC138-073-6, D: JC138-073-7). E and F: Jasper breccia material (E: JC138-050-11, F: 057RD-057-11). G: Diverse range of textures within silicified iron oxy- hydroxide clasts, including brecciated laminated fragments and dendritic growth textures (TL-PPL, JC138-050-3). H: Filamentous iron oxides within a silicified iron oxyhydroxide fragment (TL-PPL, JC138-050-7). I: Late stage radial opal-CT growth on jasperoidal clasts, small void space between silica with a thin amorphous silica rim (left: TL-PPL, right: RL-XPL, JC138-022-CC). J: Juxtaposition of silicified iron oxide (left) and a mass of filamentous iron oxides (right) with thin silica coatings (TL-PPL, JC138-073-14). K: Late pyrite and sphalerite overgrowing silica globules (left: PL-PPL, right: RL-PPL, JC138-057-11). L: Recrystallised quartz with variable distribution of fine grained iron oxide particles (left: TL-XPL, right: TL-PPL, JC138-050-11). TL = transmitted light, RL = reflected light, PPL = plane polarised light, XPL – cross polarised light, Hae = haematite, Qz = quartz, py = pyrite, sph = sphalerite.IMAGES:NATIONAL OCEANOGRAPHY CENTRE.
downwards, host within a lower velocity surrounding basement.
Shinkai mound has a maximum height of 65 m, a basal radius of 130 m, a maximum depth for zone 1 of 80 mbsf ± 10% and a maximum depth for zone 2 of 220 mbsf ± 10%,. Southern mound has a maximum height of 55 m, a basal radius of 160 m, a maximum depth for zone 1 of 150 mbsf ± 10%, and a maximum depth for zone 2 of 270 mbsf ± 10%. The ratio between mound radius, zone 1 and zone 2 maximum depths for both these examples is ∼0.61 and 1.4–1.7, respectively.
5. Discussion
5.1. Towards a generic model for eSMS deposits at a slow spreading ridge Combining the surface geology information and drill core with the geophysical data from across the TAG hydrothermal field allows us to construct a composite model for the structure of the eSMS mounds (Fig. 15A). The three eSMS mounds have many similarities; they are draped in a veil of pelagic sediment, underlain by 1–3 m of barren, iron- oxide/oxyhydroxide-rich sediments, with intercalated thin layers of manganese oxyhydroxide. The iron-oxide/oxyhydroxide-rich sediments have low base metal content, but appear to be derived from weathering of hydrothermal sulphides from the summits of the mounds (e.g.
chimneys), which have been variably altered through interaction with seawater. Sediments at the base of, and distal from, the mounds are composed of sulphide sands and iron oxides, and often have a fining upwards sequence, typical for turbidite deposits resulting from mass wasting of the eSMS mounds. The preservation of higher Cu contents, and pyrite, chalcopyrite and sphalerite grains indicates that seawater
penetration is restricted in these sediments, possibly due to their rapid burial, lower permeability, and the absence of residual hydrothermal flow. Pelagic layers, intercalated with the metalliferous sediments, re- cord hiatuses in the hydrothermal activity. The Mn-rich horizons on and within the pelagic sediments are likely derived from hydrothermal plume fall-out, while those within the shallow metalliferous sediment sequence, and their elevated copper concentrations, are probably the result of precipitation at a radox front. Tilting of some of the sediments, with dip decreasing up section, indicates syn-depositionary deforma- tion, probably in response to rotation of the basement by faulting in the TAG hydrothermal field. Together, these metalliferous sediments may present a resource potential in their own right, with a mixture of Cu- and Zn-rich material dispersed over an area of several square kilo- metres, and deserve further investigation.
The formation of a ubiquitous and 2.5–3.5 m thick layer of jasper at the top of the eSMS mounds, below the sediments, is unusual and has not previously been reported from hydrothermally active SMS systems.
However, the jasper material has many textural similarities to minor occurrences at modern hydrothermal vent sites, including the fila- mentous and sponge-like micro-textures that are possibly the result of bacterial involvement (Juniper and Fouquet, 1988; Hannington and Jonasson, 1992; Duhig et al., 1992; Little et al., 1999; Hofmann and Farmer, 2000; Trewin and Knoll, 2000). The presence of overgrowths of sulphides in the jasper, often comprising euhedral pyrite and minor chalcopyrite, combined with the change in colour from dark red to a lighter shade of red, with bleached mottled areas towards the base of the layer, associated with a change from hematite to goethite, indicate the infusion of late-stage, chemically reduced, sulphidic fluids. It is Table 4
Mean and minimum–maximum concentrations (weight per cent) of major elements in different lithological units encountered at the three sites drilled during JC138.
All analyses performed at Actlabs, Canada (Instrumental Neutron Activation Analysis (INAA), sodium peroxide fusion with ICP-OES & ICP-MS analyses, total sulphur infrared spectroscopy, and cold vapour flow-injection atomic absorption spectrometry), except sediments from Southern Mound at University of Southampton (ICP- MS and ICP-OES), and Si of jasper at University of Southampton (XRF), as reported in the Methods section of this paper. Abbreviations: n/a: not analysed; < d.l.:
below detection limit.
Ø Depth Cu Fe Zn Mn Ca S Si
mbsf Wt.-% Wt.-% Wt.-% Wt.-% Wt.-% Wt.-% Wt.-%
Mean Mean Mean Mean Mean Mean Mean
Min-Max Min-Max Min-Max Min-Max Min-Max Min-Max Min-Max
Southern Mound
Carbonate ooze 0.00–0.16 n/a n/a n/a n/a n/a n/a n/a
Hydrothermal sediment 0.16–2.70 0.03 38.57 0.06 1.74 0.29 n/a n/a n = 18
0.01–0.12 23.68–52.69 0.03–0.13 0.07–14.90 0.08–1.18 n/a n/a
Jasper 2.70–5.41 0.01 11.76 0.03 0.01 0.08 0.07 36.92 n = 6
0.003–0.01 6.16–19.20 0.003–0.06 0.004–0.03 0.03–0.18 0.03–0.13 29.80–43.65
Jasper-silica breccia 5.41–5.95 0.002 3.30 0.07 0.001 0.03 1.59 44.84 n = 1
Jasper 5.95–6.62 0.16 3.70 0.18 0.001 0.05 2.41 44.15 n = 2
0.15–0.18 3.10–4.30 0.003–0.37 n/a n/a 0.84–3.97 43.78–44.52
Massive sulphides 6.62–6.73 0.98 35.00 0.03 < d.l. 0.03 52.00 1.40 n = 1
Rona Mound
Carbonate ooze 0.00–0.21 0.11 7.68 0.05 0.25 25.32 n/a n/a n = 2
0.09–0.14 6.82–8.54 003–0.08 0.19–0.31 24.30–26.38 n/a n/a
Hydrothermal sediment 0.21–2.76 0.54 27.61 0.39 6.65 0.48 n/a n/a n = 3
0.01–1.42 14.69–36.43 0.21–0.71 0.12–19.58 0.15–0.89 n/a n/a
Jasper 2.76–5.46 0.003 6.07 0.32 0.001 0.07 1.32 40.13 n = 3
0.002–0.006 5.00–7.90 0.006–0.94 0.0008–0.001 0.06–0.09 0.11–3.70 38.23–42.03
Jasper-silica breccia 5.46–6.02 0.004 12.32 0.53 0.005 0.02 n/a 38.45 n = 1
Massive sulphides 6.02–12.49 1.36 37.36 0.85 < d.l. 0.05 52.38 0.30 n = 12
0.18–5.83 30.10–41.10 0.05–8.41 n/a 0.02–0.07 47.20–54.90 0.11–0.81
MIR Zone
Carbonate ooze 0.00–0.18 0.12 3.81 0.04 0.26 31.20 0.14 2.60 n = 1
Hydrothermal sediment 0.18–0.73 0.18 32.50 0.31 0.95 0.63 9.69 0.19 n = 3
0.12–0.30 30.90–33.40 0.24–0.35 0.12–2.47 0.34–0.79 5.38–12.20 0.16–0.22
Iron-oxyhydroxide crust 0.73–0.85 0.31 35.60 0.25 1.76 0.29 3.13 7.55 n = 2
0.10–0.51 26.90–44.30 0.07–0.42 0.15–3.38 0.22–0.35 0.11–6.15 0.10–15.00
Jasper 0.85–3.62 0.01 9.00 0.01 0.004 0.08 0.06 39.74 n = 8
0.0007–0.01 2.80–13.90 0.004–0.04 0.001–0.007 0.03–0.14 0.02–0.20 35.40–44.18
Massive sulphides 3.62–7.62 9.46 38.25 0.03 < d.l. 0.02 49.58 0.29 n = 4
0.09–20.40 33.90–41.30 0.02–0.04 n/a n/a 43.10–55.70 0.27–0.31
thought that jasper formation is a result of silica precipitation from low- temperature, diffuse hydrothermal venting that has resulted in silicifi- cation of pre-existing iron-rich sediments (Alt, 1988; Stoffers et al., 1993). This implies that the formation of the thick jasper layers at the TAG eSMS sites is a result of late stage, low-temperature, hydrothermal fluid flow, focused on the summits of the waning hydrothermal systems.
The thickness and relative impermeability of the jasper layer is also significant. The rapid transition into fresh, unoxidised pyrite and chalcopyrite (and copper-rich) massive sulphides immediately below the jasper layer suggests it acts as an impermeable barrier to the ingress of seawater. The jasper layer bears some resemblance to occurrences of silica encountered below the active TAG mound, in stockwork breccia at depth (Fig. 15B;Humphris et al., 1995). It is also similar to the si- liceous layer found above a copper-rich zone, deep within the sediment- hosted Bent Hill deposit (Fig. 15C;Zierenberg et al., 1998). The IRINA II Mound at the ultramafic-hosted Logatchev vent site (Fig. 15D) also has a silicified sulphide breccia cap, although the interior of the deposit is heterogeneous with sulphide formation restricted to the immediate vicinity of the active vent sites and the majority of the mound’s interior
being composed of altered, chloritised and serpentinised ultramafic lithologies (Augustin, 2007; Petersen et al., 2009). Similar jasper ma- terials are found elsewhere, in the geological record. For example, in the Iberian Pyrite Belt they are considered vectors to massive sulphide ore deposits, especially when the jasper is altered into grey chert con- taining pyrite and chlorite, which grow at the expense of hematite, attesting to the contribution of reduced fluids at elevated temperatures (Barriga and Kerrich, 1984; Barriga and Fyfe, 1988; Carvalho et al., 1999).
At Southern and Rona mounds, the japers transition in to a weakly mineralised zone of silicified breccia. The brecciation is interpreted to result from volume reduction and collapse, possibly related to anhy- drite dissolution at depth. Below the breccia, the deposits are composed of low-porosity, massive sulphide with little or no gangue material. The upper 3–6 m of the massive sulphides contains minor amounts of barite, indicating interaction with seawater at temperatures up to ∼250 °C (Jamieson et al., 2016). At Rona mound, a shallower zinc-rich zone also occurs (at 7.4–9 mbsf). Copper concentrations generally increase with depth where primary pyrite is overgrown, and cut by, chalcopyrite Fig. 12.Co-variation diagrams for major elements of surface and subsurface sulphides, crust and jasper samples from the Blue Mining project: A: S-Si plot showing that majority of sulphides and crusts are poor in silica whereas the jasper is silica-rich, B: Fe-Si plot showing that subsurface sulphides have the highest iron concentration, while surface sulphides are more heterogeneous, C: Fe-S plot illustrating that majority of sulphides comprise of pyrite, D: Cu-S plot showing that only a few samples are enriched in copper minerals, E: Zn-S plot illustrating that majority of samples from the Blue Mining project are zinc poor, F: Cu-Fe plot showing that few samples are comprised of chalcopyrite.