Geophysical Journal International
Geophys. J. Int.(2017)208,449–467 doi: 10.1093/gji/ggw403
Advance Access publication 2016 October 26 GJI Geodynamics and tectonics
The Mozambique Ridge: a document of massive multistage magmatism
Maximilian D. Fischer,
1Gabriele Uenzelmann-Neben,
1Guillaume Jacques
2,3and Reinhard Werner
21Alfred-Wegener-Institut Helmholtz-Zentrum f¨ur Polar- und Meeresforschung, Am Alten Hafen26, D-27568Bremerhaven, Germany. E-mail:Maximilian.Fischer@awi.de
2GEOMAR Helmholtz-Zentrum f¨ur Ozeanforschung, Wischhofstr.1–3, D-24148Kiel, Germany
3Bundesanstalt f¨ur Geowissenschaften und Rohstoffe, Stilleweg2, D-30655Hannover, Germany
Accepted 2016 October 25. Received 2016 October 11; in original form 2016 July 29
S U M M A R Y
The Mozambique Ridge, a prominent basement high in the southwestern Indian Ocean, consists of four major geomorphological segments associated with numerous phases of volcanic activity in the Lower Cretaceous. The nature and origin of the Mozambique Ridge have been intensely debated with one hypothesis suggesting a Large Igneous Province origin. High-resolution seismic reflection data reveal a large number of extrusion centres with a random distribution throughout the southern Mozambique Ridge and the nearby Transkei Rise. Intrabasement reflections emerge from the extrusion centres and are interpreted to represent massive lava flow sequences. Such lava flow sequences are characteristic of eruptions leading to the formation of continental and oceanic flood basalt provinces, hence supporting a Large Igneous Province origin of the Mozambique Ridge. We observe evidence for widespread post-sedimentary magmatic activity that we correlate with a southward propagation of the East African Rift System. Based on our volumetric analysis of the southern Mozambique Ridge we infer a rapid sequential emplacement between∼131 and∼125 Ma, which is similar to the short formation periods of other Large Igneous Provinces like the Agulhas Plateau.
Key words: Submarine tectonics and volcanism; Large igneous provinces; Neotectonics;
Africa; Indian Ocean.
1 I N T R O D U C T I O N
For several decades Large Igneous Provinces (LIPs) have been of great interest because of their immense sizes and potential far- reaching impact on biosphere and atmosphere leading to climate shifts and mass extinctions (Wignall2001), their role in plate motion by thickening of oceanic crust (Miuraet al.2004), and their asso- ciation with continental breakup and supercontinent cycles (Bryan
& Ernst2008; Bryan & Ferrari2013). The term LIP was initially proposed by Coffin & Eldholm (1991) and is used for large (>0.1× 10⁶km2) marine and terrestrial areas overprinted by massive vol- canic activity (Coffin & Eldholm1994; Bryan & Ernst2008; Kerr 2014). Episodes of excessive magmatism have repeatedly formed LIPs on Earth by eruptions from a system of fissures or vents (Uenzelmann-Neben2013). Three proposed models to explain these massive outpourings of magma are the impact of a rising plume head at the base of the lithosphere, edge-driven convection, or litho- spheric delamination (Coffin & Eldholm1994; White & McKen- zie1995; Saunders 2005; Campbell2007). In Cretaceous times, an increase in development of LIPs occurred globally, for exam- ple, Manihiki Plateau in the Pacific Ocean and Rio Grande Rise in the Atlantic Ocean (Coffin & Eldholm 1994). In the Indian
Ocean emplacement of several structures such as the Kerguelen Plateau (Freyet al.2000) and the Agulhas Plateau (Parsieglaet al.
2008) are associated with massive volcanic events and classified as LIPs.
The Mozambique Ridge (MozR) is located in the southwestern Indian Ocean (Fig.1), an area where Gondwana breakup between Africa, South America and Antarctica occurred during the Creta- ceous. The areal extent (∼2×10⁵km2) of the elongated aseismic ridge is nearly twice the size of Iceland. The MozR is limited to the east by an abrupt, more than 2000 m deep step-down into the Mozambique Basin (dashed line in Fig.1), which owes its exis- tence to the NNE–SSW striking Andrew Bain fracture zone (Ben- Avrahamet al.1995; Sclateret al.2005). To the north, the MozR is bound by the Northern Natal Valley, to the west by the Southern Natal Valley and to the south by the Transkei Basin and Transkei Rise (Fig.1). Geomorphologically it is divided into four segments, termed here as northern MozR (nMozR), central MozR (cMozR), southwestern MozR (swMozR) and southeastern MozR (seMozR).
Together the latter three form the southern MozR (Fig.1). The first samples from the basement of the MozR were collected at DSDP Leg 25 Site 249 on the nMozR, where 3.1 m of tholeiitic basalt was recovered (Simpsonet al.1974).
CThe Authors 2016. Published by Oxford University Press on behalf of The Royal Astronomical Society. 449
31˚
31˚
32˚
32˚
33˚
33˚
34˚
34˚
35˚
35˚
36˚
36˚
37˚
37˚
−36˚ −36˚
−35˚ −35˚
−34˚ −34˚
−33˚ −33˚
−32˚ −32˚
−31˚ −31˚
−30˚ −30˚
1
2
3 4
−5500
−5500
−5000
−5000
−4500
−4500
−4000
−4500
−4000
−4000
−3500
−3500
−3500
−3500
−3500
−3000
−3000
−3000
−3000
−3000
−3000
−3000
−2500
−2500
−2500
−2500
−2500
−2500
−2500
−2500
−2500
−2000
−2000
−2000
−2000
−2000
−2000
−2000
−1500
−1500
−1500
DSDP Leg 25 Site 249 Durban
−8000 −4000 0
Depth in [m]
Fig. 4 Fig. 6
Fig. 3 Fig. 2
8 .giF
Fig. 7c
Fig. 7b Fig. 7a
Transkei Rise Southern Natal V
alley
Transkei Basin
Mozambique B asin Andrew Bain
Fracture Zon e
Figure 1.Bathymetric map (GEBCO 08; 500 m contour lines in black) of the study area in the southwestern Indian Ocean with location of DSDP Leg 25 Site 249 (star) and Durban, South Africa (pentagon). MCS profiles of SO 232 are shown in grey, those of SO 182 in black and purple. Seismic refraction profile interpreted by Gohlet al. (2011) is coincident with NNE-SSW striking MCS profile AWI-20050018 of SO 182 depicted in purple (Gohlet al.2011;
Uenzelmann-Nebenet al.2011). White numbers depict the segments of the Mozambique Ridge: 1=northern Mozambique Ridge, 2=central Mozambique Ridge, 3=southwestern Mozambique Ridge, 4=southeastern Mozambique Ridge. Red bars (black outline) indicate the locations and lateral extent of presented seismic data. White outlines are used if the respective figures represent an extract of shown seismic data. The insert shows the location of the study area off South Africa (red rectangle) and the major rift features of the East African Rift System (after Tikkuet al.2002; Chorowicz2005; Macgregor2015).
Authors have proposed several hypotheses about the nature and origin of the MozR, ranging from a continental provenance (Tucholkeet al.1981; Raillard1990; Mougenotet al.1991; Hart- nadyet al.1992), to an oceanic origin (Hales & Nation1973; K¨onig
& Jokat2010), to being partitioned into continental and oceanic parts (Ben-Avrahamet al.1995). Seismic refraction and reflection data collected across the swMozR are interpreted as strong evidence for an oceanic LIP origin of the southern MozR (parallel to the pur- ple line in Fig.1; Gohlet al.2011). A LIP origin of the whole MozR could have had an immense influence on climate during the Early Cretaceous with the emission of gases and heat into atmosphere and ocean and in addition implications on the development of the South African gateway with the formation of obstacles for surface and deep circulation.
The main objective of this paper is to resolve the structure and evolution of the MozR by focusing on the questions of forma- tion and magmatism using seismic reflection data. This will pro- vide parameters required for future studies about the reconstruc- tion of the paleo-ocean current circulation and its implications for climate.
2 G E O L O G I C A L A N D T E C T O N I C B A C KG R O U N D
The origin of the MozR is still unclear. In general, three totally different theories have been proposed to explain its development history. Tucholkeet al.(1981) suggested a continental provenance of the MozR based on a comparison of 1-D seismic refraction data from Hales & Nation (1973) and Chetty & Green (1977) with seis- mic refraction data from the Agulhas Plateau that was interpreted to be a continental fragment of South Africa. Dredge samples pre- sented by Raillard (1990), Mougenotet al.(1991), and Hartnady et al. (1992) supported a continental origin of the MozR. Ben- Avrahamet al.(1995) favoured a partitioning of the MozR into a northern oceanic and a southern continental part. They suggested a microcontinental fragment embedded into oceanic crust at the southern MozR based on low-resolution seismic refraction data of Hales & Nation (1973) and Raillard (1990), gravity data (Doucour´e
& Bergh1992; Lyakhovskyet al.1994), and rock samples (Raillard 1990; Mougenotet al.1991; Hartnadyet al.1992; Ben-Avraham et al.1995).
Based on the interpretation of gravity anomaly data and a recent magnetic survey, K¨onig & Jokat (2010) contradicted this model by excluding the presence of large continental blocks throughout the MozR. According to their observations, high amplitude magnetic anomalies at the major structural boundaries suggest that the dif- ferent segments of the ridge were formed at different times. They described the MozR as the result of long lasting volcanic activity between 140 Ma (magnetic anomaly∼M15n) and 122 Ma (mag- netic anomaly C34n, onset of Cretaceous Normal Superchron) and proposed an oceanic origin for the whole ridge. The findings of Erlank & Reid (1974), Simpsonet al.(1974), and Thompsonet al.
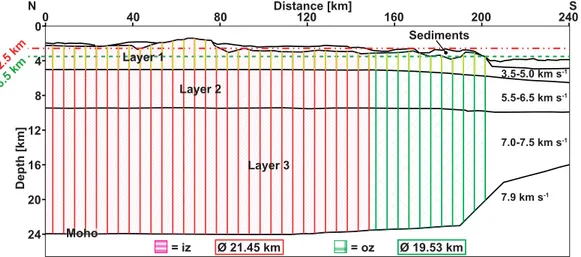
(1982), who dated the basaltic basement at Site 249 (location see Fig.1) as Early Cretaceous, support the postulated timeframe of emplacement. A more than 22 km thick crust was identified for the MozR during a 1-D seismic refraction study (Hales & Nation 1973; Chetty & Green1977). Chetty & Green (1977) concluded that the over-thickened crust lacks characteristic velocities of the conti- nental basement and therefore a basement of continental crust was not strongly supported. The interpretation of 2-D seismic refrac- tion data showed that the MozR is characterized by over-thickened (16–22 km), seismically homogeneous, lower crustal units making up between half to two-thirds of the crustal column withP-wave velocities of more than 7.0 km s−1(Gohlet al.2011). According to them these velocities suggest that large volumes of mantle-derived material accreted in the lower crust and indicate a formation of MozR and Agulhas Plateau at the same magmatic province (Gohl
& Uenzelmann-Neben 2001; Parsieglaet al.2008). As a conse- quence of their studies Gohlet al.(2011) proposed a LIP origin of the MozR and speculated on the existence of a Southeast African LIP consisting of the MozR, the Agulhas Plateau and other frag- ments. Preliminary petrological-geochemical results of the basaltic rock samples dredged during SO 232 favour a deep-plume source and support a LIP origin of the MozR (Uenzelmann-Neben2014;
Jacqueset al.2015).
3 D AT A A N D M E T H O D S 3.1 Seismic reflection data
This study is based on 24 high-resolution MCS reflection profiles with a total length of about 4600 km acquired by the Alfred Wegener Institute, Helmholtz Centre for Polar and Marine Research on board RVSonneduring expeditions SO 182 in 2005 (black and purple lines in Fig. 1) and SO 232 in 2014 (grey lines in Fig.1). The seismic profiles cover the cMozR, the swMozR, and the seMozR of the MozR, as well as the transition zone to the adjacent basins (Fig. 1). A cluster of four GI-guns were triggered at a nominal interval of 25 m (shot interval of 10 s), generating seismic signals of up to 500 Hz with dominant frequencies between 20 and 55 Hz.
Each GI-gun produces a primary pulse (Generator) with a volume of 0.72 litres, which is followed by a delayed (33 ms) secondary signal (Injector volume 1.68 l) to suppress the bubble effect. The data were received by a 240-channel hydrophone array with a total active length of 3000 m. Navigation data were specified by GPS.
Pre-stack processing of the multichannel seismic data included geometry definition using the ship’s navigation data, and common depth point (CDP) sorting with a CDP spacing of 25 m. A de- tailed velocity analysis (every 50 CDP) was carried out and used for normal moveout correction. Where needed, the interval for the velocity analysis was decreased (e.g. for complex, small scale fea- tures). Stacking was carried out using a mean iterative algorithm
together with spherical divergence correction and was followed by an Omega-X finite-difference migration (Yilmaz2001). This mi- gration method is very useful for the imaging of strongly inclined reflectors as caused by, for example, volcanic structures or tectonic processes. Since seismic amplitude information was used for the interpretation we avoided AGC (Automatic Gain Control) filtering so that amplitudes depicted in the profiles represent values relative to the maximum of the entire section. For better visualization of the seismic data, band pass filtering with tapering (Hanning window;
boundaries 5–30 Hz and 200–250 Hz) and a water column mute were applied.
3.2 DSDP data
Site 249 was drilled during DSDP Leg 25 and recovered a thin seg- ment of basaltic basement (3.1 m) from a depth of 408 meters below seafloor (mbsf). Due to severe weathering of the rock samples no radiometric age dating was possible, but major and trace element analysis showed compositional similarities with mid-ocean ridge tholeiites (Erlank & Reid1974). Based on the age of the overly- ing sediments, Simpsonet al.(1974) inferred an Early Neocomian age of the tholeiitic basalt. Three lithological units were identi- fied by means of lithological and biostratigraphic characteristics (Simpsonet al.1974). Those units are separated by two prominent hiatuses: a Campanian to Cenomanian unconformity (287 mbsf) representing∼25 Myr and a Middle Miocene to Maastrichtian un- conformity (172 mbsf) representing∼50 Myr. Sedimentation rates of 5 m Myr−1and 20 m Myr−1were determined for the Neocomian to Early Cenomanian and the Late Campanian to Maastrichtian, respectively, and a sedimentation rate of about 19 m Myr−1was cal- culated for the Miocene (Simpsonet al.1974). No direct correlation of the DSDP data to our seismic reflection data was possible since our profiles did not cross Site 249 located on the nMozR (Fig.1).
Nonetheless, the drilling results provide general information on the nature of unconformities observed in the sedimentary column and, in the absence of a more direct possibility of dating, thus were used to constrain our seismic stratigraphy.
4 R E S U L T S 4.1 Seismic stratigraphy
Three seismic units (basement, S1 and S2) were identified within the study area with the interfaces between the units representing distinct changes in seismic reflection characteristics (seismic stratigraphy;
Vailet al.1977; Cross & Lessenger1988). Based on their reflec- tion characteristics (e.g. frequency, amplitude and continuity) the seismic units were correlated with the lithological results of DSDP Leg 25 Site 249 (Simpsonet al.1974) and the seismic units de- fined by Uenzelmann-Nebenet al.(2011) to obtain a timeframe for their deposition. For the location of the MCS profile used by Uenzelmann-Nebenet al.(2011) please refer to Fig.1(purple line crossing the swMozR). We present an overview of the seismic units and the correlations in Fig.2and Table1.
4.1.1 Basement
The lowermost unit shows high amplitude, low frequency reflections (e.g. Fig.2CDPs 10200–10600). Intrabasement reflections can be deep reaching (e.g. up to 500 ms TWT in Fig. 2 CDPs 9000–
9400). The intrabasement reflections are strongest and appear most
11000 10600 10200 9800 9400 9000 8600 8200
2.50 2.50
3.00 3.00
3.50 3.50
4.00 4.00
4.50 4.50
5.00 5.00
5.50 5.50
6.00 6.00
TWT [s] TWT [s]
NW Profile AWI-20140217 SE
~ 3.3 km
20 km
Basement S1
S1
S2a
S2a
S2b
S2b
V.E. ~ 28 1.8º PSM
11000 10600 10200 9800 9400 9000 8600 8200
2.50 2.50
3.00 3.00
3.50 3.50
4.00 4.00
4.50 4.50
5.00 5.00
5.50 5.50
6.00 6.00
TWT [s] TWT [s]
NW SE
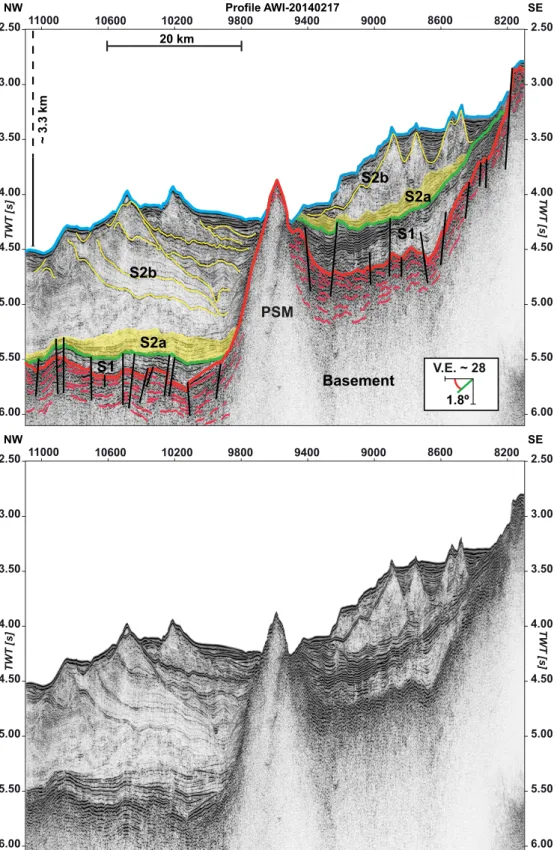
Figure 2.Seismic stratigraphy of the study area together with the uninterpreted section. Location of profile is shown in Fig.1. For a detailed description of the units, refer to Section 4.1 and Table1. Thick blue line=seafloor, thin yellow lines=discontinuities within subunit S2b, the yellow shaded area=subunit S2a, thick green line=top of unit S1, thick red line=top of basement, thin red lines=intrabasement reflections, black lines=faults. PSM=post-sedimentary magmatic structure. For slope angles and vertical exaggeration, refer to the legend.
continuous near the top of the unit and become increasingly weaker and less continuous with depth due to scattering and attenuation of the seismic signal. Individual reflections can typically be traced for 5–15 km. The intrabasement reflections dip away from local
highs and form subparallel sequences that in places overlap (e.g.
Figs3CDPs 4000–4200 and 4CDPs 1800–2200). The unit’s top (red horizon in all shown MCS profiles) is defined by a strong impedance contrast with a sudden velocity increase to its overlying
Table1.Seismicstratigraphyofthestudyarea. Seismicunitsofthe MozambiqueRidgeThickness (msTWT)Estimatedage (Ma)a,cMaterialaSeismiccharacteristics
Correlationwith publishedseismic stratigraphiesa,bRemarks UnitS2 (S2a&S2b)0-1600S2b:15-0a S2a:75-68aS2b:nannoooze S2a:clay-richnannochalkS2a:sporadicallysubhorizontalstrong amplitudereflectionsoflowerfrequencyinthe uppermostpart;mostlycontinuousinternal reflectionswithweaktomoderateamplitudes andlowtomediumfrequency;occasionally strongamplitudereflections;discontinuities. S2b:discontinuousmediumtohighamplitude reflectionbandoflowerfrequency
UnitsI&IIa; UnitS2bHiatusontopof S2a;S2acanonly partlybe distinguished fromS2b UnitS10-500<128.66-100a,cSiltyclaystoneand volcaniclastics,claycontent increasestowardsthebase
Mediumtostrongamplitudereflections(upper part);weakeramplitudereflections(lowerpart); lowtomediumfrequencyreflections;less continuousreflectionsinlowerpart
SubunitIIIAa; UnitS1bHiatusontopof S1;ageofoldest depositsdecrease totheSdueto youngerbasement Basement130.11-124.55c dependingon respective segmentofMozR
BasaltStrongimpedancecontrastattop;high amplitude,lowfrequencyreflections;subparallel sequencesofinternalreflections;piecewise continuousandupto800msTWTdeep Basementa,b aSimpsonetal.(1974). bUenzelmann-Nebenetal.(2011). cThisstudy.
unit, appears rugged and hummocky, and shows a wide range in observed depths (Fig.5a). Our observations match those described for the magmatic basement of the MozR by Simpsonet al.(1974) and Uenzelmann-Nebenet al.(2011), we thus interpret this unit as magmatic basement. Several faults disrupt the top basement reflection (e.g. Fig. 2CDPs 10200–10600) and basement peaks piercing the sedimentary column appear locally (e.g. Fig.2CDPs 9300–9900).
4.1.2 Seismic units S1 and S2
Two seismic units (S1 and S2) overlie basement. Reflection char- acteristics of the well stratified older unit S1 show low to medium frequency reflections with weaker amplitudes in its lower part and medium to strong amplitude reflections in its upper part. The mostly conformable reflections of the unit are more continuous in the upper part (Fig.2CDPs 8400–9400). The top of unit S1 (green horizon in Fig.2) seems to be affected by erosional truncation and is marked by a strong amplitude reflection. The unit has a thickness of up to 500 ms TWT and drapes the local morphology of the strongly faulted basement (Fig.2CDPs 8200–9500). Towards the surround- ing basins (Natal Valley, Transkei Basin) and towards basement highs, unit S1 thins and in places is missing completely. The re- flection characteristics of our unit S1 are similar to the reflection characteristics of lithological unit IIIA at Site 249 and to those of unit S1 described by Uenzelmann-Nebenet al.(2011). Therefore, we correlate our seismic unit S1 with lithological unit IIIA of Site 249. The recovered deposits of unit IIIA at Site 249 consist of silty claystone and volcanic siltstone of Early Cretaceous (Neocomian to Early Cenomanian) age. The unit’s top reflection (green horizon in Fig.2) is described by Uenzelmann-Nebenet al.(2011) as well and is correlated with the∼25 Myr hiatus (Early Cenomanian to Late Campanian) identified at Site 249 (Simpsonet al.1974).
With a thickness of up to 1600 ms TWT (e.g. Fig.2 CDPs 10200), seismic unit S2 constitutes the largest part of the deposits covering the basement. The top of unit S2 is marked by the light blue horizon in Fig.2. The unit typically thins towards basement highs (e.g. Fig.2CDPs 8200–9000) and can be divided into two subunits (S2a & S2b) based on their reflection characteristics. In the lower part of unit S2 a thin (max. 250 ms TWT) discontinuous medium to high amplitude reflection band of lower frequency can be observed (Fig.2CDPs 8600–9400). The reflections onlap onto unit S1 and we observe a significant difference in reflection amplitude and frequency when comparing it to the more transparent nature of the overlying part of unit S2 (shaded in yellow in Fig.2CDPs 8500–
9400 and 9800–11100). We define this reflection band as subunit S2a. Subunit S2a cannot be observed throughout the study area and usually thins towards basement highs. The thickest successions are observed within the surrounding basins of the MozR or within local depressions.
The Late Cretaceous (Late Campanian to Maastrichtian) litho- logical unit II drilled at Site 249 shows a variable thickness and thins towards the basement highs (Simpsonet al.1974). It is topped by a hiatus (Maastrichtian to Middle Miocene) as the result of erosion (Simpsonet al.1974). The seismic characteristics of lithological unit II resemble the characteristics of subunit S2a. Consequently, we correlate subunit S2a with the Late Campanian to Maastrichtian rocks drilled at Site 249. Uenzelmann-Nebenet al.(2011) sporadi- cally observed lower frequencies and stronger amplitude reflections in the lower 100 m of their seismic unit S2. Even though they could not correlate these reflections with certainty to the data of
Simpsonet al.(1974), they interpreted this lower part to represent lithostratigraphic unit II.
The majority of seismic unit S2 consists of subunit S2b (thick- ness up to 1400 ms TWT), which shows a more transparent nature compared to the subjacent units (Fig.2CDPs 9800–11050). Its am- plitudes are weak to moderate but occasionally strong and feature a low to medium frequency. We observe two groups of reflections characterized by significant differences in their seismic appearance in the uppermost part of unit S2b: a set of weak to moderate ampli- tude reflections of medium frequency, and a series of almost hori- zontal, well-layered strong amplitude reflections of lower frequency (e.g. Fig.2CDPs 8500–8800 and 10100–10600). The undulating, mostly continuous internal reflections of subunit S2b represent dis- continuities (yellow lines in Fig.2) such as erosional truncation and onlap termination (e.g. Fig.2CDPs 10000–10400).
We correlate the significant change in reflection characteristics between S2a and S2b to a distinct change in clay fraction content between lithological unit II (high clay fraction content of up to 60 per cent) and lithostratigraphic unit I (clay fraction content<20 per cent) (Leclaire1974; Simpsonet al.1974). Uenzelmann-Neben et al.(2011) correlated the major part of their seismic unit S2 with lithostratigraphic unit I. We observe a similar thickness proportion of subunit S2b in relation to subunit S2a as Uenzelmann-Neben et al.(2011) described for the lower and upper parts of their seismic unit S2. We hence suggest that subunit S2b consists of the pelagic sediment of mid-Miocene to Holocene age of lithostratigraphic unit I recovered at Site 249.
4.2 Regional basement structure 4.2.1 Central Mozambique Ridge
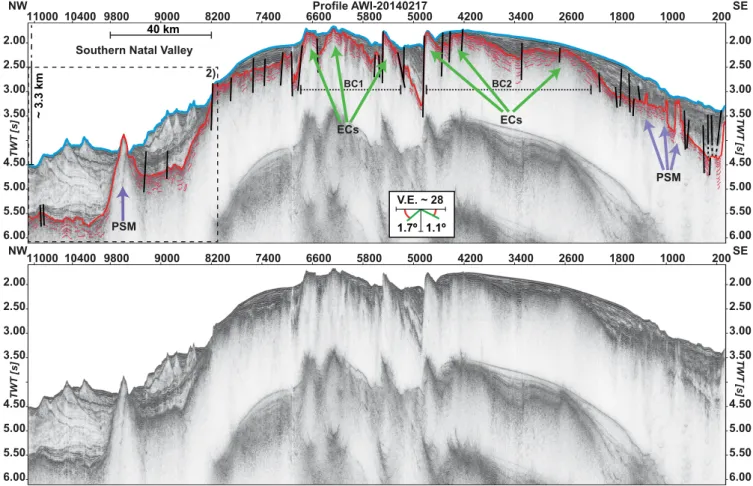
The basement at the cMozR has a rounded morphology (2 in Fig.1) and gentle slopes that show a slight increase in dip to the NW and NE (Figs3and4). A∼15 km wide and 1600 ms TWT high basement peak on the NW flank disrupts the overall symmetry of the cMozR (Fig.3CDPs 9300–9900). The segment is built up of at least three basement complexes (BC1, BC2 and BC3, Figs3,4and 5a). The shallowest area of the top basement reflection identified in seismic reflection data is located in the southern part of BC1 with a depth of 1590 ms TWT below sea level (bsl; south of BC1 in Fig.3;
black dashed ellipse in Figs5a and b). In this part, the cMozR rises up to 3650 ms TWT above the basement in the Natal Valley. We observe only a thin sedimentary cover on top of basement highs (e.g. Figs4CDPs 3400–4200 and5b). The individual basement complexes are separated by depressions (e.g. Fig.4CDPs 4800–
6200). Faults associated with the depressions show offsets of up to 1500 ms TWT (Fig.3CDP 4800). The intrabasement reflections at the cMozR can be identified up to 800 ms TWT deep, and individual reflections are typically traced for 5–15 km. Onlaps of intrabasement reflections onto other intrabasement reflections are observed, for example, between basement complex 2 and a 20 km wide basement high in the northeast of the cMozR (Fig.4CDPs 1800–2200).
4.2.2 Southwestern Mozambique Ridge
The basement at the swMozR (3 in Fig.1) has gentle slopes and a rounded morphology that is slightly elongated to the N (Figs5a and 6). The shallowest area of the top of the basement covered by seis- mic reflection data has a depth of 1920 ms TWT bsl (black dashed ellipse in Figs5a and b; ‘fig. 2 in Uenzelmann-Nebenet al.2011).
11000 10400 9800 9000 8200 7400 6600 5800 5000 4200 3400 2600 1800 1000 200
2.00 2.00
2.50 2.50
3.00 3.00
3.50 3.50
4.50 4.50
5.00 5.00
5.50 5.50
6.00 6.00
2)
V.E. ~ 28 º 7 . 1 1.1º
Profile AWI-20140217 SE
TWT [s]
NW
TWT [s]
Southern Natal Valley
~ 3.3 km
40 km
BC1 BC2
PSM
ECs ECs
PSM
11000 10400 9800 9000 8200 7400 6600 5800 5000 4200 3400 2600 1800 1000 200
2.00 2.00
2.50 2.50
3.00 3.00
3.50 3.50
4.50 4.50
5.00 5.00
5.50 5.50
6.00 6.00
SE
TWT [s]
NW
TWT [s]
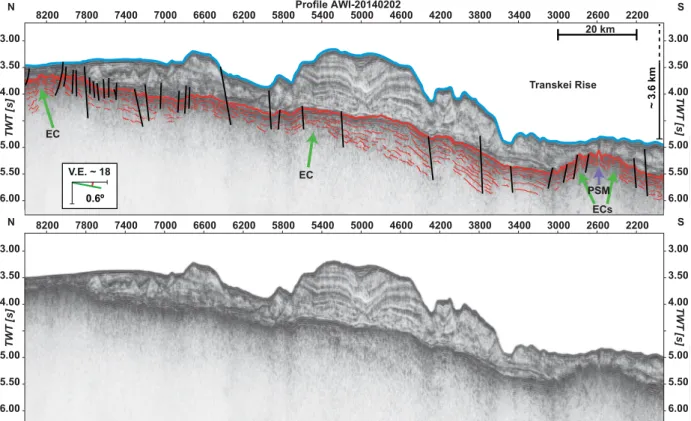
Figure 3.MCS profile AWI-20140217 crossing the central Mozambique Ridge in an NW–SE direction. Location of profile is shown in Fig.1. Dashed frame indicates location of Fig.2. Thick blue line=seafloor, thick red line=top of basement, thin red lines=intrabasement reflections, black lines=faults, green arrows=extrusion centres (ECs), purple arrows=post-sedimentary magmatism (PSM). BC1=Basement complex 1, BC2=Basement complex 2. For slope angles and vertical exaggeration, refer to the legend.
We observe a thinning of the sedimentary cover towards basement highs (e.g. black dashed ellipse in Figs5b and6CDPs 2800–2950).
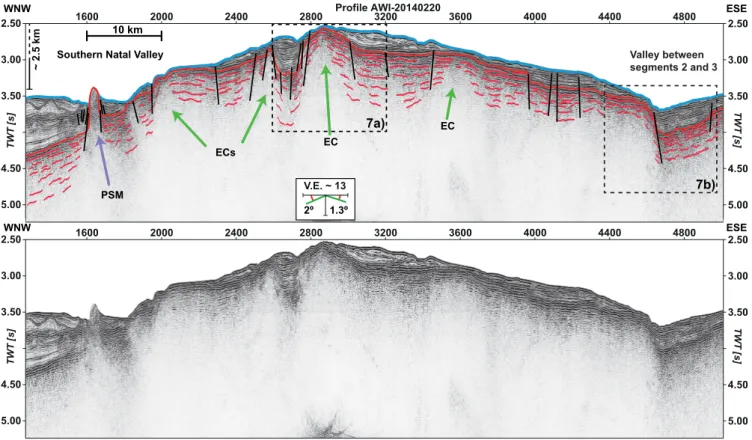
The swMozR is not as elevated as the cMozR, but still rises above the abyssal seafloor basement by up to 3500 ms TWT (Figs5a and 6). The swMozR is separated from the cMozR by an NNW–SSE striking valley (Fig.5a). The valley seems to have an asymmetrical shape as can be seen in Figs6(CDPs 4600–5000) and7(c). We observe a greater abundance of faults and larger fault throws in the southern part of the swMozR with the result that the basement appears more fragmented than in the north. With a depth of up to 800 ms TWT below the top of basement the maximum depth of the observed intrabasement reflections is comparable to the cMozR (Fig.6CDPs 1300–1550 and CDPs 3000–3400). Within the val- ley between the cMozR and the swMozR intrabasement reflections emerging from local basement highs of the cMozR show onlap onto those emerging from local highs of the swMozR (Figs7b and c).
4.2.3 Southeastern Mozambique Ridge
In contrast to the cMozR and the swMozR, the seMozR (4 in Fig.1) seems to have a smoother and more homogeneous basement topog- raphy, even though it is difficult to make a general statement based on the low data coverage of the seMozR. Seismic data suggest a rather uniform basement depth in east-west direction and a gentle dip of basement to the south (Figs5a and8). The depth ranges be- tween∼3500 ms TWT in the north and more than 4800 ms TWT in
the south (Figs5a and8). Basement hence lies significantly deeper than on the other segments (Fig.5a). Intrabasement reflections reach up to 600 ms TWT deep and follow the general southward dipping trend of top basement (Fig.8CDPs 4200–4600).
South of the seMozR we observe a smooth transition onto the Transkei Rise (Figs 1 and 8). The depth of top of basement is between 5500 and 6000 ms TWT bsl and thus lies about 1000 to 2000 ms TWT deeper than at the seMozR (Fig.5a). Intrabasement reflections at the Transkei Rise show a maximum depth of 450 ms TWT below the top of basement.
4.3 Magmatic structures
The magmatic basement of the MozR and the Transkei Rise is characterized by prominent convex upward shaped structures (e.g.
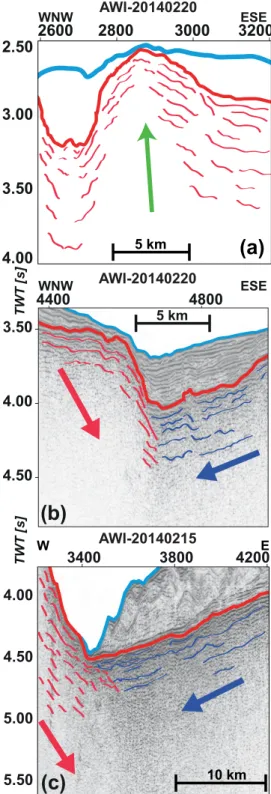
Fig.3CDPs 2400–2800, Fig.4CDPs 4200–4400), which form lo- cal highs. The structures are distributed randomly and do not seem to follow any apparent trend (Fig.5c). The lateral extent of these structures can be up to 10 km (e.g. Fig.3CDPs 2400–2800, Fig.6 CDPs 2700–3100 and Fig.7a). Parallel (e.g. Fig.3CDPs 3400–
4200) and subparallel (e.g. Fig.6CDPs 3200–4000) sequences of intrabasement reflections emerge, dip away and extend downhill from these local basement highs in opposing directions. Reflections at the summit are nearly horizontal and not as continuous as those on the flanks, and we observe nearly no intrabasement reflections be- neath the summits (e.g. Fig.3CDPs 2400–2800). Our observations
~2.5 km
40 km
TWT (s) TWT (s)
2.00
2.50
3.50
4.00
4.50
2.00
2.50
3.50
4.00
4.50 5800
6600 7400
8200
9000 5000 4200 3400 2600 1800 1000 200 NE
SW Profile AWI-20140212
PSM
BC3 BC2
EC
EC EC
V.E. ~ 35 1.25º 2.1º
TWT (s) TWT (s)
2.00
2.50
3.50
4.00
4.50
2.00
2.50
3.50
4.00
4.50 5800
6600 7400
8200
9000 5000 4200 3400 2600 1800 1000 200 NE
SW
Figure 4.MCS profile AWI-20140212 crossing the central Mozambique Ridge in an NE–SW direction. Line and arrow colours as in Fig.3. BC2=Basement complex 2, BC3=Basement complex 3. For slope angles and vertical exaggeration, refer to the legend. Location of profile is shown in Fig.1.
resemble structures identified at the Manihiki Plateau, Shatsky Rise, and the Agulhas Plateau (Uenzelmann-Nebenet al.1999; Sager et al.2013b; Pietsch & Uenzelmann-Neben2015), which have been interpreted as extrusion centres (ECs). Sedimentary deposits onlap the ECs indicating pre-sedimentary magmatism (e.g. Fig.3CDPs 3400–4200).
We observe a second type of magmatic structures character- ized by a pull up of sedimentary layers suggesting a predomi- nantly post-sedimentary development (Fig. 2CDPs 9300–9900) here called post-sedimentary magmatic (PSM) structures. All PSM structures cause deformation up to seismic unit S2b, even though not all of them pierce into the mid-Miocene to Holocene deposits.
This is due to considerable differences in height from less than 100 m to more than 1200 m (using an averaged seismic velocity of 1500 m s−1). The lateral extent of the conical to cylicdrical PSM structures usually ranges from 1 to 4 km (e.g. Fig.6CDPs 1600–
1700) thus much smaller than the observed ECs. The structures are mainly concentrated on the flanks of the segments, whereas only a few are observed adjacent to ECs (Fig.5d).
4.4 Faults
We observe numerous breaks in lateral continuity of seismic units within the study area, some of them with small offsets of<20–80 ms TWT only affecting basement and the intrabasement reflections (e.g. Fig.4CDP 3900, Fig.6CDP 3950 and Fig.8CDP 3500). The majority of the vertical offsets affect basement and seismic unit S1 (offsets up to 180 ms TWT; e.g. Fig.4CDP 6000, Fig.6CDP 2500
and Fig. 8CDP 7200) with some causing deformation up to the seafloor with offsets greater than 1000 ms TWT (e.g. Fig.3CDP 4800, Fig.6CDP 2800 and Fig.8CDP 8050).
Vertical offsets or breaks in lateral continuities of seismic units, and kinking or bowing of seismic reflections are typical expressions of faults (Hajnalet al.1996; Sageret al.2013a). Depending on the age of the deformed strata the observed faults can be divided into three groups: (1) faults only affecting basement that probably developed during or shortly after emplacement of the basement, (2) faults dissecting basement and sedimentary deposits of seismic unit S1 with a minimum age of∼100 Ma, and (3) faults deforming the whole sedimentary pile including basement and a maximum age of
∼15 Ma. The latter can be observed in multibeam data recorded at the swMozR during SO 232 as well and show a predominantly EW to WNW–ESE strike (Uenzelmann-Neben2014).
5 D I S C U S S I O N
5.1 Intrabasement reflections and extrusion centres The seismic data show a large number of ECs randomly distributed across the three segments of the southern MozR (Fig.5c). Defining characteristics of the convex upward shaped ECs are up to 15 km long parallel and subparallel sequences of intrabasement reflections diverging from their summits and the onlap of overlying sedimen- tary strata onto its surface, suggesting emplacement of the ECs before deposition of sediments took place. The intrabasement re- flections vary in their reflection amplitude and continuity, and can
2000 3000 4000 5000 6000 7000
TWT [ms]
31˚
31˚
32˚
32˚
33˚
33˚
34˚
34˚
35˚
35˚
36˚
36˚
37˚
37˚
−36˚ −36˚
−35˚ −35˚
−34˚ −34˚
−33˚ −33˚
−32˚ −32˚
−31˚ −31˚
−30˚ −30˚
−5500 m
−5000 m
−4500 m
−4000 m
−4500 m
−4000 m
−3500 m
−3500 m
−3000 m
−3000 m
−3000 m
−2500 m
−2500 m
−2000 m
−2000 m
−1500 m
2000 2000
2500
2500 3000
3000
3000 3500 3500
3500
3500
3500 4000
4000
4000
4500 4500 4500
5000 5000 5000
5000
5500 5500
5500
6000
0 6000
6500 6500
DSDP Leg 25 Site 249 Durban
(a)
BC1
BC2
BC3
TR
31˚
31˚
32˚
32˚
33˚
33˚
34˚
34˚
35˚
35˚
36˚
36˚
37˚
37˚
−36˚ −36˚
−35˚ −35˚
−34˚ −34˚
−33˚ −33˚
−32˚ −32˚
−31˚ −31˚
−30˚ −30˚
−5500 m
−5000 m
−4500 m
−4000 m
−4500 m
−4000 m
−3500 m
−3500 m
−3000 m
−3000 m
−3000 m
−2500 m
−2500 m
−2000 m
−2000 m
−1500 m 0
0 0
400
400 400
400
400 400
400
400 400
400 400
800
800 800
800
800 800
1200
200 1200
1200
DSDP Leg 25 Site 249 Durban
TWT [ms]
0 500 1000 1500
(b)
BC1
TR
−5500 m
−5000 m
−4500 m
−4000 m
−4500 m
−4000 m
−3500 m
−3500 m
−300 0 m
−3000 m
−3000
m −250
0 m
−2500 m
−2000 m
−2000 m
−1500 m
1
2
3 4
31˚
31˚
32˚
32˚
33˚
33˚
34˚
34˚
35˚
35˚
36˚
36˚
37˚
37˚
−36˚ −36˚
−35˚ −35˚
−34˚ −34˚
−33˚ −33˚
−32˚ −32˚
−31˚ −31˚
−30˚ DSDP Leg 25 −30˚
Site 249 Durban
2000 3000 4000 5000 6000 7000
TWT [ms]
Extrusion center
(c)
TR
−5500m
−5000 m
−4500 m
−4000 m
−4500 m
−4000 m
−3500 m
−3500 m
−3000 m
−3000 m
−3000 m −2500
m
−2500 m
−2000 m
−2000 m
−1500 m
1
2
3 4
31˚
31˚
32˚
32˚
33˚
33˚
34˚
34˚
35˚
35˚
36˚
36˚
37˚
37˚
−36˚ −36˚
−35˚ −35˚
−34˚ −34˚
−33˚ −33˚
−32˚ −32˚
−31˚ −31˚
−30˚ DSDP Leg 25 −30˚
Site 249 Durban
2000 3000 4000 5000 6000 7000 TWT [ms]
(d)
post-
sedimentary magmatism
TR
BC2
BC3
Figure 5. (a) Depth map (TWT) of top basement reflection (500 ms TWT contour lines in black) on top of greyscale bathymetric map (GEBCO 08; 500 m contour lines in white). Map shows location of DSDP Leg 25 Site 249 (star) and Durban (pentagon). BC1, BC2 and BC3 indicate the location of the basement complexes of the cMozR, the black dashed ellipses mark prominent basement highs, and TR stands for Transkei Rise. (b) Isopach map (TWT) of the sedimentary deposits in the study area (200 ms TWT contour lines in black). (c) Locations of extrusion centres (cyan dots) within the study area on top of the basement depth map (Fig.5a). Location of MCS profiles is shown in thin black lines. White numbers depict the segments of the Mozambique Ridge: 1=northern Mozambique Ridge, 2=central Mozambique Ridge, 3=southwestern Mozambique Ridge, 4=southeastern Mozambique Ridge. (d) Map of the observed post-sedimentary magmatic features (white dots) plotted on top of the basement depth map (Fig.5a).
00 1600 2000 2400 2800 Profile AWI-201402203200 3600 4000 4400 4800
V.E. ~ 13 1.3º 2º
WNW ESE
2.50
3.00
3.50
4.50
5.00
TWT [s]
2.50
3.00
3.50
4.50
5.00
TWT [s]
ECs
PSM
EC
EC
~ 2.5 km
10 km
Southern Natal Valley Valley between
segments 2 and 3
7a)
7b)
00 1600 2000 2400 2800 3200 3600 4000 4400 4800
WNW ESE
2.50
3.00
3.50
4.50
5.00
TWT [s]
2.50
3.00
3.50
4.50
5.00
TWT [s]
Figure 6.MCS profile AWI-20140220 crossing the southwestern Mozambique Ridge in a WNW–ESE direction. Line and arrow colours as in Fig.3. For slope angles and vertical exaggeration, refer to the legend. The dashed frames indicate the locations of Figs7(a) and(b). Location of profiles is shown in Fig.1.
be identified as deep as 800 ms TWT below the top of basement (Figs4and6). Similar observations of massive intrabasement reflec- tions with varying geometries and amplitude characteristics have been reported for other locations around the world (e.g. Shatsky Rise, Agulhas Plateau, Kerguelen Plateau, Manihiki Plateau). Deep intrabasement reflections are characteristic for oceanic plateau erup- tions (Sageret al.2013b) and have been interpreted and in parts proven via drilling as lava flow sequences (Uenzelmann-Nebenet al.
1999; Freyet al.2000; Inoueet al.2008; Parsieglaet al.2008; Sager et al.2013b; Pietsch & Uenzelmann-Neben2015). We hence inter- pret the observed intrabasement reflections at the MozR to represent lava flow sequences. This interpretation is backed by a rise in in- terval velocity from less than 2600 m s−1within seismic units S1 and S2 to values of 3500 to 5000 m s−1below the top of basement derived from velocity analyses of CDP gathers and theP-wave velocity-depth distribution model for the swMozR by Gohlet al.
(2011).
The lava flow sequences observed in the seismic reflection data form successions of at least 1.4–1.7 km thickness convert- ing the observed thicknesses in ms TWT into m using a velocity of 4.25 km s−1. The lava flow sequences represent only a small pro- portion of up to 22 km thick crust proposed to be built up by large volumes of mantle-derived magma (Gohlet al.2011). This type of crust implies that either eruptive phases were long lasting or eruption rates were high. The postulated short time frame of only
∼13 Myr during which emplacement of the southern MozR took place (K¨onig & Jokat2010) supports high eruption rates as the primary cause for the thick lava flow deposits. According to Coffin
& Eldholm (1994), Selfet al.(2008) and Sageret al.(2013b) high eruption rates are typical for LIPs and the reason for their distinctive low slopes and thick lava sequences. We therefore propose that the
observed low slopes and thick successions of lava sequences (e.g.
Fig.6) were caused by high eruption rates during emplacement of the southern MozR and thus favour a LIP origin of the MozR.
The geometry of the lava flow sequences is highly variable (e.g.
dip angles and dip directions; Fig.4CDPs 1800–2200). The large number of ECs from which the intrabasement reflections emerge (e.g. Fig.6CDPs 2600–3200), and the observation of parallel and sub-parallel stratified sequences of intrabasement reflections, which overlap and onlap each other (e.g. Fig.4CDPs 1400–2200), points towards several eruptive phases during emplacement. LIPs are pro- posed to be constructed of eruptions from multiple locations (Jerram
& Widdowson2005; Bryanet al.2010). The observation of onlaps (Figs7b and c) of lava flow sequences emplaced at the cMozR onto lava flow sequences emerged from the swMozR are interpreted as evidence for an asynchronous emplacement of both segments: while magmatic output ceased at the swMozR, lava flow sequences were still being emplaced at the cMozR. Strong magnetic anomalies as- sociated with the boundaries of the individual segments interpreted as evidence for formation of the segments at different ages (K¨onig &
Jokat2010), which agrees well with our observations. We therefore suggest that the thick pile of lava flow sequences forming the south- ern MozR were emplaced during several eruptions via the randomly distributed ECs and favour sequential development of the southern MozR with the youngest segment located in the southeast.
5.2 Post-sedimentary magmatism at the Mozambique Ridge
Magmatic structures of proposed post-sedimentary magmatic (PSM) origin (deformation of above lying sedimentary sequences
5 km
2800 3200
2600 3000
2.50
3.00
3.50
4.00 (a)
3.50
4.00
4.50
4400 4800
5 km WNW
(b)
ESE
WNW ESE
3400 3800 4200
4.00
4.50
5.00
5.50
W E
10 km
(c)
TWT [s]TWT [s]
AWI-20140220
AWI-20140215 AWI-20140220
Figure 7.(a) Extrusion centre with lava flow sequences emerging and dip- ping away from it. Line colours as in Fig.3. (b, c) Figures showing the area of the valley between the southwestern and central Mozambique Ridge.
Line colours as in Fig.3, except thin red lines=intrabasement reflections emerging from the southwestern Mozambique Ridge, thin blue lines=in- trabasement reflections emerging from the central Mozambique Ridge. The arrows (red and blue) show the observed flow direction of the respective intrabasement reflections.
with a pull-up at the structure’s flanks, e.g. Fig.3CDPs 1300–1400, in places piercing of the seafloor, e.g. Fig.6CDPs 1600–1700) can be identified on the MozR. With their small diameters and steep flanks the PSM structures resemble piercement structures as de- scribed for the Kerguelen Plateau and interpreted as subvolcanic intrusives by Ramsayet al.(1986). Some of the PSM structures seem to coincide with the faults that deform a large proportion of the up to 15 Myr old seismic unit S2b (e.g. Fig.6CDPs 1600–1700).
The majority of PSM features are concentrated within the transi- tion zone of the segments to the surrounding basins (e.g. Figs5d and 3CDPs 9300–9900) with a distinct increase in abundance of PSM structures in the southwestern and northwestern part of the study area (Fig.5d). All observed PSM structures led to deformation of parts of the overlying seismic unit S2b. This points to the onset of PSM activity after deposition of seismic unit S2b had already begun, thus after 15 Ma. This age corresponds to the probable onset of faulting associated with the breaks in lateral continuity, which in places affect seismic unit S2b up to seafloor (e.g. Fig.3CDP 200).
Faulting of the mid-Neogene to Quaternary strata might thus be an ongoing process.
According to Chorowicz (2005), neotectonic and Neogene mag- matic activity in East Africa are interconnected and a consequence of the East African Rift System. The rift valleys of the East African Rift System (EARS) form two main lines, the Eastern and Western rift branches, which have shown a general southward propagation since initiation of the EARS (inset in Fig.1; Ebingeret al.1989;
Kampunzuet al.1998; Calaiset al.2006). Parts of the onshore Western rift branch terminate in the Mozambique Coastal Plains north of the study area (Stamps et al. 2008; Saria et al. 2014;
Wileset al.2014). Magmatic activity in the western branch com- menced∼11 Ma in the north and∼8.6 Ma in the south, thus fol- lowing the general southward trend of rift propagation of the EARS (Kampunzuet al.1998; Macgregor2015).
Several authors suggested a seaward propagation of the Eastern branch of the EARS but there is a strong dissent about whether there exists an offshore extension of the Western branch (Mougenot et al.1986; Hartnadyet al.1992; Kampunzuet al.1998; Stamps et al.2008; Sariaet al.2014; Wileset al.2014; Frankeet al.2015;
Klimkeet al.2015). Hartnadyet al.(1992) and Ben-Avrahamet al.
(1995) related neotectonic activity in the vicinity of the MozR to a propagation of the Western branch of the EARS into the Natal Valley. Tikkuet al.(2002) supported a seaward extension of the Western branch of the EARS into the northeastern Natal Valley on the basis of free-air gravity lows interpreted as neotectonic faults.
A seaward propagation was recently revisited by Wileset al.(2014) as a probable cause for up to 31 km long and 18 km wide seafloor mounds observed northwest of the MozR. Other authors proposed that the western boundary of the Lwandle microplate traces along the eastern border of the MozR (Stampset al.2008; Sariaet al.2014;
Stampset al.2014), thus presenting another probable connection of neotectonic activity to a southward propagation of the EARS in the vicinity of the MozR.
We suggest that both PSM structures and neotectonic activity creating the faults deforming seismic unit S2b are caused by seaward propagation of the Western branch of the EARS in Late Miocene times. This is based on the age of the deformed seismic unit S2b (<15 Ma) and its chronological correlation to the onset of rifting in the Western branch of the EARS (Nyblade & Brazier2002). If we follow the proposed southward decrease in age of volcanism at the onshore Western branch and its onset in the south∼8.6 Ma (Kampunzu et al.1998; Macgregor2015), it is likely that post- sedimentary magmatism at the MozR commenced after 8.6 Ma.