Eur. J. Clin. Chcm. Clin. Biochem.
Vol. 31, 1993, pp. 803-809
© 1993 Walter de Gruyter & Co.
Berlin · New York
Carry-Over Biases in Clinical Pharmacology
By T. J. M. Cleophas
Department of Medicine, Merwede Hospital Sliedrecht-Dordrecht, The Netherlands
(Received July 9/September 20, 1993)
Summary: If the effect of a treatment carries on after the treatment is withdrawn then the response to a second treatment may well be due in part to the previous treatment. This so called carry-over effect may bias any clinical trial in which subjects are tested more than once. Cross-over studies can be routinely checked for this bias. In other study designs, however, common sense and alertness for unusual patterns in the data are the only defences against it.
The amount of carry-over bias in clinical trials can be somewhat minimized by the following measures. Dose- response studies, dose-titration studies, and open evaluation studies should require a sufficient washout period between the administrations of the drugs. Studies using duplicate standard deviations for the estimation of intra-individual reproducibility of a test should routinely include a statistical test for differences between the duplicate data. Self-controlled studies should not be used otherwise than as an initial orientation for a new treatment. Parallel studies should routinely be stratified for symmetry of previous treatments. Studies with subjective variables are frequently influenced by psychological carry-over effects and should, therefore, be validated together with objective variables whenever possible.
In spite of the above measures many cases of carry-over effect remain unpreventable.
introduction f _ , _ . . . .
cross-overs, but also any other type of clinical trial m If the effect of one treatment carries on after the which subjects are tested more than once,
treatment is withdrawn then the response to a second treatment may well be due in part to the previous
treatment. This is the so-called carry-over effect. It is ^ D Λ r\ τ·* *· c·* j-• , , . t „ „ Dose Response and Dose Titration Studies usually thought of as a physical carry-over effect of
a compound in the blood stream. However, another A dose-effect relationship is commonly derived from real possibility is that of psychological carry-over. The the effects following a series of incremental doses of term was first used in conjunction, with cross-over a drug. A dose-response study estimates this effect by trials (1 —4), where each patient serves as his own the use of mean scores. A dose titration study does control. Procedures have been developed to test for so by the fraction of responders. In classical receptor carry-over effects in such studies (5 — 12). From them theory it is assumed that the drug effect is propor- one may conclude that the carry-over effect may have tional to the fraction of receptors occupied by the a large impact on the final results and may largely drug and that maximal effect occurs when all recep- invalidate these studies. The Food and Drug Admin- tors are occupied. The Michaelis Menten equation istration (FDA) (13) and some statisticians (1, 14— explains the shape of the dose response and dose 17) even discouraged the use of cross-overs because titration curves,
of this potential bias. Using the standard phase 1—4
classification of clinical trials (11, 18, 19) (tab. 1), we pff _ Maximal effect χ Dose demonstrate that carry-over effect may not only bias ~~ Constant + Dose
Eur. J. Clin. Chem. Clin. Bioohem. / Vol. 31,1993 / No. 12
Tab. 1. Phase 1—4 classification of clinical trials
Characteristics Popular study designs
Phase 1—2 · Normal volunteers
β Pharmacokinetics, biologic effects, dose titration Phase 2—3 ο Small groups of patients
ο Therapeutic efficacy and safety Phase 3—4 β Large groups of patients
ο Long-term effects, quality of life assessment, post-marketing surveillance
Dose-response studies Dose-titration studies
Studies with duplicate standard deviations Open evaluation studies
Cross-over studies Self-controlled studies Parallel-group studies
Studies with subjective variables
1.00-
oφ
ο
"c 0.50
CO
cΟ Ο
CO
Log [D]
Fig. 1. Dose (D) response curves with ( ) and without (—) carry-over effect due to accumulation of residual drug.
KD = dose needed to obtain half-maximal effect.
This equation describes a simple hyperbola with the maximal effect being approached asymptotically. In order to display a wide range of drug concentrations more easily, log dose is frequently plotted instead of dose. Thus, the result is the familiar sigmoidal log dose-effect curve (fig. 1). Anomalous relationships may result from different causes, e.g., a maximal response from less than maximal receptor occupancy (spare receptors), from a threshold phenomenon or from the presence of competitive agents in the blood.
Anomalous curves, especially very steep ones (fig. 1), may be caused by the carry-over effect because of the following. In dose response studies the subjects are generally tested several times. The second experiment usually takes place after 4 plasma half-times of the drug that is being tested. Figure 2 shows that even after 4 half-times the plasma concentration is not yet zero and that after a two-fold dose the plasma con- centration at 4 half-times is equally two-fold. In ad- dition, a significant receptor occupancy may last longer than 4 plasma half-times. These effects, al- though assumed by statisticians (20), are not routinely taken into account by investigators. The result would be an over-estimation of treatment effect and rec- ommendation of erroneously low doses in follow-up
0 2 4
Time, multiples of elimination halftime
Fig. 2. Patterns to illustrate the influence of a two-fold differ- ence in dosage. Q = concentration of drug in plasma mg/1 at time t.
26
ρο
<D
·*-·ι—
£ 24ω ο.Ε α>
*-»
ι_
Ο)
ίι_ 22C
I I
I
I
ρ<0.05
5 10 20 Phenoxybenzamine dose [mg]
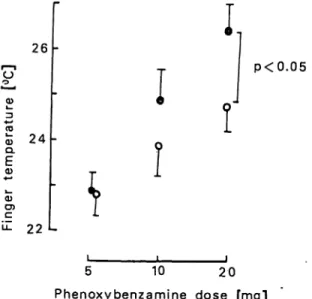
Fig. 3. Dose-response study of respectively 5, 10, and 20 mg phenoxybenzamine and finger temperature after stan- dard cooling 4 in patients with Raynautfs syndrome (n = 16). Solid lines present mean results ± SD's of tests performed with 4 plasma half-time intervals be- tween the tests, dotted line with 14 plasma half-times.
studies, giving rise to insufficient results. To test these assumptions we performed a 4ose^response study of different doses of the vasodilator phenoxybenzamine Eur. J. Clin. Chem. Clin. Biocheni. / Vol. 31,1993 / No. 12
on finger temperature after standard finger cooling (21) in patients with Raynaucfs disease (fig. 3). With 14 plasma half-time intervals between the subsequent doses the mean dose-response relationship was sig- nificantly flatter (dotted curve). An interval of 4 plasma half-times was apparently not sufficient to prevent a significant carry-over effect (solid curve).
Studies with Duplicate Standard Deviations
Reproducibility of a test may be expressed as the coefficient of variation. This method, however, meas- ures reproducibility in general and not specifically intra-individual reproducibility. For study designs with repeated measurements in a single subject an a priori assessment of the intra-individual reproducibil- ity of the main variables is required. For that purpose duplicate standard deviations are frequently used. All subjects are tested twice. The duplicate standard de- viations are calculated according to:
S =
S = duplicate standard deviation
Vi = difference between test 1 and 2 in subject i n = number of subjects
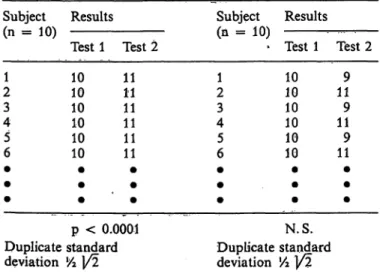
Table 2 gives a hypothesized example of such a pro- cedure. In the left column there is a significant dif- ference between test 1 and 2. In the right there is not.
Still both columns have the same duplicate standard deviations. The significant difference between test 1 and 2 in the left column is probably due to the carry- over effect, provided that the investigators kept the study circumstances of test series 1 and 2 unchanged.
From the example it can be seen that the duplicate
Tab. 2. Two hypothesized studies with duplicate standard de- viations
Subject Results (n = 10)
Test 1 Test 2
Subject Results (n = 10)
Test 1 Test 2 21
34 65
1010 1010 1010
1111 1111 1111
12 43 56
1010 1010 1010
119 119 119
p < 0.0001 Duplicate standard deviation l/2 1/2
N.S.
Duplicate standard deviation 1A 1/2
standard deviations cannot differentiate between ran- dom effects and carry-over bias. We recommend, therefore, that one always combines duplicate stan- dard deviation calculations with a statistical test for differences between the duplicates. If a significant difference is detected, the use of duplicate standard deviations has little value because it does not represent intra-individual reproducibility, but mainly carry-over bias.
Open Evaluation Studies
Carry-over effects may also occur when different com- pounds are administered one after another. Even com- pletely new and unexpected effects may result from interactions between the different compounds that are present in the blood stream together. For example, we studied the effects of different adrenergic receptor agonists and antagonists on the blood pressure of normotensive subjects. Phenoxybenzamine hardly in- fluenced the blood pressure, whereas epinephrine caused a substantial rise in blood pressure (fig. 4).
Time
Fig. 4. Response of blood pressure to epinephrine with and without prior administration of phenoxybenzamine (lower and upper record respectively).
However, when epinephrine was given after phenoxy- benzamine, the pressor effect turned into a depressor.
This effect was explained by a carry-over effect of phenoxybenzamine, which blocked the vasoconstric- tive -receptors and give rise to the ß-vasodilator effect of epinephrine. Similarly, an enhanced pressor effect of epinephrine can be observed after pretreat- inent with propranolol, which is a compound that otherwise lowers the blood pressure. Such interactions are common in everyday clinical practice where sick subjects are given a number of drugs until equilibrium is restored. It is, of course, impossible to evaluate the effects of the separate compounds in these situations.
Eur. J. Clin. Chem. Clin: Biochem. / Vol. 31,1993 / No. 12
It is, however, essential to do so in open evaluation studies of new pharmacological compounds. In such studies a number of newly developed compounds is given shortly one after another to a single subject or a small group of subjects. This is done for the purpose of obtaining a fast selection of a few compounds for further study. Because of economic reasons such stud- ies are frequently uncontrolled. They should at least have appropriate washout periods between two tests, as dose-response and dose-titration studies require.
Otherwise, the results are likely to be biased by carry- over effects.
Cross-Over Studies
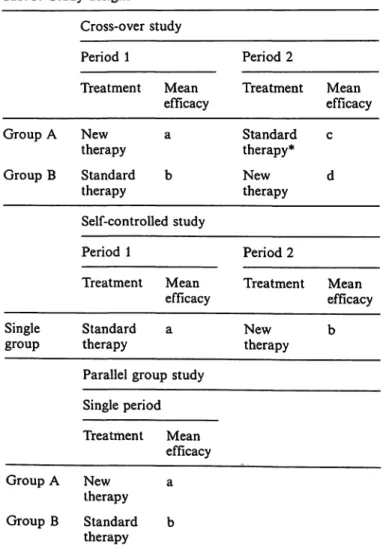
Table 3 shows the basic design of a cross-over study.
Group A receives the test compound in the first pe- riod, followed by a placebo or standard therapy.
Group B receives the two treatments in the reverse order. In the analysis the data of the test compound periods are taken together and compared with the data of the placebo or standard therapy periods (a + d versus c + b). Physical carry-over effect oc- curs when a treatment is used for curing an ailment
rather than for alleviation. Suppose the test com- pound is an antibiotic (tab. 4). After period 1, 100%
of the patients in group A and 0% of the patients in group B are cured. After the next period, finally all patients are cured. In the analysis the difference be- tween antibiotic and placebo in group A is zero; in group B it is 100% — mean value 50% improvement.
Obviously a cross-over design should never be used when a treatment cures a disease. However, with symptomatic therapies as well small curative effects can occur, e. g., wound healing by vasodilators. This is illustrated by a study of Kahan (22) (tab.5). The efficacy of a vasodilator was assessed in patients with Raynaud s syndrome. Group A took the placebo after
Tab. 4. Model of cross-over study with antibiotic or placebo
Period 1 Period 2
Treatment Mean
efficacy* Treatment Mean efficacy Group A
Group B Antibiotic 100%
Placebo 0% Placebo 100%
Antibiotic 100%' Percentage of cured patients.
Tab. 3. Study designs
Cross-over study
Period 1 Period 2
Treatment Mean
efficacy Treatment Mean efficacy Group A
Group B
Newtherapy Standard therapy
a b
Standard therapy*
Newtherapy c d Self-controlled study
Period 1 Period 2
Treatment Mean
efficacy Treatment Mean efficacy Single
group Standard a
therapy
Parallel group study Single period
Newtherapy b
Treatment Mean efficacy Group A New a
therapy Group B Standard b
therapy
* Instead of standard therapy, a placebo is frequently used.
Tab. 5. Efficacy of vasodilator or placebo in a cross-over study in patients with RaynaucFs syndrome (22)
Period 1 Period 2
Treat-
ment Mean
efficacy* Treat-
ment Mean
efficacy Group A Vasodi- 24.0 ±11.0 Placebo 25.0 ± 10.8 (n = 10) lator
Group B Placebo 34.3 ± 14.9 Vasodi- 23.1 ± 19.1 (n = 10) lator
* Mean frequency of Raynaud attacks per week ± S. D.
the vasodilator. The frequency of Raynaud attacks was only 25 attacks per week. Group B has the pla- cebo first. The score is not less than 34.3 attacks, which is significantly different from 25 (p < 0.05).
Analyzing the data according to the cross-over design we find an improvement in group A of — 1 attack, and in group B of —11.2 attacks, for a mean im- provement — 6.1 attacks. But when we just left out period 2 and compared the data of the first period, the improvement is —10.3 attacks. So the cross-over gives a more than 40% underestimation compared with the first period. This is probably largely due to a physical carry-over effect in group A. The beneficial vasodilator effect in this group seems to carry on after the compound has been withdrawn and replaced by a placebo.
Eur. J. Clin. Chem. Clin. Biochem. / Vol. 31,1993 / No. 12
Self-Controlled Studies
These are studies where a single group of patients is given a standard treatment and a new treatment, one after the other (tab. 3). As with cross-over studies a carry-over effect from period 1 into period 2 is pos- sible. However, an additional problem is that since a control group is missing here data cannot be tested for it. The next problem is that self-controlled studies are more often used at early points in the development of new treatments (23), so that we have few clinical arguments against carry-over effect. An additional weakness of such studies is the general use of large numbers of variables (23), which enhances the chances of a type II error, which yields a difference where there is none, and of a confounding of dependent and independent variables because multivariate analysis is rarely applied. This means that self-controlled trials should not be used otherwise than as an initial ori- entation for a new treatment. One exception is the situation where a trial is designed in order to detect carry-over effect. E. g., Packer et al. (24) used a self- controlled study to investigate the clinical reaction of patients with heart failure to acute withdrawal of nitroprusside. The self-controlled design seems ideal for the establishment of this rebound phenomenon, which can be considered as a special form of carry- over effect (24).
Parallel-Group Studies
In parallel-group studies two groups of patients re- ceive a different treatment throughout the trial (tab.
3). Because there is no change-over of therapy during the trial, carry-over effects within the trial are ex- cluded. However, carry-over effects from treatments prior to the trial are not and may bias parallel studies to a greater extent than they do cross-overs. The point is that the between-group comparison of parallel stud- ies is much more dependent on symmetry of the treatment groups than the within-group comparison of cross-overs. This can be illustrated by a parallel- group study of Graham on the effect of positive-
Tab. 6. Patients' characteristics in a two-group parallel study of positive-pressure ventilation treatment for pneumo- nia (25)
Total no. of patients No -of men
Age (years) No. of smokers
No. who took antibiotics before admission
Control group 2713 6316 5
Treatment group 2714 6117 10
pressure or sham ventilation on patients with pneu- monia (25). The treatment group was significantly better than the control group. Although three of the four covariates were almost evenly split between the treatment groups, the fourth (prior antibiotic treat- ment) was somewhat lopsided (tab. 6). Because prior antibiotic therapy was likely to have had a clinically large effect on outcome, the imbalance could easily have biased the results. We recommend that during randomization parallel groups should not only rou- tinely be stratified for symmetry of covariates such as age, sex, duration of sickness but also for symmetry of previous treatments.
Studies with Subjective Variables
Another real possibility is that of psychological carry- over. This can be illustrated by a simple cross-over design (tab. 3). A less active agent is compared with an effective one and both treatments are judged by a subjective variable, e.g., improvement of complaints.
In the first period with the effective agent most pa- tients feel reduction in complaints. They approach the second with confidence. The other group experiences little improvement and gets a bad feeling about the trial. This influences its appraisal of the second period.
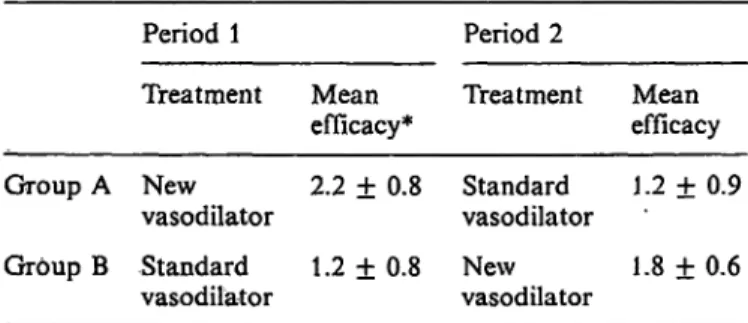
Table 7 gives an example: Group A received a new effective vasodilator before standard therapy and had a better score than Group B, 2.2 versus 1.8 points (new vasodilator Group A versus Group B, p < 0.05).
The difference between the new and standard therapy in Group A was 2.2 — 1.2 = 1.0 point. In group B 1.8 — 1.2 = 0.6 points — for a mean value of 0.8 points. But when we forget about period 2 and com- pare the data of the first period, the improvement is 2.2 — 1.2 =1.0 point. So this cross-over gives an underestimation of some 20%. This is probably due to a psychological carry-over effect in Group B. The patients in this group are disappointed and this im- pairs their appraisal of the second period. This ex-
Tab. 7. Efficacy of two vasodilators in a cross-over study in patients with RaynaucTs syndrome (26)
Period 1 Period 2
Treatment Mean
efficacy* Treatment Mean efficacy Group A New 2.2 ± 0.8 Standard 1.2 ± 0.9
vasodilator vasodilator
Group B Standard 1.2 ± 0.8 New 1.8 ± 0.6 vasodilator vasodilator
* Mean improvement of Raynaud complaints ± S. DM judged by a 4-point clinical scale (0 = no improvement; 4 = com- plete relief).
Bur. J. Clin. Chem. Clin. Biochem. / Vol. 31,1993 / No. 12
ample deals with the psychological carry-over effect in a cross-over design. The test subject's attitude to a study is, however, a variable hard to control in any study design. For example, most of the placebo-con- trolled parallel studies will have run in periods either with placebo or with an active agent. This may sim- ilarly cause either a negative or a positive psycholog- ical carry-over effect from the very start. Moreover, the subjects of the placebo arm of the study may lose their motivation during the trial, giving rise to un- derestimation of the final result of this arm rather than proper estimation of it. Also cohort or case- control studies using multiple questionnaires may suf- fer from this type of gradual demotivation bias, which has hardly been given any attention by the scientific community. Psychological carry-over effects can, of course, be minimized by the use of objective variables (e.g., physical measurements like blood pressure, heart rate, temperature). Subjective variables are, however, frequently indispensible and may even be the only ones that count. What good is a treatment if it does not make you feel better? A defence against the potential bias from psychological carry-over ef- fects is alertness to unusual patterns of answers. Un- fortunately, there is generally no statistical method of testing for it. Further, the value of subjective data should be validated together with objective variables and be interpreted with caution.
Discussion
Carry-over effect occurs when the response to a sec- ond treatment is in part due to the previous part of the study. It was first described in connection with cross-over studies (1 —4). From previous statistical reports one may conclude that it may have a large impact on the final results and may largely invalidate these studies (3, 4, 14, 16). The present paper shows that substantial carry-over bias may also occur in any other type of study where subjects are treated more than once, while there are virtually no methods to
test for it. There is, therefore, little one can do to address the bias in these situations. The following recommendations may be considered by investigators:
1. Cross-over studies should routinely include a sta- tistical test for carry-over bias. Simple methods for this purpose are the Grizzle test (1) or the "look at the data method" (9, 27).
2. In other study designs no test is available. Clinical arguments and alertness to unexpected patterns in the data are the only defences against it so far.
3. Dose-response, dose-titration, and open evaluation studies should require sufficient washout periods between the administrations of the drugs. Even as many as 14 plasma half-times may be required.
4. Studies using duplicate standard deviations should always be combined with a statistical test for dif- ferences between the duplicate data. If a significant difference is detected, the use of duplicate standard deviations for the estimation of intra-individual reproducibility has little value.
v"?-
5. Self-controlled studies should not be used other- wise than as an initial orientation for a new treat- ment.
6. Parallel studies should routinely be stratified for symmetry of previous treatments.
7. Subjective variables are frequently exposed to psy- chological carry-over effects. They should, there- fore, be validated together with objective variables whenever possible. If not, they should be inter- preted with caution.
8. As many cases of carry-over bias seem unprevent- able, we shall simply have to live with them.
Acknowledgement
The author is indebted to Ir. H. J. J. v. Lier, Dept. of Statistics, University of Nijmegen, The Netherlands, and to Dr. K. Zwin- derman, Dept. of Statistics, University of Leiden, The Nether- lands, for critical comments on earlier drafts of this paper.
References
1. Grizzle, J. E. (1974) The two period change-over design and its use in clinical trials. Biometrics 30, 727-734.
2. Hills, M. & Armitage, P. (1979) The two-period crossover trial. Br. J. Clin. Pharmacol £, 7-20.
3. Barker, M., Hew, R. J., Huitson, A. & Poloniecki, J. (1982) The two period crossover trial. Bias 9, 67-112.
4. Cleophas, T. J. (1990) Underestimation of treatment effect in crossover trials. Angiology 41, 855-864.
5. Brown, B. W. (1980) The crossover experiment for clinical trials. Biometrics 36, 60-79.
6. Cleophas, T. J. & Bailar, J. C. (1985) Statistical concepts fundamental to investigations. N. Engl. J. Med. 313, 1026.
7. Cleophas, T. J. (1989) Testing crossover studies for carry- over effects. Angiology 40, 287-^293.
8. Cleophas, T. J. (1990) A simple method for the estimation of interaction bias in crossover studies. J. Clin. Pharmacol.
30, 1036-1040.
9. Cleophas, T. J. (1991) The performance of the two-stage analysis of two-period crossover {rials. Stat. Med. 10,489—
495.
Eur. J. Clin. Chem. Clin. Biochem. / Vol. 31,1993 / No. 12
10. Cleophas, T. J. (1993) interaction bias in crossover studies:
A modified analysis to test with more sensitivity. Biomet- ricalJ. 35, 181-191.
11. Kaitin, K. J., Richard, B. W. & Lasagna, L. (1987) Trends in drug development: The 1985—86 new drug approvals.
J. Clin. Pharmacol. 27, 542-548.
.12. Pocock, S. J., Hughes, M. D. & Lee, R. J. (1987) Statistical problems in the reporting of clinical trials. N. Engl. J. Med.
377, 426-432.
13. Cornfield, J. & O'Neill, R. T. (1976) Minutes of the Food and Drug Administration. Biostatics and Epidemiology Advisory Committee meeting, June 23.
14. Fleiss, J. L. (1989) A critique of recent research on the two treatment crossover design. Controll. Clin. Trials 70, 237 — 15. Freeman, P. R. (1989) The performance of the two-stage234.
analysis of two-treatment, two-period crossover trials. Stat.
Med. 8, 1421-1432.
16. Grieve, A. P. (1985) A Bayesian analysis of the two-period crossover design for clinical trials. Biometrics 41, 979 — 17. Jones, B. & Kennard, M. G. (1989) Design and Analysis of990.
Crossover Trials. Chapman and Hall, NY.
18. Nies, A. S. (1991) Principles of therapeutics. In: Goodman and Gilman 's Pharmacological Basis of Therapeutics (Good- man, A. & Rail, T. W., eds.) Pergamon Press, NY, pp.
62-83.
19. Young, F. E., Norris, J. A., Levitt, J. A. & Nightingale, S.
L. (1988) The FDA's new procedure for the use of inves- tigational drugs in treatment. J. Am. Med. Ass. 250, 2267- 2270.
20. Sheiner, L. B., Hashimoto, Y. & Beal, S. L. (1991) A simulation study comparing designs for dose ranging. Stat.
Med. 70, 303-323.
21. Cleophas, T. J., Fennis, J. F. & van 't Laar, A. (1982) Finger temperature after a finger cooling test. J. Appl.
Physiol. 52, 1167-1171.
22. Kahan, A., Amor, B. & Menkes, C. J. (1987) Nicardipine in the treatment of Raynaud's phenomenon. Angiology 38, 333-337.
23. Louis, T. A., Lavori, P. W., Bailar, J. C. & Polansky, M.
(1986) Crossover and self-controlled designs in clinical re- search. In: Medical Uses of Statistics (Bailar, J. C. & Mos- teDer, F., eds.) NEJM Books, Waltham, Ma, pp. 67-90.
24. Packer, M., Mellar, J., Medina, N., Gorlin, R. & Hermann, R. V. (1979) Rebound hemodynamic events after abrupt withdrawal of nitroprusside in patients with severe chronic heart failure. N. Engl. J. Med. 307, 1193-1197.
25. Graham, W. G. & Bradley, D. A. (1978) Efficacy of chest physiotherapy and intermittent positive-pressure breathing in the resolution of pneumonia. N. Engl. J. Med. 299, 624-627.
26. Cleophas, T. J. (1983) Adrenergic receptor agonist and antagonists in Raynaud's syndrome. Thesis, Nijmegen, Neth.
27. Cleophas, T. J. (1993) Carryover effects in cardiovascular crossover studies: The standard and the clinical analysis.
Angiology 44, 271-277.
T. J. M. Cleophas Dept. of Medicine
Merwede Hospital Sliedrecht-Dordrecht P.O. Box 97
NL-3360 AB Sliedrecht The Netherlands
Bur. J. Clin. Chem. Clin. Biochern. / Vol. 31,1993 / No. 12