A Test of Silicon Photomultipliers as Readout for PET
A. N. Otte
a,∗ , J. Barral
b, B. Dolgoshein
c, J. Hose
a, S. Klemin
d, E. Lorenz
a, R. Mirzoyan
a, E. Popova
c,
M. Teshima
aaMax Planck Institute for Physics, F¨ohringer Ring 6, 80805 Munich, Germany
bEcole Polytechnique, 91128 Palaiseau, France
cMoscow Engineering and Physics Institute, Kashirskoe Shosse 31, 115409 Moscow, Russia
d”Pulsar” Enterprise, Okruzhnoj Proezd 27, Moscow, Russia
Abstract
The silicon photomultiplier (SiPM) is a novel photon detector based on Geiger mode operating avalanche photodiodes. In this paper we present results from a test, demonstrating the feasibility of SiPM as readout elements in scintillator based positron emission tomography (PET). As scintillator we use the newly developed LYSO crystals having similar characteristics as LSO. With our setup we measure an energy resolution of about 22 % and a time resolution of a single crystal element of (1
.51
±0
.07) nsec, both full width at half maximum. A significant improvement in time resolution could be achieved by triggering on the first photoelectron in the signal. We also present the coincidence rate of two detector channels vs. the position of a small point-like
22Na positron source.
Key words:
positron emission tomography (PET), silicon photomultiplier (SiPM), lutetium yttrium orthosilicate (LYSO), avalanche photo diode (APD).
1 Introduction
Positron emission tomography (PET) scanners are powerful tools for the study of physiological processes in vivo. Current developments aim to build smaller,
∗
Corresponding author.
Email address:
otte@mppmu.mpg.de (A. N. Otte).
more compact and less expensive devices with improved resolution and a sim- pler mode of operation. In case of higher spatial resolution, respectively finer structures one has to take into account the body movements to make the cor- rect correlation with anatomical structures. It might be of advantage to com- bine a PET scanner with an NMR scanner in order to simultaneously acquire information about the morphological structure and physiological processes.
To comply with these requirements, a reliable and cheap photon detector is needed, which is insensitive to magnetic fields and pickup as well as causing minimal interference with the NMR detector’s data acquisition system.
The so-called Silicon Photomultiplier (SiPM) is a novel approach towards an inexpensive high efficient photon detector that is developed by several groups (B. Dolgoshein, 2003), (D. Bisello, 1995) and (V. Golovin, 2004). First suggestions to use SiPMs as photon sensor in PET applications can be found in e.g. (A. V. Akindinov, 1997), but no specific study had been performed that time. We have carried out such a study and presented first results in (N. Otte, 2004). There we came to the conclusion that SiPMs can in principle be used for scintillating crystal readout in PET detectors. Since then we have improved our experimental setup to demonstrate the full feasibility of using SiPMs in PET.
This paper has the following structure. Firstly, we give a short introduction to the working principle of SiPMs. Then we discuss our setup and present experimental results on energy, time and position resolution. Finally, we con- clude on the prospects of SiPMs in PET and discuss some special issues and advantages of the SiPM as readout element.
2 The Silicon Photomultiplier
A SiPM is composed of an array of small avalanche photodiodes (APD) com- bined to form a macroscopic unit (typically 500 to 4000 APDs per mm
2); see Figure 1 for the basic concept. In the following we refer to the individual array element as ’cell’, while we name the macroscopic unit a ’pixel’ or SiPM. Each cell operates in limited Geiger mode, i.e. a few Volts above breakdown voltage.
In this mode of operation an electron initiates an avalanche breakdown con- fined to a cell (the electron ”triggers” the cell). A small polysilicon resistor, which connects the cell to a conductive grid on the front side (see Figure 2), limits the current through the junction and eventually quenches the avalanche once the cell capacity has been discharged.
For each Geiger breakdown the output signal of a cell has always the same
shape and charge (except for small variations due to differences from cell to
cell introduced in the production process). It should be noted that in case
two photoelectrons are produced simultaneously in a cell, the output signal is nevertheless standardized. Therefore, one cannot distinguish if one or more photoelectrons have been generated in a cell.
Ω ΩΩ Ω
Al Resistor
pixels
hn
2 m
Substrate
30 m
U ~60 Vbias
Fig. 1. Isometric view of a simplified SiPM. Light is incident from the top. The small inlet shows a picture of one of the cells of which the SiPM is composed of.
The cell is connected via a small polysilicon resistor to the aluminum grid which serves as common readout for all cells.
Fig. 2. Cross section through the topology of one SiPM cell. On the right side a part of a neighboring cell is shown. Photons are incident from the top. (Drawing taken from P. Buzhan (2001).)
As mentioned above, in a SiPM the independent operating APD cells are all
connected via resistors to a common readout line. Therefore the output signal
is the superposition of the standardized signals of all fired cells. In case of not
too intense light flashes the number of fired cells is in first order proportional
to the number of photons thus compensating for the missing dynamic range of
a single Geiger mode APD. For large light flashes (as well as for a sizeable light
background) saturation effects set in. In reality the process is more complex
because of the recovery time of the cells and the influence of dark current. The
main domain of operation for SiPMs is for light levels with a photoelectron
flux 1 photoelectron/cell/recovery time. Not all photoelectrons are able
to initiate an avalanche breakdown, therefore the so-called photon detection
efficiency (PDE) is lower than the quantum efficiency (QE) in the photodiode operation mode of the SiPM.
In detail the PDE of current SiPM prototypes is influenced by several contri- butions. The most important ones are:
• the fraction of the active area of a pixel
• the quantum efficiency (QE) of the active area
• the probability to initiate an avalanche breakdown (Geiger efficiency)
• the fraction of active cells, i.e. those cells which are not quenched or are still recovering from a previous breakdown.
In first order the PDE is a product of the four quantities.
The active area fraction, limited by the dead area around each cell, depends on the construction and ranges typically between 20%-70% of the total area.
Typical values of PDE of recent SiPMs are comparable to the QE of conven- tional bialkali photomultipliers. It is expected that the PDE of SiPMs will be increased in the near future as new ideas and promising new concepts will be investigated.
The main advantages of SiPMs compared to linear (classical) APDs are:
• Standardized output pulses for single photoelectrons
• Low sensitivity for pickup, respectively EMI
• Large intrinsic gain, 10
5–10
6• No need for sophisticated and expensive preamplifiers
• Fast pulse risetime
• Significantly lower operating voltages (20–200 V) compared to that for clas- sical APDs or PMTs
• More stable operation conditions compared to those of classical APDs, e.g. less stringent requirements for temperature and bias stabilization
• The costs are expected to be rather low because of simple production tech- niques
The PDE average of the SiPM is, due to the dead area fraction between the cells, much lower than that of classical APDs while the PDE of the active area of one SiPM cell is actually similar or in case of APDs with high F–
factors even superior
1. SiPM prototypes suffer from a relatively high dark rate (0.2–2)MHz/mm
2at room temperature. The number of thermally gener- ated electron-hole pairs in the sensitive volume gives the ultimate lower limit.
Cooling allows one to reduce the dark count rate. For the use in PET a high dark rate is uncritical, as one is interested in signals that exceed the one–
1
The PDE of classical APDs is rather complex and depends very much on the
gain, respectively on the F–factor at the working point.
photoelectron level by a large margin while the integration window is only a few tens of nanoseconds for fast scintillators.
3 The SiPM used in the Test Setup
For our studies we used a (1 × 1) mm
2prototype SiPM developed at MEPhI and PULSAR enterprises. The used device has an n–on–p structure and is therefore less sensitive to the blue part of the emission spectrum of the LYSO scintillator. In the near future new devices with a p–on–n structure and thus with enhanced blue sensitivity will be available. The characteristics of the used SiPM are summarized in Table 1 For a more detailed explanation of the sensor itself we point the interested reader to (B. Dolgoshein, 2003).
Table 1
Specifications of the SiPM used in this study.
Parameter Value
Sensor area (1
×1) mm
2Number of individual cells 576
Active area of the sensor 25%
Peak PDE (at 540 nm) 20% (s. B. Dolgoshein (2003))
Bias voltage 52 V
−60 V
Breakdown voltage 50 V
Gain 10
4−5
·10
6Typical dark count rate at room temperature 10
6counts/mm
2/s
4 Experimental Setup
4.1 Mechanics
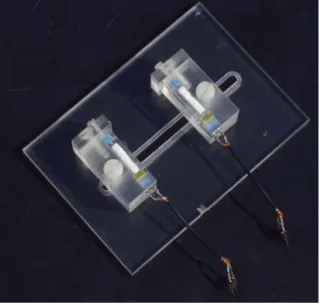
We constructed a simple mechanical support from Lucite for a good fixation and coupling of the crystal and photon detector combination (see Figure 3). In between the two crystals we placed a small
22Na–source that faked a point-like positronium source. The distance between the two detectors was 5 cm.
As scintillator crystals we used LYSO, which was provided by the company
Saint Gobain. The crystals have polished surfaces and dimensions (2 × 2 ×
15) mm
3. LYSO has a high light yield of 32000 photons/MeV and a fast decay
time of 40 nsec (Saint Gobain, 2004). Each crystal is wrapped in a dielectric
mirror foil from 3M to assure good light collection. The reflectivity of this
Fig. 3. Photograph of the detector setup used in this study. For details see text.
prototype foil is shown in Figure 4. The same foil with a (1 × 1) mm
2hole is used for an aperture and is placed between the end face of the scintillator and the photon detector. This is necessary to compensate for some of the large area mismatch between the sensitive area of the silicon photomultiplier (1 mm
2) and the four times larger end face of the scintillator. The light coupling between crystal and photon detector was improved by optical grease BC630 by Saint Gobain (refractive index 1.463).
Fig. 4. Reflectivity of the dielectric foil by 3M measured at four different positions on a sample.
4.2 Signal Readout
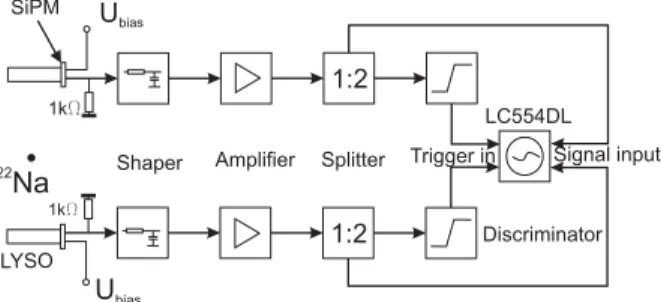
For the explanation of the electrical signal readout we refer to Figure 5. For
most of the tests we used an additional passive RC–integrator ( ∼ 1 . . . 10 nsec)
located at the SiPM in order to shape the signal. The shaped signal is routed
via a Belden 50 Ohm coaxial cable to a preamplifier MAN-1LN from Mini
Circuits. No special care was taken to further optimize the signal shape or to suppress noise.
After shaping and amplification the signal is split by a passive divider and routed to an LC554DL oscilloscope and to the input of a discriminator. The oscilloscope is used to determine the magnitude of the signal by measuring the area under the signal trace (charge) for about 300 nsec for most of the measurements. The output of the discriminator is fed via another input into the LC554DL and supplies a time information. For further analysis the time information and signal magnitude are sent via GBIP to a PC.
The scope was triggered by the coincidence of the two discriminators with a threshold of ∼ 250 mV corresponding to a few photoelectrons.
1:2
1:2
22Na Ubias
LYSO SiPM
Shaper Amplifier Splitter
Discriminator LC554DL Trigger in Signal input
Ubias
1kW 1kW
Fig. 5. Block diagram of the electronics used in this test.
5 Energy Resolution and Calibration
The pulse height distribution in Figure 6(a) shows the γ –spectrum from the
22
Na source when triggering on coincidence events. The spectrum was mea- sured with the source placed half way between the LYSO crystals. The spec- trum shows the photopeak of the 511 keV– γ ’s fully absorbed in the LYSO crystal and a contribution from Compton scattered events (Compton contin- uum). Due to the coincidence alignment condition the Compton continuum is partially suppressed and the valley between the Compton edge and the photopeak is nearly invisible. Figure 6(b) shows the
22Na spectrum in a self- triggered mode. In this case the Compton contribution is much higher and the valley well visible. For the determination of the energy resolution we fitted the photopeak in Figure 6(a) by a single Gaussian and neglected the contribution from the Compton edge. We found for the photopeak a full width at half maximum (FWHM) of about 22 %. This value, although not fully correct, is a significant improvement compared to the (35 ± 1) % FWHM we have re- ported earlier (N. Otte, 2004) and is closer to the 15 % FWHM reported by (B. Pichler, 2001) for the APD–LSO readout.
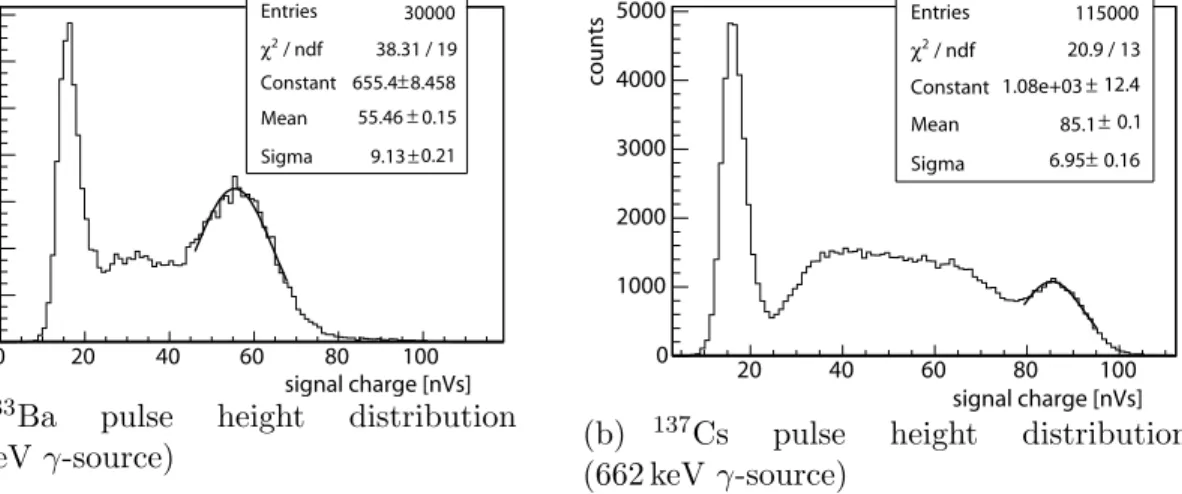
In addition we measured the energy dependent resolution as well as the energy
response by measuring also the pulse height distribution of a
133Ba– and a
137
Cs–source.
133Ba and
137Cs emit γ ’s with energies of 356 keV and 662 keV, respectively (S. Eidelman, 2004). The resulting spectra are shown in Figure 7.
The spectrum around the photopeak has been fitted by a Gaussian. In Figure 8 the peak values are plotted versus the known energy. As expected, the correla- tion between the measured signal and the incident energy is not well described by a linear function. This can be explained by saturation effects caused by the large number of fired cells in the SiPM (around 400 for the 511 keV line, as will be derived later). Also, optical crosstalk and subtle recovery time effects contribute.
counts
0 100 200 300 400 500 600 700 800
2
0.17
Entries 26739
/ ndf
χ 18.59 / 13
Constant 823.5 ± 11.24 Mean 73.28 ± 0.1 Sigma 6.7±
charge [nVs]
0 20 40 60 80 100 120
(a) with coincidence requirement.
charge [pVs]
0 50000000 100000000 150000000 200000000
counts
0 2000 4000 6000 8000 10000
0 10 20 30
0 10 20 30
(b) without coincidence requirement.
Fig. 6. Pulse height distributions of a positronium source. The distribution on the left side was measured by triggering on a coincidence of the two channels. The dashed vertical lines indicate the cuts applied in order to restrict the analysis of the time resolution to the photopeak signal. For the distribution on the right hand side a minimum amplitude in the detector channel was required. The 511 keV peak as well the 1
.275 MeV peaks are clearly visible. Note that for the right hand picture no amplifier and an additional attenuator (18dB) was used.
The gain calibration of an SiPM is done by analyzing the pulse height dis- tribution of the dark counts (see Figure 9). The integration window in this measurement was reduced to 10 nsec. As the output of a cell is standardized the number of fired cells can be derived in first order from the pulse height distribution of the dark count spectrum. We measured the gain by determin- ing the positions of the peaks. The slope of a linear fit to the peak positions in electrons vs. the number of fired cells gives the gain. For our configuration we found a gain of (2 . 1 ± 0 . 16) · 10
6.
Together with the gain of the SiPM and the preamplifier (21 . 1 ± 0 . 1) we also determined the number of cells that fired on average if one 511 keV– γ was fully absorbed in the crystal. From the
22Na pulse height distribution in Figure 6(a) we calculated that the peak position corresponds to 413 ± 20 fired cells.
Therefore, the signal should already in part be affected by saturation effects as
the used SiPM comprises 576 cells. This conclusion is based on the assumption
Entries / ndf χ2
Constant 655.4
Mean 5.546e-08 ± Sigma 9.125e-09 ±
signal charge [nVs]
0 0.02 0.04 0.06 0.08 0.1
counts
0 200 400 600 800 1000 1200
1400 Entries 30000
/ ndf
χ2 38.31 / 19 Constant 655.4 ±8.458 Mean 55.46 ± 0.15 Sigma 9.13 ± 0.21
0 20 40 60 80 100
(a)
133Ba pulse height distribution (356 keV
γ-source)
Entries / ndf χ2
Constant 1.08e+03 ± Mean 8.51e-08 ± Sigma 6.95e-09 ±
signal charge [nVs]
0.02 0.04 0.06 0.08 0.1
counts
0 1000 2000 3000 4000
5000 Entries 115000
/ ndf
χ2 20.9 / 13
Constant 1.08e+03 ± 12.4 Mean 85.1 ± 0.1 Sigma 6.95 ± 0.16
20 40 60 80 100
(b)
137Cs pulse height distribution (662 keV
γ-source)
Fig. 7. Pulse height distributions of
133Ba and
137Cs. The peaks at lower energy are caused by dark counts where, due to crosstalk, many standardized signals are produced within
1 nsec and the summed up signal is high enough to pass the discriminator threshold.
Fig. 8. Correlation between
γ–energy and signal height (in units of charge, respec- tively number of fired cell).
that the SiPM has a recovery time being significantly larger than the gate time for the charge selection.
The dependence of the SiPM signal N
SiPMon the number of photoelectrons N
pheis given by
N
SiPM= p ·
1 − e
−Nphep, (1) where p is the number of cells of the SiPM.
We want to stress again that this formula is based on the assumption that the recovery time of the fired cells is much longer than the optical decay time of the scintillator and recovery effects are therefore be neglected.
From equation 1 we calculate for 413 fired cells at the photopeak a mean
Entries Mean RMS
/ ndf χ2
Constant
Mean 7.259e-12 ± Sigma 6.66313 ±
signal charge [pVs]
0.1 0.2 0.3 0.4 0.5
counts
0 1000 2000 3000 4000 5000 6000
7000 Entries 100000
Mean 1.349e-11 RMS 9.912e-12
/ ndf
χ2 17.98 / 7 Constant 6771 ± 42.33 Mean 7.259 ± 0.004 Sigma 0.666± 0.005
10 20 30 40 50
1phe
2phe
3phe ...
Fig. 9. Spectrum of dark count pulses in the used SiPM. Each peak corresponds to a different number of cells fired per event. The distribution was measured without any preamplifier but the passive splitter still included. The insert box lists the fit result for the first peak.
number of ∼ 730 photoelectrons. This number includes both primary pho- toelectrons generated by scintillation photons as well as electrons generated by optical crosstalk photons. Optical crosstalk within the SiPM leads to a higher than expected output signal as additional cells fire. The origin of opti- cal crosstalk has been traced to secondary photons generated in the avalanche breakdown of fired cells (A. Lacaita, 1993). These photons can be absorbed in neighboring cells and fire them in addition. The pulse height distribution of the dark count in Figure 9 is a direct effect of optical crosstalk. Thus this spectrum is the probability distribution that none, one, two, three and so on cells fire in addition to one primary fired cell. By using a simple Monte Carlo simulation (neglecting recovery effects of the cells) we corrected for the opti- cal crosstalk. In the simulation the crosstalk is implemented as a probability distribution, following the pulse height distribution of the dark counts. Ac- cording to that distribution the number of cells which in principle could fire in addition due to crosstalk is determined for each primary fired cell. In a sec- ond step every crosstalk cell is associated with a randomly picked cell of the SiPM which is then marked as fired if it has not been fired earlier. A recovery of a pixel once fired was not taken into account in the Monte Carlo.
As an outcome of that simulation we found that the number of primary pho- toelectrons should have been around 520. This is in fairly good agreement with a simple estimate from the scintillation light yield of 16650 photons for a 511 keV– γ , a typical light collection onto the SiPM of around 25 ± 5 % and a mean PDE of around 12 % with an estimated error of 3 % (due to the spectral mismatch) of (500 ± 180) photoelectrons.
Monte Carlo simulations predict an energy resolution of 7% FWHM assum-
ing an ideal scintillator with a Gaussian like light distribution over time with
fluctuations proportional to
N
phe. Even for optimal light collection one com- monly finds for high light yield scintillators that the resolution does not follow strictly the
N
pherule (W. W. Moses, 2002). We conclude that the 22 % resolution has its origin either in crystal scintillation non-uniformities or non- uniform light collection due to the aperture and the large area mismatch.
Further studies are needed for the clarification of the 22 % resolution.
6 Influence of the Recovery Time
Figure 6(b) shows besides the prominent 511 keV peak indications of the 1 . 275 MeV line and the corresponding Compton edge (note that the photo efficiency of LYSO around 1200 keV is already highly suppressed). Using the above calibration we find a number of fired channels exceeding 576. This can only be explained if fired SiPM cells can recover already within the gating time and are therefore sensitive to late emitted photons from the LYSO. In a simple test the SiPM was illuminated by an intense laser pulse of very short duration and the onset of the noise rate and amplitude inspected. Already around 60 nsec small noise pulses became visible with later ones increasing in amplitude. In a second test the SiPM was illuminated first by the laser pulse to fire all cells and than illuminated by a delayed light pulse showing again the onset of a small signal after about 60 nsec. After about 500 nsec the full amplitude was reached. Further studies with better test equipment are needed because there might be two effects be present simultaneously. After a short delay time the cell gain is still reduced but the avalanche probability is reduced as well. Also, optical crosstalk should be affected.
Further tests are needed but complex recovery effects have to be considered when integrating scintillation light over a duration exceeding the partial re- covery. Naively speaking, the 425 fired cells are based on the assumption of standardized cell pulses. Due to partial recovery resulting in lower cell ampli- tudes the number of fired cells must be considerably larger than 425 and in turn the number of detected photoelectrons also larger than 520.
7 Time Resolution
For the measurement of the time resolution we only accepted events within the one sigma limit around the photopeak in each channel (see vertical lines in Figure 6(a)). The selection of accepted events was done offline.
One series of tests was performed with a constant fraction (CF) discriminator
triggering on the rising edge of the signal. Between the SiPM output and the preamplifier input we inserted a passive element to shape the signal. We varied the time constant of the shaping element and the delay of the constant fraction discriminator. The best time resolution for one detector channel of (2 . 24 ± 0 . 03) ns FWHM was achieved without shaping and a delay of 7 nsec. We did not correct for the time resolution of the electronics, which was 200 psec and thus can be neglected.
Entries 40800
/ ndf
χ2 762.8 / 46 Constant 4295 ±28.62 Mean 6.541e-10 ± 4.564e-12 Sigma 9.077e-10 ± 3.977e-12
time difference [ns]
-0.4 -0.2 0 0.2 0.4 0.6
x10-8
counts
0 500 1000 1500 2000 2500 3000 3500 4000 4500
Entries 40800
/ ndf
χ2 762.8 / 46 Constant 4295 ±28.62 Mean 0.654 ± 0.005 Sigma 0.908 ± 0.004
-4 -2 0 2 4 6
Fig. 10. Distribution of time differences of the two detector channels. For this mea- surement the time was measured by triggering on the first photoelectron of each signal with a leading edge discriminator.
We also tried a different timing method by triggering on half height of the first photoelectron in the detector signal with a normal leading edge discrimi- nator (LeCroy 621AL). Because of the well defined single photoelectron signal of the SiPM this is a very promising and cheaper method compared to a CF–discriminator, which is not so simple to realize as an IC. As an addi- tional trigger condition we required a minimum signal amplitude of a few tens of photoelectrons. In this way we triggered only on γ ’s. With this setup we achieved a 39% improvement in time resolution compared to the constant frac- tion method. The distribution of the time differences between the two channels is plotted in Figure 10. From the distribution we derive a time resolution for a single detector channel of (1 . 51 ± 0 . 07) ns FWHM. This is comparable to the CF timing in classical APD-LSO combinations in PET (B. Pichler, 2004).
The very similar resolution with a SiPM where one detects even less then 20%
of the photoelectrons compared to an APD can be explained by the fact that one triggers in SiPMs on the well shaped signal of the first photoelectron.
8 Position Resolution
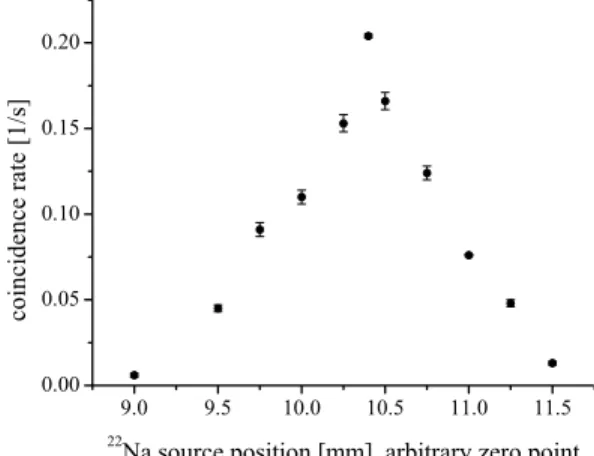
The sensitivity of the detector setup on the position of the
22Na γ –source was
tested by measuring the coincidence rate versus the displacement of the γ –
source. For this test we set the distance between the two crystals to 5 cm and placed the radioactive sample in between. Then we moved the
22Na sample perpendicular to the long side of the crystals. The result is shown in Figure 11. One expects a linear rise and fall of the coincidence rate as the source moves through the setup. The expected behavior is nicely reproduced by our measurement. The full width at half maximum of the coincidence rate is 1 mm, i.e. only limited by the size of the crystals.
Fig. 11. Coincidence rate as function of the
22Na
γ-source position.
9 Conclusions and Discussion of the Results
In this study we have confirmed the good prospects of using SiPMs as new photon detectors in PET.
In detail the following conclusions can be drawn from the studies
(1) The 511 keV– γ energy resolution of about 22 % FWHM was found to be somewhat worse compared to that achieved with larger classical APDs with a 1:1 coupling to small crystals. The achieved energy resolution is remarkable, as the scintillator was coupled to a SiPM, which is four times smaller than the end-face of the crystal, and the 511 keV– γ signal corresponds on average to about 500 photoelectrons. Nevertheless, there remains a discrepancy between the resolution predicted by Monte Carlo simulations and the observed value. We explain this mainly by either
• a non-uniform light yield of the tested crystals originating in part from the inhomogeneous cerium doping in the crystals
• by some uneven light collection at the end close to the SiPM
• by possibly a contribution of the dead time recovery effects.
The first deficiency can be improved by growing crystals at different pa-
rameters while the second problem can normally be solved by a mix of
diffuse and specular reflectors and a larger SiPM.
(2) The impact of recovery of the fired cells is not fully understood and needs more studies. Simple measurements show that cells start to become again sensitive within less than 60 nsec, i.e. while the LYSO crystals still emits light. The signals after a few decades of nanoseconds are not as large as the standardized ones and their amplitude recovers with the time gap between refiring. The probability of a second avalanche breakdown is likely reduced in the early phase of recovery
2. The impact of recovery and the dependence of gain and avalanche breakdown as function of delay need further studies and a better understanding for the light detection when the scintillator emission decay time is comparable to the recovery time. Nevertheless the effect does not at all prevent the use of SiPMs in PET applications.
(3) Provided one can tolerate some degradation of the optimal energy reso- lution, the use of SiPMs of much smaller area than the crystal end faces offers room for easy wiring in case of large matrices of pixels. The use of the aperture defining end reflector results only in a small loss of photons.
Obviously one should choose a SiPM with a cell number exceeding sig- nificantly the number of expected photoelectrons (possible disadvantages are an increased dead area and in turn a lower PDE. Thus optimization is required).
(4) Quite some improvement in resolution should also be possible when using p-on-n structures with better matched spectral sensitivity and higher PDE in the blue wavelength region. A PDE of ≥ 35 % is not excluded in future designs.
(5) The reduction in dead area between cells might result in a higher crosstalk rate. This is uncritical for the use in PET. For other applications this might require other measures to reduce the chance of avalanche generated photons to pass into other cells such as optical separators or designs that can be operated efficiently at lower gains. A simple signal amplification per pixel, possibly integrated on the chip, might be sufficient to work with a gain, say 5 · 10
4. . . 10
5.
(6) As mentioned above, the high noise rate is irrelevant for PET applica- tions. Even at 1 MHz dark count rate/1 mm
2SiPM a signal of a few hundred fired cells is not at all influenced. Cooling for noise reduction is unnecessary.
(7) The high intrinsic gain of 10
5− 10
6is a big advantage for PET applica- tions. As a result of the high gain, the detector will be much less sensitive to pickup. Compared to devices using classical APDs the noise immunity is typically 2–4 orders of magnitude better. Therefore the shielding re- quirements are much less demanding. This is of quite some importance
2