New Results from a Test of Silicon Photomultiplier as Readout for PET
A. Nepomuk Otte
∗, Jo¨elle Barral
†, Boris Dolgoshein
§, J¨urgen Hose
∗, Sergei Klemin
¶, Eckart Lorenz
∗, Razmick Mirzoyan
∗, Elena Popova
§, Masahiro Teshima
∗∗
Max Planck Institute for Physics F¨ohringer Ring 6, 80805 Munich, Germany
†
Ecole Polytechnique, 91128 Palaiseau, France
§
Moscow Engineering and Physics Institute, Kashirskoe Shosse 31, 115409 Moscow, Russia
¶
”Pulsar” Enterprise, Okruzhnoj Proezd 27, Moscow, Russia
Abstract— The silicon photomultiplier (SiPM) is a novel photon detector based on Geiger mode operating avalanche photodiodes.
In this paper we present experimental results which show that SiPMs can be used in positron emission tomography (PET). As scintillator we use the newly developed LYSO material, which has very similar characteristics to the widely used LSO. With our setup we measure an energy resolution of (21.5±0.5)% and a coincidence time resolution of(1.51±0.07)ns, both full width at half maximum. A significant improvement in time resolution could be achieved by triggering on the first photoelectron in the signal.
We also present the coincidence rate of two detector channels vs.
the position of a small pointlike22Napositronium source.
Index Terms— positron emission tomography (PET), silicon photomultiplier (SiPM), lutetium yttrium orthosilicate (LYSO), avalanche photo diode (APD).
I. INTRODUCTION
P
OSITRON emission tomography (PET) scanners are pow- erful tools for the study of in vivo physiological processes.Current R&D trends aim at building smaller, more compact and less expensive devices with an improved resolution and a simpler mode of operation. To achieve higher spatial resolution it might be of advantage to combine a PET scanner with an NMR scanner in order to simultaneously acquire information about morphological structure and physiological processes. To comply with these requirements, a reliable and cheap photon detector is needed which is also insensitive to magnetic fields and pickup.
The SiPM is a novel approach towards an inexpensive high efficient photon detector that is developed by several groups [1], [2] and [3]. First suggestions to use the SiPM as photon sensor in medical imaging can be found in e.g. [4], but no specific study has been performed so far. We have started a study focusing on this subject and presented first results in [5].
We came to the conclusion that SiPM can in principle be used in PET. We have recently improved our experimental setup and can now demonstrate the full feasibility of using SiPM in PET.
In this paper we first give a short introduction to the working principle of SiPMs. Then we discuss our setup and present experimental results on energy, time and position resolution.
Corresponding Author: A. Nepomuk Otte email: otte@mppmu.mpg.de
We close with a discussion on the prospects of SiPMs in PET and point out some special issues and advantages of the SiPM as readout element.
II. SILICONPHOTOMULTIPLIER
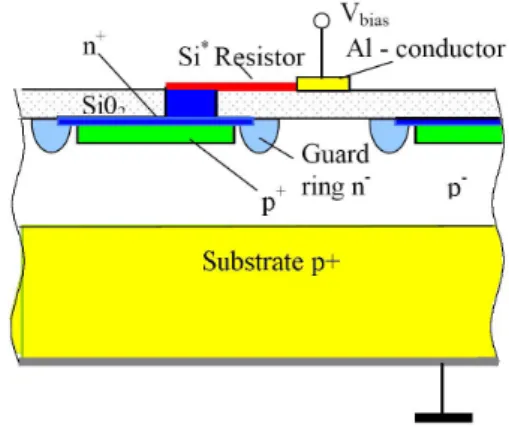
A SiPM is composed of an array of small APD cells combined to form a macroscopic unit (typically 500 to 4000 cells per mm2). In the following we refer to one APD in the macroscopic unit as ”cell”. Each cell operates in limited Geiger mode, i.e. a few Volt above breakdown voltage. In this working mode an electron initiates an avalanche confined to a cell (the electron ”triggers” the cell). The breakdown is quenched by limiting the current through the junction with a polysilicon resistor which is connected to the cell (s. Fig. 1). For each Geiger breakdown the output signal is always the same.
Fig. 1. Cross section through the topology of one SiPM cell. On the right side a part of a neighboring cell is shown. Photons are incident from the top.
(Picture taken from [6].)
In a SiPM the independent operating APD cells are con- nected to the same readout line. For low light fluxes the output signal is in first order the sum of all fired cells, thus compensating for the missing dynamic range of a single cell. In reality, the process is more complex because of the recovery time of the cells and the influence of dark counts.
The main domain of operation for SiPMs is in photon flux levels 1photon/cell/recovery time.
The photon detection efficiency (PDE) of current SiPM prototypes is influenced by several contributions of which the most important ones are:
• the fraction of the active area of one cell
• the quantum efficiency of Si (QE)
• the probability to initiate an avalanche breakdown (Geiger efficiency)
• the fraction of active cells
The active area fraction, limited by the dead area around each cell, depends on the construction and ranges typically between 30%-70% of the total area. Typical values of PDEs of current prototype SiPMs are comparable to those of conventional bial- kali photomultipliers. It is expected that the photon detection efficiency for SiPMs will go up in the near future as new ideas still have to be investigated.
The main advantages of SiPMs compared to linear APDs are:
• standardized output pulses for single photo electrons
• low sensitivity towards pickup
• large intrinsic gain of 105–106
• no need for sophisticated preamplifiers
• fast pulse rise time
• significantly lower operating voltages 20–100 V
• a more stable operating point asking for less stringent requirements on bias stabilization
• the expected costs are much lower because of simpler production
SiPM prototypes suffer from a relatively high dark count rate (0.2–2) MHz/mm2at room temperature. For PET this is uncrit- ical, as one expects large signals from many photoelectrons in a short integration window of a few tens of nanoseconds if a fast scintillator is used.
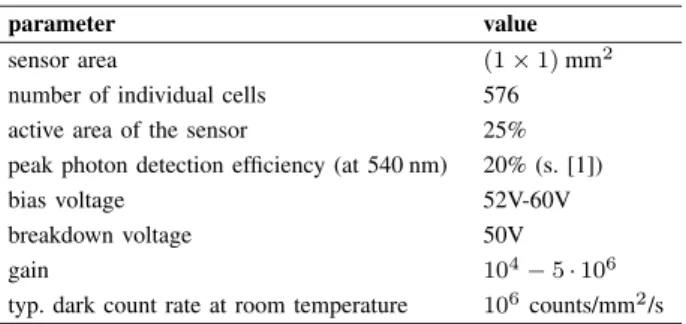
For our study we use a (1×1) mm2 prototype SiPM de- veloped at MEPhI and PULSAR enterprise. Prototypes with sizes up to (3×3) mm2 are also available. The used device has an-on-pstructure and is therefore less sensitive to the blue part of the emission spectrum of the used scintillator. In the near future new devices with a p-on-nstructure and thus with enhanced blue sensitivity will be available. The characteristics of this SiPM are summarized in Tab. I. For a more detailed explanation of the sensor itself we point the interested reader to [1].
TABLE I
SPECIFICATIONS OF THESIPMUSED IN OUR STUDY.
parameter value
sensor area (1×1)mm2
number of individual cells 576
active area of the sensor 25%
peak photon detection efficiency (at 540 nm) 20% (s. [1])
bias voltage 52V-60V
breakdown voltage 50V
gain 104−5·106
typ. dark count rate at room temperature 106counts/mm2/s
Fig. 2. Picture of the detector setup used in this study. The two LYSO crystals are wrapped in a reflective foil produced by 3M and in tape (white) for fixation.
Small plastic screws press the crystals onto the photon detector surfaces. One coaxial cable per detector element serves both as power supply line and as signal readout line.
III. EXPERIMENTALSETUP
A. Mechanics
We constructed a mechanical support made of lucite for a good fixation and coupling of the crystal and photon detector combination (s. Fig. 2). In between the two crystals we placed a 22Na–source in order to simulate a point like positronium source. The distance between the two detectors was 5 cm.
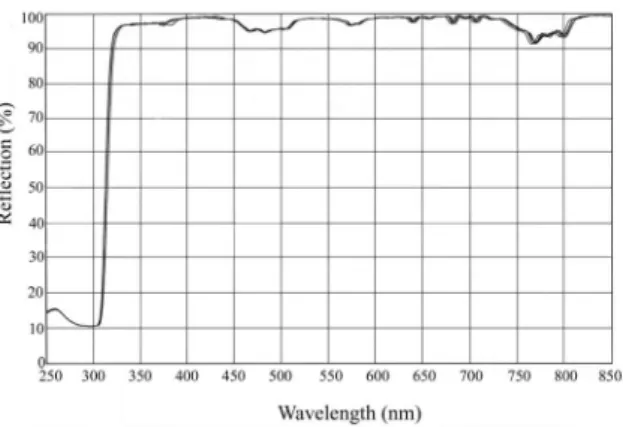
As scintillator crystals we used LYSO which was provided by Saint Gobain. The crystals have polished surfaces and dimensions 2 mm×2 mm×15 mm. LYSO has a high light yield of 32,000 photons/MeV and a fast decay time of 40 ns [7]. The crystals are wrapped in a dielectric mirror foil from 3M to assure good light collection. The reflectivity of this prototype foil is shown in Fig. 3. The same foil is used for an aperture placed between the scintillator and the photon detector.
This is necessary in order to compensate for the area mis- match between the sensitive area of the silicon photomultiplier (1 mm2) and the four times larger endface of the scintillator.
The light coupling between crystal and photon detector has been improved by the use of optical grease BC630 from Saint Gobain.
B. Signal Readout
For the explanation of the electrical signal readout we refer to Fig. 4. It is worth mentioning that only one common coax cable is needed for both bias supply and signal readout. Directly behind the SiPM, a passive RC–integrator element with a time constant of a few nanoseconds shapes the signal. The shaper is followed by a Hamamatsu preamplifier 9502. No special care was taken to select this preamplifier; it is therefore subject to further optimization.
Fig. 3. Reflectivity of the dielectric 3M foil measured at four different positions on a sample.
LSO SiPM
22Na 1:1
PreAmp
1:1
Splitter
LC554DL
Shaper Discriminator
Fig. 4. Block diagram of the electronics used in this test.
After shaping and amplifying, the signal is split by a passive signal divider and routed to an LC554DL oscilloscope and to the input of the discriminator. The oscilloscope is used to determine the magnitude of the signal by measuring the area enclosed by the signal and the time axis (charge). The output of the discriminator is fed into the LC554DL and supplies a time information. For further analysis the time information and signal magnitude is sent via GBIP to a PC.
The trigger condition for the DAQ is a coincidence of the two discriminator outputs and a minimum value in the detector signal under study.
Entries 26739
/ ndf
χ2 18.59 / 13 Constant 823.5 ±11.24 Mean 7.328e-08 ± 1.1e-10 Sigma 6.712e-09 ± 1.682e-10
signal charge [Vs]
0.02 0.04 0.06 0.08 0.1 0.12
x10-6
counts
0 100 200 300 400 500 600 700 800
Entries 26739
/ ndf
χ2 18.59 / 13 Constant 823.5 ±11.24 Mean 7.328e-08 ± 1.1e-10 Sigma 6.712e-09 ± 1.682e-10 22 Sodium pulse height distribution
Fig. 5. Pulse height distribution of22Na. The distribution was measured by triggering on a coincidence between the two channels. The vertical dashed lines indicate the cuts applied in order to determine the time resolution.
IV. ENERGYRESOLUTION ANDCALIBRATION
The pulse height distribution in Fig. 5 depicts a 511 keV γ-spectrum. It was measured with the 22Na source placed between the LYSO crystals in our setup. The events in the distribution on the left side of the peak are due to Compton scattered events in the crystal (Compton continuum). The peak itself is caused by fully absorbed unscattered 511 keV γ’s in the LYSO crystal (photopeak).
For determination of the energy resolution we fitted the photopeak with a Gaussian and found the full width at half maximum (FWHM) to be(21.5±0.5)%. This is a significant improvement compared to the(35±1)% FWHM we reported on earlier [5] and is close to the 15% FWHM reported by [8]
for the APD-LSO readout.
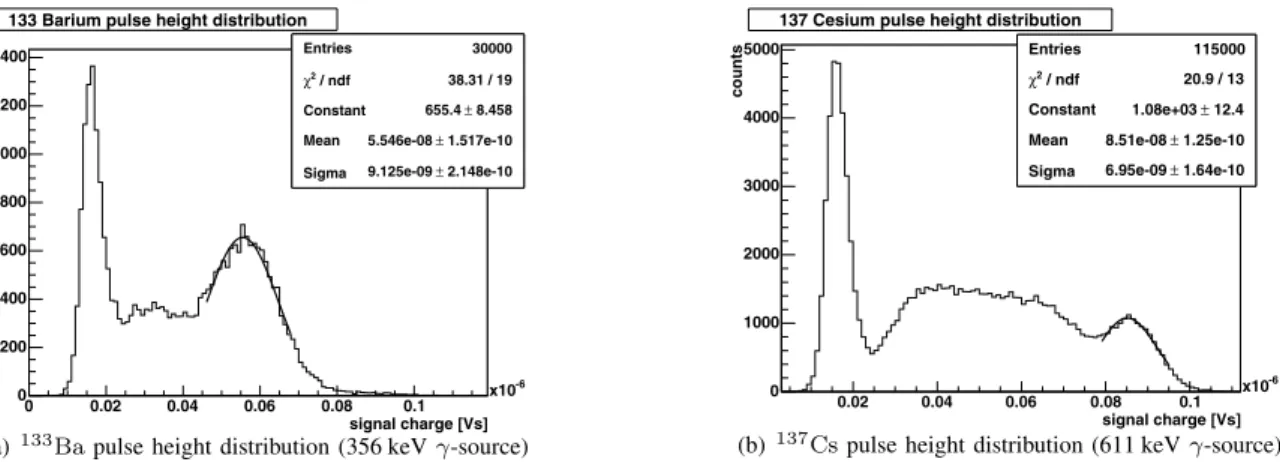
We calibrated the detector setup by measuring also the pulse height distribution of a 133Ba- and a 137Cs-γ source. 133Ba and 137Cs emit γ’s with energies of 356 kV and 611 kV, respectively [9]. The resulting pulse height distributions are plotted in Fig. 6.
The photopeak of each spectrum has been fitted by a Gaus- sian and then the mean of each fit has been plotted versus the known γ-energy in Fig. 7. The energy response might be affected by a saturation effect caused by the large number of fired cells in the SiPM (around 400, as will be derived later).
Fig. 7. Energy calibration of one detector channel.
The gain calibration of a SiPM is achieved by analyzing the pulse height distribution of the dark counts (s. Fig. 8). As the output of a cell is standardized, the number of fired cells can be easily derived from the pulse height distribution of the dark count spectrum. We measured the gain by determining the positions of the peaks. The slope of a linear fit to the peak positions in electrons vs. the number of fired cells gives the gain. For our configuration the gain was (2.1±0.16)·106.
From the gain of the SiPM and the preamplifier(21.1±0.1) we also determined the number of cells that on average fired if one 511 keV gamma was fully absorbed in the crystal. For the 22Na pulse height distribution in Fig. 5 we calculated (413±3)fired cells for the mean of the photopeak. The signal is already close to saturation as our SiPM is composed of 576 cells. The dependence of the SiPM signal NSiPMon the number
Entries 30000 / ndf
χ2 38.31 / 19 Constant 655.4 ± 8.458 Mean 5.546e-08 ± 1.517e-10 Sigma 9.125e-09 ± 2.148e-10
signal charge [Vs]
0 0.02 0.04 0.06 0.08 0.1
x10-6
counts
0 200 400 600 800 1000 1200
1400 Entries 30000
/ ndf
χ2 38.31 / 19 Constant 655.4 ± 8.458 Mean 5.546e-08 ± 1.517e-10 Sigma 9.125e-09 ± 2.148e-10 133 Barium pulse height distribution
(a)133Bapulse height distribution (356 keVγ-source)
Entries 115000
/ ndf
χ2 20.9 / 13 Constant 1.08e+03 ±12.4 Mean 8.51e-08 ± 1.25e-10 Sigma 6.95e-09 ± 1.64e-10
signal charge [Vs]
0.02 0.04 0.06 0.08 0.1
x10-6
counts
0 1000 2000 3000 4000
5000 Entries 115000
/ ndf
χ2 20.9 / 13 Constant 1.08e+03 ±12.4 Mean 8.51e-08 ± 1.25e-10 Sigma 6.95e-09 ± 1.64e-10 137 Cesium pulse height distribution
(b)137Cspulse height distribution (611 keVγ-source)
Fig. 6. Pulse height distributions of133Baand137Cs. These spectra were measured to derive the energy calibration of the setup. The peak on the left side in both distributions is caused by dark count events, in which many cells fired in coincidence (due to optical crosstalk).
Entries 100000
Mean 1.348e-11 RMS 9.91e-12
/ ndf
χ2 17.98 / 7
Constant 6771 ± 42.33 Mean 7.259e-12 ± 4.113e-15 Sigma 6.663e-13 ± 5.257e-15
signal charge [Vs]
0.1 0.2 0.3 0.4 0.5
x10-10
counts
0 1000 2000 3000 4000 5000 6000
7000 Entries 100000
Mean 1.348e-11 RMS 9.91e-12
/ ndf
χ2 17.98 / 7
Constant 6771 ± 42.33 Mean 7.259e-12 ± 4.113e-15 Sigma 6.663e-13 ± 5.257e-15 SiPM dark counts
1phe
2phe
3phe ...
Fig. 8. Dark count pulse height distribution of the SiPM. The distribution was measured without any preamplifier but the passive splitter still included.
The box gives the fit result for the first peak.
of primary photoelectronsNphe is given by NSiPM=p·
1−e−Nphep
, (1)
where pis the number of SiPM cells. This equation neglects optical crosstalk within the SiPM which leads to an output signal which is higher than expected, as additional cells fire.
The origin of optical crosstalk are photons generated during the avalanche breakdown of one cell [10]. These photons can be absorbed in neighboring cells and fire them. Neglecting the contribution of crosstalk one might come to the conclusion that the mean number of photoelectrons in the photopeak is about 730 when using equation 1. After correcting for optical crosstalk by performing Monte Carlo simulation we found the number of primary photoelectrons to be 520.
V. TIMERESOLUTION
For the measurement of the time resolution we only accepted events within the one sigma limit around the photopeak in each channel (s. vertical lines in Fig. 5). The selection was done offline.
One series of tests was performed with a constant fraction discriminator triggering on the rising edge of the signal. Be- tween the SiPM output and the preamplifier input we inserted a passive element for signal shaping purposes. We varied the time constant of the shaping element and the delay of the constant fraction discriminator. The best time resolution achieved in this configuration was (2.24±0.03)ns FWHM for one detector channel. We did not correct for the time resolution of the electronics, which was 200 ps and could therefore be neglected.
Entries 40800
/ ndf
χ2 762.8 / 46 Constant 4295 ±28.62 Mean 6.541e-10 ± 4.564e-12 Sigma 9.077e-10 ± 3.977e-12
time difference [s]
-0.4 -0.2 0 0.2 0.4 0.6
x10-8
counts
0 500 1000 1500 2000 2500 3000 3500 4000
4500 Entries 40800
/ ndf
χ2 762.8 / 46 Constant 4295 ±28.62 Mean 6.541e-10 ± 4.564e-12 Sigma 9.077e-10 ± 3.977e-12 time resolution with leading edge discriminator
Fig. 9. Distribution of time differences of the two detector channels. For this measurement the time was measured by triggering on the first photoelectron of each signal with a leading edge discriminator.
We also tried a different timing method by triggering on the first photoelectron in the detector signal. This is possible because of the well defined single photoelectron signal due to the standardized output signal of one cell of the SiPM. For this test we replaced the constant fraction discriminator by a leading edge discriminator (LeCroy 621AL) and reduced the discriminator threshold to the single photoelectron level. As an additional trigger condition we required a minimum signal am- plitude of about 50 photoelectrons, thus triggering exclusively onγ-events. With this setup we achieved a 39% improvement in time resolution compared to the constant fraction method. The distribution of the time differences between the two channels is plotted in Fig. 9. From the distribution we derive a time
resolution of a single detector channel of(1.51±0.07)ns. This is comparable to APD-LSO combinations in PET [11].
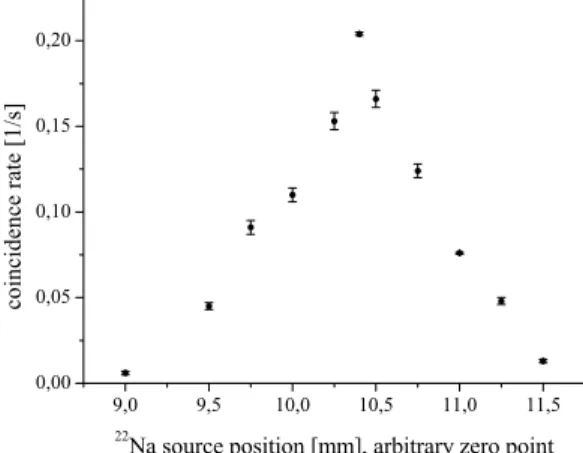
Fig. 10. Coincidence rate in dependence on the position of a22Naγ-source.
VI. POSITION RESOLUTION
The sensitivity of the detector setup on the position of the 22Na γ-source was tested by measuring the coincidence rate versus the position of the γ-source. For this test we set the distance between the two crystals to 5 cm and placed the radioactive sample in between. Then we moved the 22Na sample perpendicular to the long side of the crystals. The result is shown in Fig. 10. One expects a linear rise and fall of the coincidence rate as the source moves through the setup. The expected behavior is well reproduced by our measurement. The full width at half maximum of the coincidence rate is 1.2 mm, i.e., limited only by the size of the crystals.
VII. CONCLUSION
In this study we have proven for the first time the possibility of applying the SiPM as a new photon detector in PET.
The energy resolution could be significantly improved com- pared to our preliminary results and is now comparable to a configuration in which APDs are used as photon detectors.
This is in fact remarkable as the scintillator was coupled to a SiPM which is four times smaller than the endface of the crystal, and the signal recorded contained on average about 500 photoelectrons. The main reason for this is the large intrinsic gain of a SiPM (∼106).
Nevertheless, the separation of the Compton edge from the photopeak is not very well, which is important for some applications of PET. The reason for this might be the large number of cells which on average fire per absorbed γ. We derived 400 fired cells, which is close to the 576 available cells in the SiPM. The situation can be improved by using a SiPM with a larger number of cells. A SiPM with twice the number of cells per unit area will be sufficient to avoid the saturation effect.
In this context it is important to note that a total number of detected photoelectrons of about 500 perγ-event is sufficiently
large if the SiPM is used as a readout element in PET. This is due to the large intrinsic gain and the standardized single cell signals. Because of that the signal resolution is not limited by electronic noise but mainly by the statistical nature of the signal.
The apparent large dark count rate of about106counts/sec/mm2 at room temperature is only of minor importance, as the integration window is only some 100 ns wide. Taking the rise of dark counts proportional with sensor area into account, it might not be of much use trying to use larger SiPMs to compensate the area missmatch between crystal endface and photon detector.
Using the standardized large single cell signals we were also able to show that a significant improvement in timing could be achieved if one is triggering on the first photoelectron in the signal. This has several advantages:
• With SiPMs it is in principle possible to achieve time resolutions in the order of 100 ps or better [1], i.e., one is limited only by the intrinsic time resolution of the SiPM.
• It is not necessary to use integrated circuits with constant fraction discriminators.
• The time information of ∼100ps can be exploited for better position resolution.
In summary, we can say that the SiPM is a photon detector concept which, although at present in its prototype phase, can already fully replace APDs and conventional PMTs in PET.
For the combination of PET with NMR, the SiPM has the advantages of:
• insensitivity to magnetic fields
• low sensitivity to pickup
• compactness
Moreover, the production costs of SiPMs are much lower compared to other photon detectors, thus reducing the costs of PET devices significantly.
Apparent drawbacks as the currently low photon detection efficiency, high dark rates and optical crosstalk only play a minor role in PET.
ACKNOWLEDGMENT
The authors would like to thank L. Weiss for producing the mechanical support for the crystal SiPM combination. The LYSO crystals and optical grease were provided by F. Kniest from Saint Gobain. We are grateful that S. Rodriguez and P.
Liebig were carefully reading and correcting this manuscript.
I. Wacker kindly scanned and prepared the reflectivity plots of the 3M foil.
REFERENCES [1] B. Dolgoshein et al. NIM A 504(2003), p. 48–52 [2] D. Bisello et al.NIM A 367(1995) p. 212–214 [3] V. Golovin et al. NIM A 518(2004), p. 560–564 [4] A. V. Akindinov et al.NIM A 387(1997), p. 231–234 [5] N. Otte et al. to be published inNucl. Phys. B(2004) [6] P. Buzhan et al. ICFA(Fall 2001),
http://www.slac.stanford.edu/pubs/icfa/
[7] Saint-Gobainhttp://www.saint-gobain.com [8] B. Pichler et al.IEEE TNS 48(2001), p. 1391–1396 [9] S. Eidelman et al.Phys. Lett. B 592, 1 (2004)
[10] A. Lacaita et al.IEEE TED Vol 40 No. 3(1993), p. 577–582 [11] B. Pichler et al.Phys. Med. Biol. 49(2004), p. 4305–4319