FIELAX Gesellschaft für wissenschaftliche Datenverarbeitung mbH
Schleusenstr. 14, D-27568 Bremerhaven, GERMANY
Fon: +49 (0)471 30015-0, Fax: +49 (0)471 30015-22, Mail: info@fielax.de
Marine Mammals Tracking - MMT
Processing and Delivery report
Client: Dr. Horst Bornemann (AWI) Contractor: FIELAX GmbH
Contact:
FIELAX Gesellschaft für wissenschaftliche Datenverarbeitung mbH Schleusenstraße 14, D-27568 Bremerhaven, GERMANY
Fon: +49 (0)471 30015-0, Fax: +49 (0)471 30015-22, Mail: info@fielax.de
Ref.: MMT_processing_report_2018.pdf Vers.: 1 Date: 29/01/2019 Status: final
Content
1 Introduction ... 3
2 Workflow ... 3
2.1 Data retrieval ... 3
2.2 Data processing ... 4
3 Processing Report ... 6
3.1 File description ... 6
3.2 Received positions and their quality ... 7
3.3 Dive, differentiated by depth ... 8
3.4 Dive, differentiated by duration ... 8
3.5 maximum diving depths ... 8
3.6 Dives, at surface behavior ... 8
3.7 Dives, time at surface, relative ... 9
3.8 Dive times, differentiated by temperature ... 9
3.9 Dive times, differentiated by depth ... 9
3.10 Minimum and maximum temperatures according to depth ... 10
4 Appendix ... 10
4.1 Location accuracy classes ... 10
4.2 Maps and histograms of processed Ross seals ... 11
4.3 Maps and histograms of processed Weddell seals ... 12
1 Introduction
In January 2018, two Ross seals (Ommatophoca rossii) were equipped with ARGOS Platform Transmitter Terminals (PTTs) during the RV “Polarstern” cruise PS111 (ANT-XXXIII/2) in the southern Atlantic Ocean / Eastern Weddell Sea. Additionally, five Weddell seals (Leptonychotes weddellii) were equipped in February in the Weddell Sea. The ARGOS satellite system provides positioning information during transmission and enables the download of different processing-level products via their web-interface.
Two types of PTTs were used:
•
SPLASH-PTTs were used for the two Ross seals. They are capable of measure various dive activities like duration and depths, the temperature at defined depth levels and the general immersion time of the sensors.
•
SPOT-PTTs were used for the five Weddell seals. They deliver less detailed information on the dive activities like the time the sensors were immerged and the temperature of different time intervals.
2 Workflow
2.1 Data retrieval
The data were downloaded from the website (https://wildlifecomputers.com/) as CSV-Files for
each PTT separately. Due to a change of the program affiliation of the used transmitters on 30
June 2018 by the PI, there has been a break in the datasets. That made it necessary to merge
the new incoming data together with the “old” datasets before further processing.
2.2 Data processing
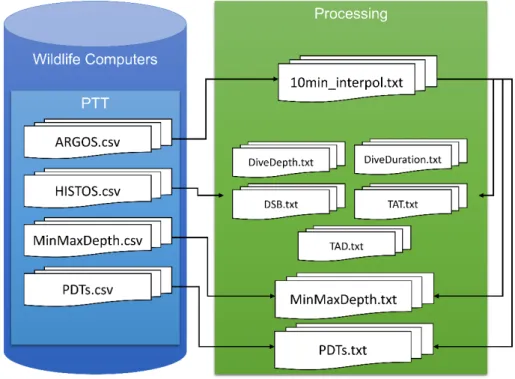
For the processing of the SPLASH-PTTs, the information is extracted from the files Argos.csv, Histos.csv, MinMaxDepth.csv and PDTs.csv. The workflow is presented in Figure 1.
Figure 1: Workflow of the SPLASH-PTT Processing
For the processing of the SPOT-PTTs, only the files Argos.csv and Histos.csv are used. The workflow is presented in Figure 2.
Figure 2: Workflow of the SPOT-PTT Processing
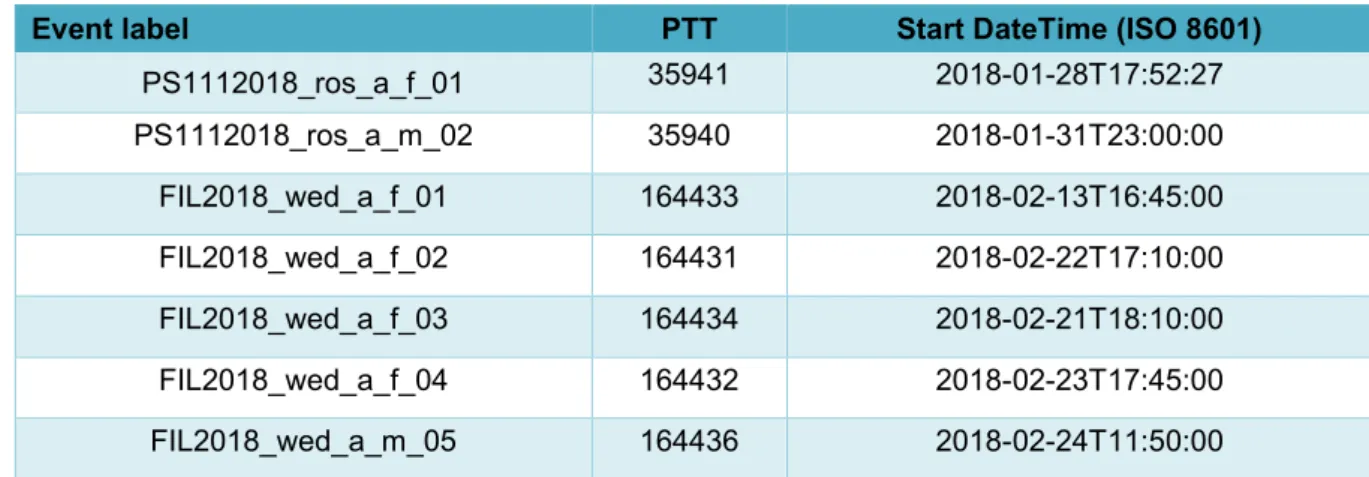
The datasets of each PTT were excised according to provided starting date/time after the anesthesia of the animals and subsequent fitting of the instruments. The following dates/times provided by the PIs determined the start of valid data (Table 1).
Table 1: Start date/time for the used PTTs
Event label PTT Start DateTime (ISO 8601)
PS1112018_ros_a_f_01 35941 2018-01-28T17:52:27
PS1112018_ros_a_m_02 35940 2018-01-31T23:00:00
FIL2018_wed_a_f_01 164433 2018-02-13T16:45:00
FIL2018_wed_a_f_02 164431 2018-02-22T17:10:00
FIL2018_wed_a_f_03 164434 2018-02-21T18:10:00
FIL2018_wed_a_f_04 164432 2018-02-23T17:45:00
FIL2018_wed_a_m_05 164436 2018-02-24T11:50:00
3 Processing Report
3.1 File description
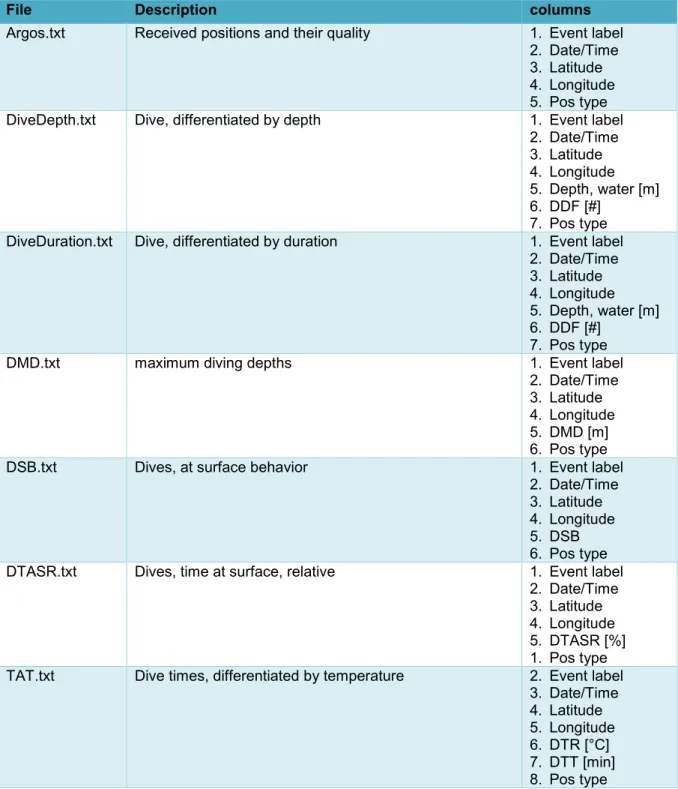
Table 2: Description of the delivered PANGAEA files
File Description columns
Argos.txt Received positions and their quality 1. Event label
2. Date/Time 3. Latitude 4. Longitude 5. Pos type
DiveDepth.txt Dive, differentiated by depth 1. Event label
2. Date/Time 3. Latitude 4. Longitude 5. Depth, water [m]
6. DDF [#]
7. Pos type DiveDuration.txt Dive, differentiated by duration 1. Event label
2. Date/Time 3. Latitude 4. Longitude 5. Depth, water [m]
6. DDF [#]
7. Pos type
DMD.txt maximum diving depths 1. Event label
2. Date/Time 3. Latitude 4. Longitude 5. DMD [m]
6. Pos type
DSB.txt Dives, at surface behavior 1. Event label
2. Date/Time 3. Latitude 4. Longitude 5. DSB 6. Pos type
DTASR.txt Dives, time at surface, relative 1. Event label
2. Date/Time 3. Latitude 4. Longitude 5. DTASR [%]
1. Pos type TAT.txt Dive times, differentiated by temperature 2. Event label
3. Date/Time 4. Latitude 5. Longitude 6. DTR [°C]
7. DTT [min]
8. Pos type
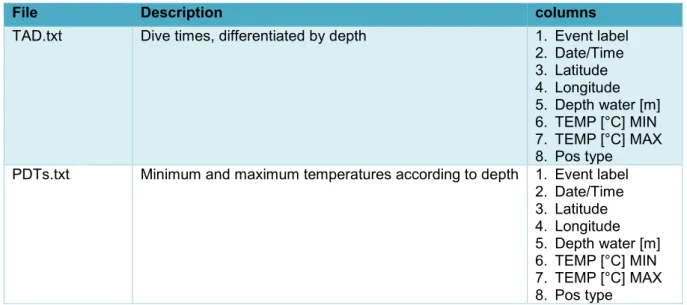
File Description columns
TAD.txt Dive times, differentiated by depth 1. Event label
2. Date/Time 3. Latitude 4. Longitude 5. Depth water [m]
6. TEMP [°C] MIN 7. TEMP [°C] MAX 8. Pos type PDTs.txt Minimum and maximum temperatures according to depth 1. Event label
2. Date/Time 3. Latitude 4. Longitude 5. Depth water [m]
6. TEMP [°C] MIN 7. TEMP [°C] MAX 8. Pos type
3.2 Received positions and their quality
A total number of 29211 messages was received and written to the file Argos.txt. The average lifetime of the seven PTTs was 230 days (ranging from 141 to 286 days). The average amount of messages per day was 20.87. Table 3 gives a summary of all processed data. Detailed maps and histograms of the location accuracies of the received messages are provided in the appendix (chapter 4.2 and 4.3 ).
Table 3: Summary of the processed PTTs
Event label First DateTime Last DateTime lifetime (days) messages PS1112018_ros_a_f_01 28.01.2018 17:52 07.07.2018 09:59 160 5724 PS1112018_ros_a_m_02 31.01.2018 23:13 21.06.2018 18:30 141 6446
FIL2018_wed_a_f_01 13.02.2018 16:50 22.11.2018 20:14 283 4737
FIL2018_wed_a_f_02 22.02.2018 18:40 23.10.2018 21:06 244 2785
FIL2018_wed_a_f_03 22.02.2018 19:43 05.12.2018 07:28 286 3185
FIL2018_wed_a_f_04 23.02.2018 19:30 25.11.2018 11:24 275 3724
FIL2018_wed_a_m_05 24.02.2018 12:42 03.10.2018 22:38 222 2610
Since there is not always a valid location for each time data are recorded within the sensor, the locations are linearly interpolated to a 10-Minute resolution. The assignment of the positions for the respective periods took place according to the following rules:
1. If there is a real position in the period, it will be used. Otherwise, the interpolated position of the middle of the time period is added (e.g. 00:00 to 01:00 AM – the interpolated position at 00:30 will be used)
2. If there is more than one valid position within the time period, the one with the better
location accuracy will be used.
3. If there are more than one valid position within the time period with the same location accuracy, the one closer to the middle of the time period is used.
3.3 Dive, differentiated by depth
In the file DiveDepth.txt, the number of dives down to certain (predetermined) depth ranges (14 bins: 5 to >600 meters) is recorded. The Table 4 shows the number of entries per Ross seal.
Table 4: Entries of the file DiveDepth.txt
Event label PTT entries
PS1112018_ros_a_f_01 35941 3154
PS1112018_ros_a_m_02 35940 3965
3.4 Dive, differentiated by duration
In the file DiveDuration.txt, the number of dives for certain dive time ranges (14 bins: 0.5 to
>30 Minutes) is counted.
Table 5: Entries of the file DiveDuration.txt
Event label PTT entries
PS1112018_ros_a_f_01 35941 3472
PS1112018_ros_a_m_02 35940 4312
3.5 maximum diving depths
From the file MinMaxDepth.csv, only the entry for the maximum depth in every 4-hour interval is used and written to the output file DMD.txt.
Table 6: Entries of the file DMD.txt
Event label PTT entries
PS1112018_ros_a_f_01 35941 930
PS1112018_ros_a_m_02 35940 818
3.6 Dives, at surface behavior
In the file DSB.txt, the information whether the tag was dry or wet (dry=0 / wet=1) is saved in a 1-hour interval.
Table 7: Entries of the file DSB.txt
Event label PTT entries
PS1112018_ros_a_f_01 35941 2693
PS1112018_ros_a_m_02 35940 3618
3.7 Dives, time at surface, relative
The file DTASR.txt includes only data from the SPOT tags. It records the percentage of time (of every hour of the day), the tag was dry (i.e. hauled out). This is done by a seawater conductivity sensor. The Table 8 shows the number of entries per animal.
Table 8: Entries of the file DTASR.txt
Event label PTT entries
FIL2018_wed_a_f_01 164433 4944
FIL2018_wed_a_f_02 164431 3576
FIL2018_wed_a_f_03 164434 4781
FIL2018_wed_a_f_04 164432 3984
FIL2018_wed_a_m_05 164436 3324
3.8 Dive times, differentiated by temperature
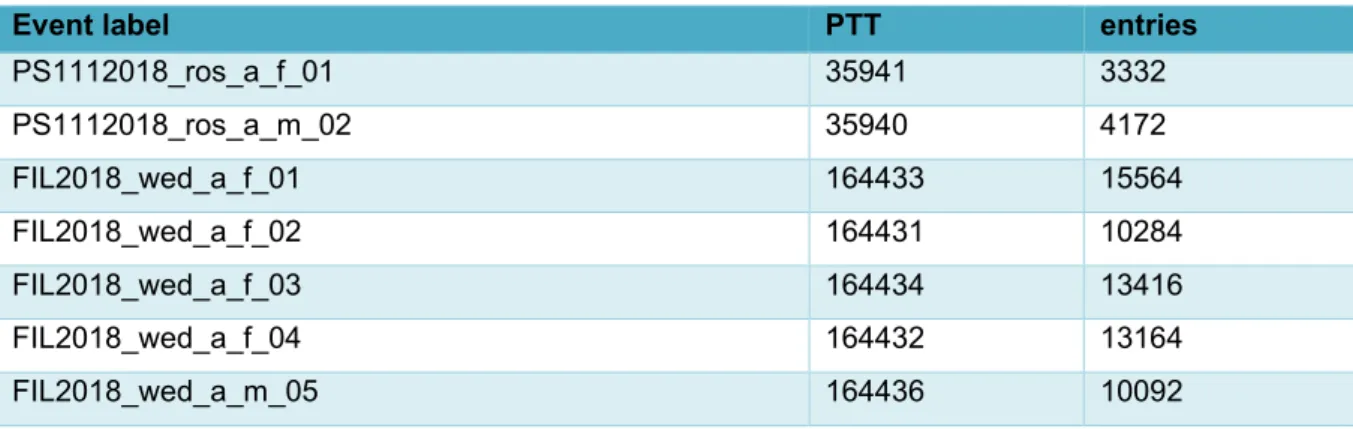
Both PTT types are capable of measuring the temperature. In the file TAT.txt, the time spent at certain temperature ranges (bin ranges) is recorded. The SPLASH tags distinguish 14 bins, the SPOT tags 12 bins. The percentage values given in the Histos.csv files are converted to minutes of the 4-hour time period. The Table 9 shows the number of entries per animal.
Table 9: Entries of the file TAT.txt
Event label PTT entries
PS1112018_ros_a_f_01 35941 3332
PS1112018_ros_a_m_02 35940 4172
FIL2018_wed_a_f_01 164433 15564
FIL2018_wed_a_f_02 164431 10284
FIL2018_wed_a_f_03 164434 13416
FIL2018_wed_a_f_04 164432 13164
FIL2018_wed_a_m_05 164436 10092
3.9 Dive times, differentiated by depth
In this file, the time of dives spent in certain depth ranges (12 bins: 5 to 500 meters) is recorded.
The percentage values given in the Histos.csv files are converted to minutes of the 4-hour time period. The Table 10 shows the number of entries per Ross seal.
Table 10: Entries of the file TAD.txt
Event label PTT entries
PS1112018_ros_a_f_01 35941 3110
PS1112018_ros_a_m_02 35940 3796
3.10 Minimum and maximum temperatures according to depth
In the file PDT.txt. the information of the minimum and maximum temperature at different depth ranges is stored (comparable with a CTD without measuring conductivity).
Table 11: Entries of the file PDTs.txt
Event label PTT entries
PS1112018_ros_a_f_01 35941 1616
PS1112018_ros_a_m_02 35940 2345
4 Appendix
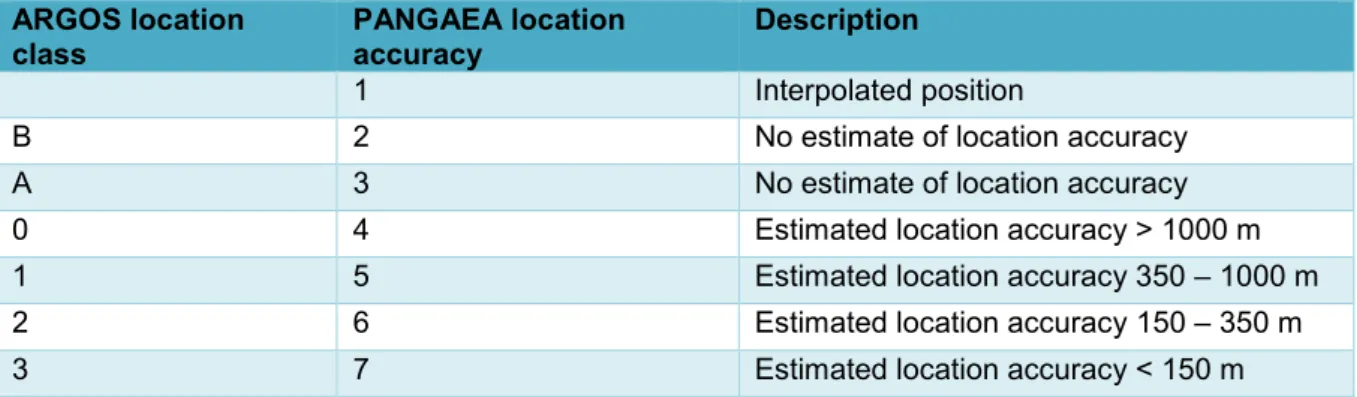
4.1 Location accuracy classes
ARGOS location
class PANGAEA location
accuracy Description
1 Interpolated position
B 2 No estimate of location accuracy
A 3 No estimate of location accuracy
0 4 Estimated location accuracy > 1000 m
1 5 Estimated location accuracy 350 – 1000 m
2 6 Estimated location accuracy 150 – 350 m
3 7 Estimated location accuracy < 150 m
4.2 Maps and histograms of processed Ross seals
4.3 Maps and histograms of processed Weddell seals