doi: 10.3389/fmars.2016.00058
Edited by:
Sylvia Gertrud Sander, University of Otago, New Zealand
Reviewed by:
David Turner, University of Gothenburg, Sweden Mona Wells, Xi’an Jiaotong-Liverpool University, China
*Correspondence:
Martha Gledhill mgledhill@geomar.de
Specialty section:
This article was submitted to Marine Biogeochemistry, a section of the journal Frontiers in Marine Science
Received:12 November 2015 Accepted:14 April 2016 Published:29 April 2016
Citation:
Avendaño L, Gledhill M, Achterberg EP, Rérolle VMC and Schlosser C (2016) Influence of Ocean Acidification on the Organic Complexation of Iron and Copper in Northwest European Shelf Seas; a Combined Observational and Model Study. Front. Mar. Sci. 3:58.
doi: 10.3389/fmars.2016.00058
Influence of Ocean Acidification on the Organic Complexation of Iron and Copper in Northwest European Shelf Seas; a Combined
Observational and Model Study
Lizeth Avendaño1, Martha Gledhill1, 2*, Eric P. Achterberg1, 2, Victoire M. C. Rérolle1and Christian Schlosser1, 2
1Ocean and Earth Science, National Oceanography Centre, University of Southampton, Southampton, UK,2GEOMAR Helmholtz Centre for Ocean Research Kiel, Kiel, Germany
The pH of aqueous solutions is known to impact the chemical speciation of trace metals.
In this study we conducted titrations of coastal seawaters with iron and copper at pH 7.91, 7.37, and 6.99 (expressed on the total pH scale). Changes in the concentration of iron and copper that complexed with the added ligands 1-nitroso-2-napthol and salicylaldoxime respectively were determined by adsorptive cathodic stripping voltammetry—competitive ligand equilibrium (AdCSV-CLE). Interpretation of the results, assuming complexation by a low concentration of discrete ligands, showed that conditional stability constants for iron complexes increased relative to inorganic iron complexation as pH decreased by approximately 1 log unit per pH unit, whilst those for copper did not change. No trend was observed for concentrations of iron and copper complexing ligands over the pH range examined. We also interpreted our titration data by describing chemical binding and polyelectrolytic effects using non-ideal competitive adsorption in Donnan-like gels (NICA-Donnan model) in a proof of concept study. The NICA-Donnan approach allows for the development of a set of model parameters that are independent of ionic strength and pH, and thus calculation of metal speciation can be undertaken at ambient sample pH or the pH of a future, more acidic ocean. There is currently a lack of basic NICA-Donnan parameters applicable to marine dissolved organic matter (DOM) so we assumed that the measured marine dissolved organic carbon could be characterized as terrestrial fulvic acids. Generic NICA-Donnan parameters were applied within the framework of the software program visual MINTEQ and the metal—added ligand concentrations [MeAL] calculated for the AdCSV-CLE conditions.
For copper, calculated [MeAL] using the NICA-Donnan model for DOM were consistent with measured [MeAL], but for iron an inert fraction with kinetically inhibited dissolution was required in addition to the NICA-Donnan model in order to approximate the trends observed in measured [MeAL]. We calculated iron and copper speciation in Northwest European shelf water samples at ambient alkalinity and projected increased pCO2
concentrations as a demonstration of the potential of the approach.
Keywords: trace metals, speciation, pH, iron solubility, NICA-Donnan, CLE-AdCSV
INTRODUCTION
The increase in atmospheric CO2 concentrations over the past two centuries has led to an enhanced CO2uptake by the oceans (Feely et al., 2004). This uptake has lowered the surface ocean pH (Caldeira and Wickett, 2003), and changed the balance of the carbonate species (Doney, 2006), leading to a decrease in the carbonate ion concentration (CO−32) and an increase in aqueous CO2and bicarbonate concentrations (Zeebe and Wolf- Gladrow, 2001; Orr et al., 2005). The increase in atmospheric partial pressure of CO2(pCO2) from preindustrial (∼280µatm) to current levels (∼400µatm) has already caused a reduction of ca. 0.1 pH units (Caldeira and Wickett, 2003; Feely et al., 2004). If anthropogenic CO2emissions and ocean CO2 uptake continues along current trends, a decrease in pH of about 0.3–
0.5 units by the year 2100 in the surface oceans is possible (Brewer, 1997; Zeebe and Wolf-Gladrow, 2001; Feely et al., 2004;
Orr et al., 2005; Doney, 2006). Carbonate ion concentrations are expected to drop by half over this century, making it more difficult for marine calcifying organisms to form biogenic calcium carbonate (CaCO3), and to maintain their external skeletons (Orr et al., 2005). These changes in ocean chemistry could have strong impacts on marine ecosystems, even under future scenarios in which most of the remaining fossil fuel derived CO2 is not released (Kleypas et al., 1999; Riebesell et al., 2000; Caldeira and Wickett, 2003; Langdon et al., 2003).
Changes in ocean pH and carbonate chemistry could also have significant impacts on the chemical speciation of essential trace elements in seawater (Millero et al., 2009; Shi et al., 2010;
Gledhill et al., 2015). In the surface ocean, trace metals that have a significant biological role for oceanic phytoplankton are manganese, iron, cobalt, copper, zinc, and cadmium (Morel and Price, 2003). Iron is an essential micronutrient involved in fundamental cellular processes, including respiration, photosynthesis, nitrogen uptake and nitrogen fixation (Geider and La Roche, 1994; Raven et al., 1999; Hogle et al., 2014). Iron controls productivity, species composition and trophic structure of microbial communities in large regions of the ocean (Sunda and Huntsman, 1995a; Johnson et al., 1997; Hunter and Boyd, 2007). Iron concentrations in oceanic waters are very low due to its low solubility and effective removal from the surface ocean by phytoplankton (Liu and Millero, 2002). Organic complexation is thought to maintain dissolved iron concentrations above its inorganic solubility (Liu and Millero, 2002), whilst potentially reducing the concentrations of the soluble, bioavailable inorganic species (Shaked and Lis, 2012). It has been demonstrated that iron deficiency limits phytoplankton growth in High Nitrate Low Chlorophyll (HNLC) waters such as the equatorial and subarctic Pacific, Southern Ocean, and coastal upwelling regions (Martin and Fitzwater, 1988; Boye et al., 2005; Boyd et al., 2007).
Furthermore, in nutrient poor, low latitude waters iron helps to regulate nitrogen fixation (Moore et al., 2009). As a consequence, iron strongly influences oceanic CO2drawdown in these regions (De Baar et al., 2008). A decrease in seawater pH from 8.1 to 7.4, which would correspond to an increase in pCO2 to approximately 1800µatm, will increase the solubility of Fe(III) by about 40%, which could have a large impact on biogeochemical
cycles (Morel and Price, 2003; Millero et al., 2009). A decrease in pH has also been suggested to result in higher iron availability to phytoplankton, as a result of enhanced proton competition for the available iron-binding ligand places (Raven et al., 2005;
Millero et al., 2009). A recent estuarine study suggested that concentrations of inorganic, bioavailable iron would increase 3 fold with a pH reduction from 8.18 to 7.41 (Gledhill et al., 2015), but that concentrations of dissolved organic carbon (DOC) could play an overriding role in determining iron speciation. The acid- base chemistry of the DOC binding sites is thus likely to be of key importance to any changes in iron speciation under future climate change scenarios (Shi et al., 2010).
Copper is an essential micronutrient for marine phytoplankton. It is involved in iron uptake (Peers et al., 2005), and in the ocean’s nitrogen cycle (Jacquot et al., 2013). Limitation of phytoplankton growth has also been observed in laboratory phytoplankton strains at free copper ion concentrations of less than 10−15M (Sunda and Huntsman, 1995b; Annett et al., 2008;
Guo et al., 2012). Cu(II) is also toxic and free copper (II) ion concentrations as low as 10−12M have been shown to reduce growth in marine phytoplankton (Brand et al., 1986) resulting in a relatively narrow optimal growth range. Complexation of copper by organic ligands can decrease its toxicity by decreasing the free cupric ion concentration (Moffett and Brand, 1996;
Moffett et al., 1997; Croot et al., 2000). A pH decrease may reduce copper binding by both organic ligands and carbonate, therefore making copper more bioavailable and consequently toxic to marine phytoplankton. It has been predicted that the increase for the free form of copper (Cu2+) under a scenario where pH is reduced to 7.5, will be as high as 30% (Millero et al., 2009) whilstGledhill et al. (2015)found that Cu2+concentrations could increase in estuaries by an order of magnitude under a similar scenario of pH reduction to 7.4, if DOC concentrations remained the same. Such increases could thus result in a higher potential for copper toxicity in coastal and estuarine ecosystems.
There are only a few studies that have considered the effect of ocean acidification on the speciation and/or bioavailability of trace metals to marine organisms (Turner et al., 1981; Byrne et al., 1988; Byrne, 2002; Millero et al., 2009; Shi et al., 2010; Gledhill et al., 2015). Here we extend our recent investigations (Gledhill et al., 2015) into the impact of decreasing pH on the complexation of iron and copper at reduced pH to waters of the Northwest European shelf seas. The aim of this study was to experimentally determine changes in the speciation of iron and copper that might result from an increase inpCO2and a consequent decrease in surface ocean pH. We therefore carried out competitive ligand equilibrium (CLE) titrations using adsorptive cathodic stripping voltammetry as a detection method (AdCSV) on 20 samples collected from Northwest European shelf seas at pH 7.91, 7.37, and 6.99 (expressed on the total pH scale). We used salcylaldoxime (H2SA) as the competing ligand for copper, and 1-nitroso-2-napthol (HNN) as the competing ligand for iron. Competitive ligand equilibrium titrations are generally interpreted as analogous to adsorption isotherms (Ruzic, 1982;
Gerringa et al., 1995). Adsorption isotherms can be interpreted using a number of different models (Foo and Hameed, 2010). In this study we used two different methods that have previously
been applied to marine waters to interpret our data (Gerringa et al., 1995; Hiemstra and Van Riemsdijk, 2006). Firstly we treated the natural metal complexing ligands (Li) as discrete ligands and utilized the Langmuir isotherm to obtain conditional stability constants (KMeL,Mecond ′) and ligand concentrations [Li] for each sample (Gerringa et al., 1995, 2014). Secondly we used the NICA-Donnan model, which considers dissolved organic matter (DOM) to be heterogeneous and non-ideal, and subject to multicomponent competition and electrostatic interactions (Koopal et al., 2005) and thus we considered DOM to contain a continuous distribution of binding sites analogous to complex organic compounds like fulvic acids (Laglera et al., 2007; Laglera and Van Den Berg, 2009; Batchelli et al., 2010; Hassler et al., 2011; Whitby and Van Den Berg, 2015). For the NICA-Donnan approach we compared calculated and measured concentrations of metal-added ligand complexes, given the determined DOC concentrations (Gledhill et al., 2015). The utility of the NICA- Donnan approach was then demonstrated through calculation of the speciation of iron and copper in our coastal water samples at the natural pH and total alkalinity of the samples observed during the cruise (Ribas-Ribas et al., 2014) and at 280, 900 and 1900µatm pCO2 (approximately 2 × and 5 × 2014 values), assuming total alkalinity and DOC remain unchanged.
MATERIALS AND METHODS Sample Collection
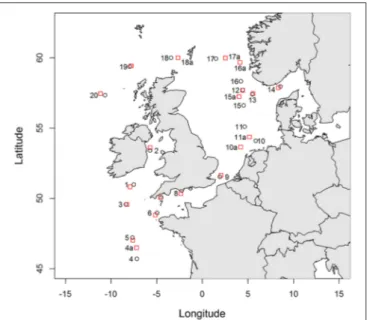
Seawater samples were collected in Northwest European shelf seas (Figure 1, Table S1) during the RRSDiscovery 366 cruise in June and July 2011. Surface seawater (ca. 2–3 m deep) was collected daily from a towed fish and was filtered in-line inside a clean container through a 0.2µm pore size filter capsule (Sartobran P-300, Sartorious). The seawater was stored in 250 ml low density polyethylene bottles (250 mL LDPE; Nalgene) for the subsequent determination of iron and copper speciation. Bottles were pre-cleaned according to a standard protocol described by Achterberg et al. (2001)and just prior to sampling were rinsed thoroughly with deionised water (MilliQ, Millipore;>18.2 m
cm) and then with seawater. Samples for copper-binding ligand analysis were stored at 4◦C for subsequent analysis on board the ship (within 1 day). Samples for the determination of iron speciation were frozen immediately after collection (−20◦C) and analyzed in a clean laboratory at the National Oceanography Centre, Southampton. Samples for the determination of total dissolved trace metals were collected using 60 ml LDPE bottles (Nalgene), acidified to pH 1.8 (0.011 M final concentration) using ultraclean HCl (Romil UpA grade) and stored at room temperature.
Determination of pH and Dissolved Organic Carbon
The pH of the original seawater sample was determined on the total pH scale (pHtotal) using an automated pH system (Rérolle et al., 2012) connected to the ship’s underway water supply, which collected water at a depth of ∼5 m. pH was determined using spectrophotometry with Thymol Blue as the pH indicator (Clayton and Byrne, 1993; Rérolle et al., 2012). The
FIGURE 1 | Locations sampled from the CTD cast (red squares) and from the underway sampling system (black circles).Where stations are not directly adjacent, underway samples are labeled with the station number and the letter a.
spectrophotometric method had a precision of 1 mpH units and measured pH values were within 0.004 pH units of certified Tris pH buffer (Scripps Institute of Oceanography, University of San Diego).
The pH of buffer solutions used during titrations was determined on the IUPAC scale (pHNBS). Although, the IUPAC scale is not optimal for seawater, stability constants describing metal complexation are determined on this scale and so it was considered appropriate for this study. pH was determined on titration aliquots immediately post analysis using a Metrohm pH meter. For comparative purposes, buffered seawater (in the absence of any added ligands) was also measured with the spectrophotometric technique (Rérolle et al., 2012), and respective values obtained on the total pH scale (pHtotal), which were: 6.99±0.01 for pHNBS7.2, 7.37±0.005 for pHNBS7.6, and 7.91±0.005 for pHNBS 8.05. pHNBS was thus 0.21 ±0.03 pH units higher than pHtotalat 20◦C (Gledhill et al., 2015).
Dissolved organic carbon was determined on samples collected from the stainless steel CTD rosette (Macgilchrist et al., 2014). For our study we used results from the sample collected from CTD stations positioned closest to our underway sample obtained at a depth between 2 and 9 m. Samples were filtered through precombusted (450◦C, 4 h) glass fiber filters (0.7µm nominal cutoff; MF300, Fisher Scientific) into precombusted glass ampoules and immediately acidified to pH 2 with 5 M HCl.
The ampoules were flame sealed, stored at room temperature and analyzed on shore by high temperature catalytic combustion (Badr et al., 2003). We obtained a value of 41.8±0.9µM C (n= 15) for acidified deep seawater reference material provided by D.
Hansell (University of Miami) against a certified concentration range of 41-43µM C.
Determination of Total Dissolved Iron and Copper Concentrations
Total dissolved metal concentrations were determined by inductively coupled plasma—mass spectrometry (ICP-MS) on acidified (pHNBS 1.8) samples after a salt removal and off-line pre-concentration/matrix removal step using a Toyopearl AF- 650M chelating column (Milne et al., 2010). Briefly, 12 ml of the acidified sample in an acid cleaned 30 ml FEP bottle (Nalgene) was spiked with a multi-element standard of isotopes (containing the stable isotopes 65Cu, and 57Fe) with known enrichments over their natural abundance. The spiked samples were left for overnight equilibration. Subsequently, the samples were buffered to pH 6.4± 0.2 using 2 M ammonium acetate, prepared with ultrapure acetic acid and ammonia (Fisher Optima).
The buffered sample was then pumped over the preconcentration column, at 2 ml min−1. The column was rinsed with 1 ml de-ionized water to remove salts, and subsequently the metals were eluted for 30 s using 1 ml of 1M distilled HNO3 (Savilex). The eluent was collected into acid cleaned autosampler polypropylene vials (OmniVials; 4 ml) and capped.
The extracted samples were analyzed using a high resolution- ICP-MS (Element XR, Thermofisher). The sample was introduced via a 100µl Teflon nebuliser connected to a PFA spray chamber. Measurements for iron, and copper were performed in medium resolution mode (R = 4000). The detection limit was determined to be 0.033 and 0.054 nmol L−1 for iron and copper, respectively, and blank values were typically 0.06 nmol L−1for iron and 0.02 nmol L−1for copper. Values determined for the SAFe surface reference sample were within the consensus range (0.09±0.03 nmol L−1for iron, and 0.55± 0.06 nmol L−1for copper).
Determination of Iron and Copper Speciation Via Competitive Ligand Exchange with Detection by Adsorptive Cathodic Stripping Voltammetry (CLE)
Determination of the iron and copper speciation in seawater was performed via measurement of the quantity of each metal (Me) that is available to complex with an added ligand (AL) using CLE-AdCSV, with 1-nitroso-2-naphthol (HNN) for iron (Yokoi and Van Den Berg, 1992; Gledhill and Van Den Berg, 1994; Van Den Berg, 1995), and salicylaldoxime (H2SA) for copper (Campos and van den Berg, 1994) as the competing ligands.
The electrochemical system consisted of a potentiostat (µAutolab Ecochemie, Netherlands) with a static mercury drop electrode (Metrohm, 663 VA stand), a KCl reference electrode (Ag/AgCl in 3M KCl saturated with AgCl) and a counter electrode of glassy carbon. Two systems were used in parallel on board ship for the analysis of copper speciation, and one system in the laboratory for the analysis of iron speciation.
All chemicals were prepared in a clean electrochemistry laboratory under a Class 100 laminar flow bench at room temperature (20◦C). A stock solution of 0.01 M HNN (Sigma) was prepared in methanol (Fisher, HPLC grade). A stock solution
of 0.01 M H2SA (Sigma) was prepared in 0.1 M HCl (Romil, SpA grade). Standard Fe(III) and Cu(II) solutions of 10−6M for additions were prepared using a 1000 mg/L ICP-MS stock solution (Fisher Scientific), and were acidified to pH 2 using HCl (Romil, SpA grade).
Stock solutions of 1 M N-2-hydroxyethylpiperazine-N’- ethanesulphonic acid (HEPES; Fisher Aristar grade) pH buffer were prepared in 0.35, 0.6, and 0.9 M ammonia (Romil, SpA grade) in order to provide a pH of 7.2, 7.6, and 8.05 upon 100-fold dilution with sea water. HEPES was cleaned prior to use by the addition of HNN with subsequent removal of HNN and Fe(NN)3 using a previously activated C18 SepPak column (Whatman).
For the ship-board determination of copper speciation, the pH was adjusted in three individual 250 ml LDPE bottles to 8.05, 7.6, and 7.2 through addition of pH adjusted 1 M HEPES buffers (0.01 M final concentration) immediately after collection, and with a 0.01 M solution of the competing ligand H2SA (10µM final concentration). The samples were subsequently equilibrated for a minimum period of 1 h at room temperature (∼20◦C).
An aliquot of 15 ml of the sample solution was then pipetted into 30 ml polystyrene cups. A copper (II) standard solution was spiked to give an added concentration range between 0 and 30 nM in 14 steps. The copper and ligands in the sample aliquots were allowed to equilibrate overnight (>12 h) at room temperature.
The concentration of Cu(HSA)2 in the samples was determined using the following procedure: (i) removal of oxygen from the samples for 5 min with nitrogen gas (oxygen free grade), after which 5 fresh Hg drops were formed, (ii) a deposition potential of −0.1 V was applied for 60 s whilst the solution was stirred to facilitate the adsorption of the Cu(HSA)2to the Hg drop, and (iii) at the end of the adsorption period, the stirrer was stopped and the potential was scanned from −0.1 to −0.4 V using the square wave method at a frequency of 100 Hz. The stripping current (peak height) from the reduction of the adsorbed Cu(HSA)2complex was recorded.
The pH on each of the titration steps was checked after each measurement and found to agree with the pH prior to measurement.
Iron speciation was determined in a clean laboratory under a Class 100 laminar flow bench, in Southampton. The frozen samples for the iron speciation measurements were thawed prior to analysis to reach room temperature, and then buffered using the same procedure as for the copper samples. In the case of the iron titrations, an added ligand concentration of 1µM NN was used, with the exception of the pH 8.05 experiment (2µM NN). Added iron concentrations ranged between 0 and 8 nM in 14 steps, pipetted into 30 ml polytetrafluoroethene (PTFE) vessels. Samples were left to equilibrate for 16 h (overnight).
The concentration of FeNN3was determined after de-aeration of the sample with nitrogen gas (5 min). A deposition potential at−0.1 V was used with a deposition time of 3 min; the scanning mode was sample-DC from −0.15 V to −0.65 V at a scan rate of 50 mV s−1, the reduction peak of iron appeared at approximately−0.45 V.
Data Treatment Applied to Competitive Ligand Exchange Titrations
Addition of a competing or added ligand to natural seawater results in the establishment of a new equilibrium between the free metal (Men+), inorganic metal complexes (Me′), natural organic complexing material (NOCM) and theAL.
Men++ Me′+ Me(NOCM)+xAL↔Men++Me′ (1)
+Me(NOCM)+MeALx
The approach assumes that the concentration of the competing AL species is in excess of the binding sites in the NOCM, and works optimally when the binding sites in NOCM are in excess of the metal concentration in the sample. Addition to the sample of further free metal (Men+) in increasing increments, accompanied by determination of the concentration ofMeALxand calculation of Me′ and Men+ using known equilibrium constants allows for the estimation of the concentration ofMe(NOCM)at each titration point in the experiment. Modeling the relative changes in all four components of the equilibrium allows for the relative concentration and strength of the NOCM binding sites to be established. In this study we used two approaches to model changes in metal speciation during the titration: (1) the single window discrete ligand approach and (2) the NICA-Donnan model. The first approach allowed us to obtain conditional stability constants KMeLcondi and the maximum concentration of metal that could bind to NOCM in each sample at the three pH levels at which the samples were analyzed. The second approach was used to calculate the speciation of iron and copper independent of pH, pCO2, and DOC concentrations and thus allowed for examination of the impact of future increases inpCO2 to be investigated in North West European shelf sea waters.
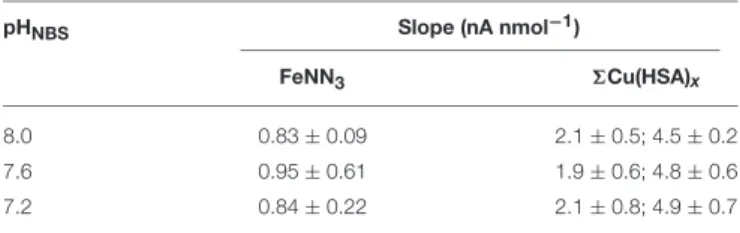
Results of CLE-AdCSV are highly dependent on the method used to define the sensitivity of the electrochemical response (Pizeta et al., 2015). In this study we used the internal method, which calculates MeALx concentrations from the slope of the saturated part of the titration curve, normally the last three to five titration points. Average slopes observed at the three different pHs in this study are given in Table 1. Although slopes were variable between samples, we observed no systematic difference in slope with DOC (results not shown) for either iron or copper. Copper titrations were performed at sea on two separate instruments made up of the same components. A large difference in slope (ca. 2.3×) was observed between the two instruments employed for copper titrations.
The Single Detection Window Discrete Ligand Approach
In the single detection window discrete ligand approach (hereafter referred to simply as the discrete ligand approach), NOCM is considered to consist of classes of discrete ligands (Li) which vary in strength. The strongest ligand class is termed L1 and progressively weaker ligandsL2, L3 etc. Importantly in this approach, the stoichiometry betweenMeandLiis assumed to be 1:1 (Pizeta et al., 2015). This approach has been used extensively for describing metal complexation in marine systems and considerable effort has been directed toward determining
TABLE 1 | Average slopes observed for the last three titration points at different titration pHs.
pHNBS Slope (nA nmol−1)
FeNN3 6Cu(HSA)x
8.0 0.83±0.09 2.1±0.5; 4.5±0.2
7.6 0.95±0.61 1.9±0.6; 4.8±0.6
7.2 0.84±0.22 2.1±0.8; 4.9±0.7
Slopes are given separately for the two instruments used for copper titrations.
different ligand classes (e.g.,Sander et al., 2011) in the hope of properly representing the full range of metal complexes likely to be present in the marine environment. In our study we undertook titrations at different pH for each sample, applying one added ligand concentration for each metal. The theoretical considerations for the determination of natural ligand binding characteristics assuming discrete ligands has been described in detail for iron and HNN byGledhill and Van Den Berg (1994);
Van Den Berg (1995), and in the case of Cu with H2SA by Campos and van den Berg (1994). The overall mass balance, conditional stability constants forMeALxand the sensitivity of the voltammetric response are used to determine concentrations of Me′ and MeLi for each titration point. Values for Me′ and MeLiare then used to calculate the conditional stabilityKMeLcondiand ligand concentration [Li] of the metal ligand complex using the equation
[MeLi]= KMeLcondi[Li][Me′] (1+KcondMeLi
Me′
) (2)
where KMeLcondi is the conditional stability constant for metal complexation with the natural ligand (Li). Equation (1) is equivalent to the Langmuir isotherm andKMeLcondi and [Li] were calculated using non-linear regression (Gerringa et al., 1995) and a script in the computer program R (Gerringa et al., 2014). The coefficients and constants used in the discrete ligand approach in this study are listed inTable 2. Although the discrete ligand approach has been extensively used to describe metal complexation in the marine environment, a limitation of this approach is that the conditional stability constantsandligand concentrations are, by definition, conditional and thus specific to the ionic strength, pH and temperature of the sample at the time it was analyzed.
Modeling Iron and Copper Complexation by Dissolved Organic Matter with the Non-Ideal Competitive Adsorption–Donnan Approach
The NICA-Donnan approach is one of a suite of modeling approaches (Dudal and Gérard, 2004; Tipping, 2005; Stockdale et al., 2015; Tipping et al., 2015) that attempts to represent the complexity of metal complexation with DOM in a way which is independent of pH, ionic strength and the presence of competing cations. In the NICA-Donnan model, DOM is considered to behave like humic or fulvic acids (Kinniburgh et al., 1996; Koopal et al., 2005). The NICA-Donnan model accounts for both the
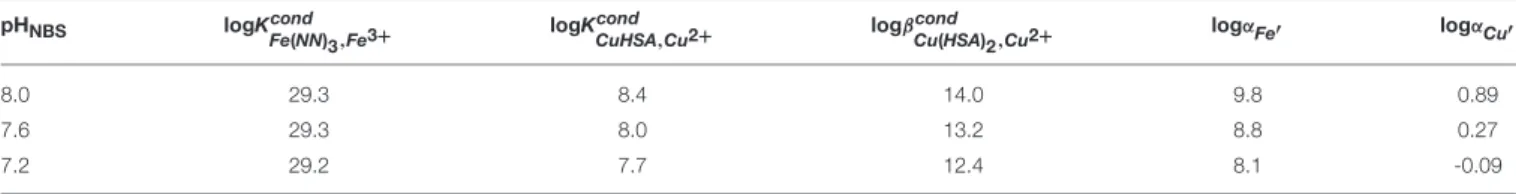
TABLE 2 | Conditional stability constants for added ligands and inorganic side reaction coefficients for iron and copper used in this study.
pHNBS logKcond
Fe(NN)3,Fe3+ logKcond
CuHSA,Cu2+ logβcond
Cu(HSA)2,Cu2+ logαFe′ logαCu′
8.0 29.3 8.4 14.0 9.8 0.89
7.6 29.3 8.0 13.2 8.8 0.27
7.2 29.2 7.7 12.4 8.1 -0.09
chemical (NICA) and electrostatic (Donnan) affinity of binding sites. In the NICA component, the overall equation used to obtain the fraction of total number of binding sites (θI,max) occupied by theith component (e.g., proton, iron, copper) at concentration Ciis
θi,max = (Ki.Ci)ni P
i(Ki.Ci)ni. P
i(Ki.Ci)ni p 1+P
i(Ki.Ci)ni p (3) where the NICA constant (Ki) describes the mean binding affinity for the ith component, ni is the non-ideality constant, andp is width of the binding site distribution (Koopal et al., 2005).
The overall density of binding sites (Qmax,T)is assumed to be equivalent to the density of proton binding sites (QmaxH,T).
Proton affinities (KH) are considered to occur in a continuous Sips bimodal affinity distribution that is thought to encompass two groups of binding sites—a low proton affinity (acidic) group and a high proton affinity (basic) group of sites (Koopal et al., 2005). The following normalization condition is thus used to give thermodynamic consistency to the NICA isotherm and calculate of the amount (Qi,max) of componenti, bound by DOM, where nHis the non-ideality constant for the binding of protons
Qi,max =Qmax,Tθi,max ni
nH
(4)
Substituting Equation (3) in Equation (4) the following general expression describing the binding of metal, Me (Cu or Fe) by marine DOM (Milne et al., 2003)
QMe = Qmax1,TnMe,1
nH1 . (KMe,1.CMe)nM,1
(KH,1.CH)nH,1+(KMe,1.CMe)nMe,1. (KH,1.CH)nH,1+(KMe,1.CMe)nMe,1 p1
1+
(KH,1.CH)nH,1+(KMe,1.CMe)nMe,1 p1 +Qmax2,TnMe,2
nH2 . (KMe,2.CMe)nMe,2 (KH,2.CH)nH,2+(KMe,2.CMe)nMe,2 .
(KH,2.CH)nH,2+(KMe,2.CMe)nMe,2 p2 1+
(KH,2.CH)nH,2+(KMe,2.CMe)nMe,2 p2 (5)
whereQmax1,T,Qmax2,Trefer to the total number of type 1 and type 2 proton binding sites respectively.
The NICA approach is combined with the Donnan model in order to account for electrostatic interactions that occur in gel like substances. The Donnan model relates the molecular charge
σof a natural organic molecule to its Donnan volumeVDand electrostatic potentialψ.
σ=VD
X
i
ziC0,ie
−ziFψ
RT (6)
where zi is the valence of the ith component, C0,i is the concentration of ith component in solution, F is the Faraday constant, R the gas constant and T the absolute temperature (K). The Donnan volume is related to ionic strength through the empirical formula (Benedetti et al., 1996)
logVD=0.57 1−logI
−1 (7) The combined NICA-Donnan model was applied to our dataset using the computer program visual MINTEQ v 3.0 (vMINTEQ;
Gustafsson, 2012). vMINTEQ incorporates the NICA-Donnan model into a calculation of the speciation of inorganic and simple organic molecules (such as ethylenediaminetetraacetic acid, EDTA) or ions at thermodynamic equilibrium. vMINTEQ uses stability constants from the NIST database (Martell and Smith, 2004) for inorganic and simple organic complexes. The salinity of each sample was used to derive the molality of the major ions Na+, K+, Ca2+, Mg2+, Sr2+, Cl−, SO24−, Br−, BO33+, and F− for a temperature of 20◦C and a density of 1025 kg m−3. The inorganic/simple organic part of the algorithm has not been optimized for modeling at ionic strengths as high as seawater. We used the extended Davies equation to correct for ionic interactions, but many components lack the Debye- Hückel constants required to properly extend the calculations into the ionic strength range of seawater. Comparison of calculated speciation for the carbonate system (Gledhill et al., 2015) with that produced by CO2SYS, a speciation model specifically designed for seawater (Pierrot et al., 2006), resulted in underestimation of [CO23−], a factor which is likely related to the ionic strength algorithm employed in vMINTEQ (Gledhill et al., 2015). Here, as in our previous study, we therefore forced the total [CO23−] concentration to agree with the total [CO23−] concentration produced by CO2SYS by multiplying total inorganic carbon (Tc) by 1.2 in order to compensate for the underestimation of total [CO23−] and improve the calculation of inorganic copper species across our pH range. Forcing [CO23−] concentrations resulted in 82.0±0.4% and 68.2±0.8% (n = 20) of inorganic copper being present as carbonate species in our samples at pH 8.1 and 7.6 respectively, which is of similar magnitude to that calculated byMillero et al. (2009).
For the NICA-Donnan model, we considered DOC in our samples to consist entirely of fulvic acids. We applied the
generic parameters for total binding sites QmaxH,T, binding site distribution (p), the NICA constant (K) and non-ideality constant (nH) for type 1 (acidic) and 2 (basic) sites to describe FA proton binding, and NICA constants and non-ideality constants for complexation of FA by the major competing ions calcium, magnesium and strontium. The generic parameter set for the NICA-Donnan model has been derived from pH or metal titration experiments on soil and freshwater fulvic fractions (Milne et al., 2003). The Donnan equation, which accounts for the effects of ionic strength, has been established using a relatively limited dataset (Benedetti et al., 1996), albeit one that extends up to an ionic strength of 1. Similar characterization of marine DOM has yet to be undertaken and is challenging because of the difficulties of isolating and preconcentrating sufficient DOM to carry out such experiments. For NICA- Donnan modeling of iron and copper complexation with fulvic acid, we first used two parameter sets based on more recent studies (seeTable 3) in marine waters. The presence of an inert iron fraction (Gledhill and Buck, 2012) was accounted for by first calculating iron solubility in our samples using the sample DOC concentration, the relevant NICA-Donnan parameters and ferrihydrite precipitation with the solubility constant derived by Liu and Millero (1999)at the pH of the original seawater sample (i.e., not the pH of the titration). An additional equation was added in order to consider the presence of an inert fraction at saturated concentrations ofFe′that did not react with NN within the timescale of our titration
Fe3++Fe′+NOCM↔Fe3++Fe′+Fe(NOCM)+Feinert (8) Once Feinert was calculated and subtracted from the dFe concentration, then the equilibrium between NN andFe3+,Fe′, andFe(NOCM)was calculated with vMINTEQ. Salicylaldoxime and HNN were added as ligands to vMINTEQ. Protonation constants for the added ligands were taken from the NIST critical stability constant database (Table 3; Martell and Smith, 2004).
Stability constants for vMINTEQ for complexation of copper with HSA−, and iron with NN−were empirically derived from titrations of added ligands with EDTA and, for SA, from titrations in UV-irradiated seawater varying the H2SA concentration (Gledhill et al., 2015). The derived stability constants are conditional to the ionic strength and major ion composition of seawater and valid for the pH range used in our study.
Concentrations ofMeALx were calculated in vMINTEQ at the pH and [CO23−] concentrations of the experimental titration pH.
Calculated concentrations ofMeALxwere compared to measured concentrations of MeALx in order to empirically minimize the root mean squared error. We then used the best parameter set to calculate iron and copper speciation in our samples at the observed pHNBS and 1.2 ×Tc calculated by CO2SYS from measured total alkalinity andpCO2values of 280, 400, 900, and 1900µatm. Calculations were carried out at 20◦C as this was the temperature at which titrations were performed and there is little information with respect to how NICA-Donnan complexation in seawater will change with temperature.
The updated thermodynamic database, components database, and the NICA-Donnan databases used in this study are provided
as Data sheet 1 in Supplementary Material. Because of the limitations resulting from the mechanism used to correct for ionic strength and the lack of knowledge with respect to the complexation properties of marine DOC, these databases should be used with caution and the results presented here should thus be regarded in the context of “proof of concept,” rather than a fully accurate interpretation of iron and copper speciation in these waters. Nevertheless, useful information can be obtained from applying this approach to marine systems with respect to the general behavior of complex DOM over the pH range of our study.
RESULTS
Salinity, Sea Surface Temperature (SST
◦C) and Surface pH
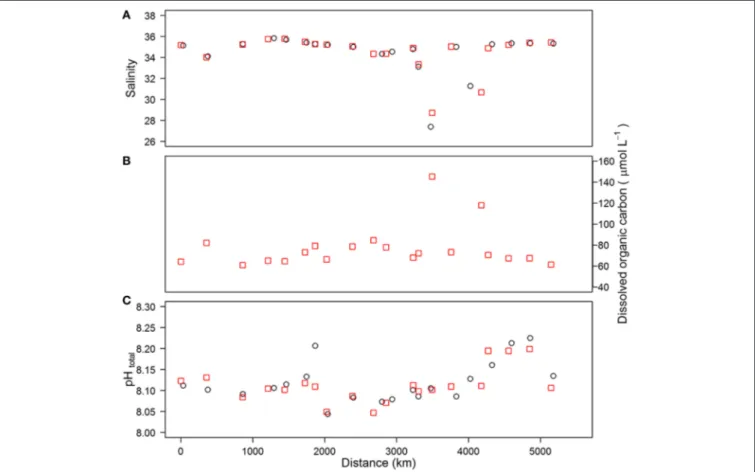
The hydrography of the cruise has been discussed in more detail byPoulton et al. (2014). Salinity varied between 31.3 and 35.8 at the 20 sampling stations, except in the Skagerrak area where a salinity of 27.4 was observed (Figure 2A). Sea surface temperature (SST) varied between 11.2 and 17.1◦C, with the lowest value observed at station 2 in the Irish Sea and the highest at station 14 in the Skagerrak area.
The concentrations of DOC ranged between 61 and 145µmol L−1(Figure 2B), with the maximum value observed at station 14 in the Skagerrak area. The high DOC concentration observed in the surface waters (<5 m) at this station was associated with a surface extrusion of high temperature, low salinity waters that originated from the Baltic Sea or the coastal waters of Sweden.
Similar high DOC values (>100µmol L−1) were also observed at
<5 m in the adjacent two CTD stations (Macgilchrist et al., 2014).
Surface seawater pHTotal at the 20 sampling stations varied from 8.04 to 8.23 (Figure 2C), with the highest values observed at station 18 in the northern North Sea and station 19 in the Atlantic sector of the cruise, which had some of the lowest temperature values observed during the cruise, and featured enhanced chlorophyll concentrations (up to 1.6µgL−1 Poulton et al., 2014). Lowest pH values were observed at station 8 in the English Channel and at the southern North Sea stations (10, 11, 15).
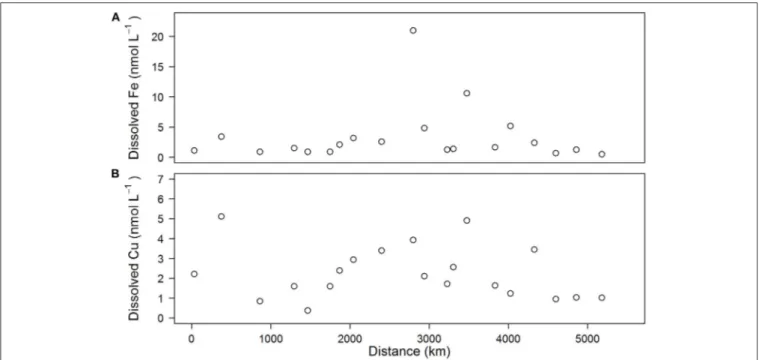
Total dissolved iron (dFe) concentrations varied between 0.5 and 5.4 nM (Figure 3A), with an average of 2.2± 1.5 nM except in the southern North Sea (station 10) and the Skagerrak area (station 14), where dFe concentrations were high (21.0 and 10.6 nM, respectively). Total dissolved copper (dCu) concentrations varied between 0.4 and 5.1 nM (Figure 3B), with an average of 2.3±1.3 nM.
Organic and Copper Binding Ligand
Characteristics in the Northwest European Shelf Seas—the Effect of Acidification
The enhanced concentrations of dFe and dCu typically observed in the shelf sea waters resulted in natural ligand pools that were close to saturation, if not saturated, for many of our titrations.
As such fitting the discrete ligand model was problematic for many of our samples as was also reported for deep ocean
TABLE 3 | Constants used for NICA-Donnan modeling.
Iron Copper Added ligand
FA1 FA2 FA1 FA2
Aa log K = 3.6,
n=0.3
log K = 11.2, n=0.15
log K = 0.26, n=0.63
log K = 7.26, n=0.36
Fe(NN)3, log K = 32.5, pKaHNN=7.9c
Bb log K = 2.8,
n=0.36
log K = 8.3, n=0.23
log K = 0.26, n=0.63
log K = 8.26, n=0.36
Cu(HSA)+, log K = 18c Cu(HSA)2, log K = 41.1
C log K = 3.6,
n=0.26
log K = 8.3, n=0.23
log K = 0.26, n=0.63
log K = 5.26, n=0.53
pKaHSA= 12.1c pKaH2SA= 21.29c pKaH3SA= 22.7c
aGledhill et al., 2015.
bHiemstra and Van Riemsdijk, 2006.
cMartell and Smith, 2004.
FIGURE 2 | Salinity (A), dissolved organic carbon (B) and pH (C) obtained for CTD samples (red squares) and underway samples (black circles) plotted as a function of distance along the cruise track.
hydrothermal samples (Hawkes et al., 2013). Results are only presented for titrations that produced a significant fit for log KcondMeL
i,Me′ andLi,Me at the 90% confidence level (i.e.,p < 0.1).
Thus, 13 out of 30 titrations were successfully fitted to the discrete ligand model for iron, whilst 16 out of 30 fits were successful for copper. In order to examine the potential cause for the fit failing, we assessed the impact of random error on a simulated titration similar to that observed for station 1. We randomly generated 2, 5, and 10% error on each titration point for 10
simulated titrations and then analyzed the resultant simulated titrations with the non-linear discrete ligand model. Our analysis, indicated that a random error of as little as 2% on each titration point would result in poor fits (p > 0.1) for the discrete ligand model in two out of five simulations using our metal addition regime, a random error of 5% resulted in p > 0.1 for 60% of the fits and a random error of 10% resulted in complete failure (i.e., no successful fits) of the discrete model approach.
FIGURE 3 | Concentrations of dissolved iron (A) and dissolved copper (B) observed in underway samples plotted as a function of distance along the cruise track.
Iron and Copper Binding Ligands[Li,Fe],[Li,Cu]and Stability Constants
Metal binding ligand concentrations [Li,Me] determined using our detection windows in the surface waters of the Northwest European shelf seas for the range of pHNBS 8.05–7.2 are given in Table S2 and shown in Figure 4. Iron binding ligand concentrations [Li,Fe] at pHNBS 8.05 averaged of 4.7±2.0 nM (n = 7). At pHNBS 7.6, [Li,Fe] averaged 4.0±0.8 nM (n = 2), and at pH 7.2, [Li,Fe] averaged 2.6±0.8 nM (n= 3), excluding station 10, where a value of 22.6 nM was observed. There was no apparent trend of [Li,Fe] with pH.
Copper-binding ligand concentrations [Li,Cu] at pHNBS 8.05 averaged 3.4±1.3 nM (n=3). At pH 7.6, [Li,Cu] averaged 6.0± 3.3 nM (n=7), and at pHNBS7.2, [Li,Cu] averaged 6.0±3.6 nM (n=6). As in the case of iron, there was no trend in
Li,Cu with the decline of pHNBSfrom 8.05 to 7.2 (Figure 4B). Results for log KcondFeL
i,Fe′obtained in this study are shown inFigure 4C, Table S2.
LogKFeLcond
i,Fe′increased with decreasing pH, from approximately 11.2 at pHNBS8.05, to 11.7 at pHNBS 7.6 and 13.1 at pHNBS7.2.
In contrast logKCuLcond
i,Cu′did not show a trend with a decrease in pH (Figure 4D, Table S2).
NICA-Donnan Modeling of Iron and Copper Complexation
Selection of NICA-Donnan parameters
The addition of HNN and H2SA to vMINTEQ allowed the concentrations of FeNN3and6Cu(HSA)x to be calculated as a function of NICA-Donnan binding by DOC. Our study region covered a wide range of dissolved iron concentrations, with particularly elevated concentrations in the North Sea, as also
observed previously (Gledhill et al., 1998). At such high iron concentrations, it is likely that some of the iron measured as dissolved iron, would be present in an inert, potentially colloidal fraction (Gledhill and Buck, 2012; Hawkes et al., 2013; Von Der Heyden and Roychoudhury, 2015). Figure 5 shows the impact of accounting for the presence of an inert phase that is in selective disequilibrium with HNN, for three titrations on samples 3, 10, and 14, which were determined to have very different dFe concentrations (0.9, 21, and 10.6 respectively). Our titration data showed that measured FeNN3 did not depend greatly on the concentration of dFe originally present in the sample, as illustrated in Figure 5A. These results suggest that only a fraction of the iron was actually in equilibrium with HNN (Gledhill and Buck, 2012). Calculating [FeNN3] concentrations with the assumption that all dFe was in equilibrium with HNN, results in increased FeNN3when dFe concentrations are higher as observed in Figure 5B. However, when an inert fraction is calculated according to Equation (8), prior to calculating the equilibrium between the added ligand, Fe3+, Fe′, and Fe(NOCM) then we obtained a pattern more representative of our observations (Figure 5C). We used insoluble ferrihydrite as our inert fraction in this study, as increasing the strength of complexation parameters describing NOCM in an attempt to create an “inert” Fe fraction bound to NOCM resulted in a similar trend toFigure 5B, albeit with lower calculated FeNN3 concentrations. Our observations could thus only be described by incorporation of a solid phase with kinetically inhibited dissolution into our model.
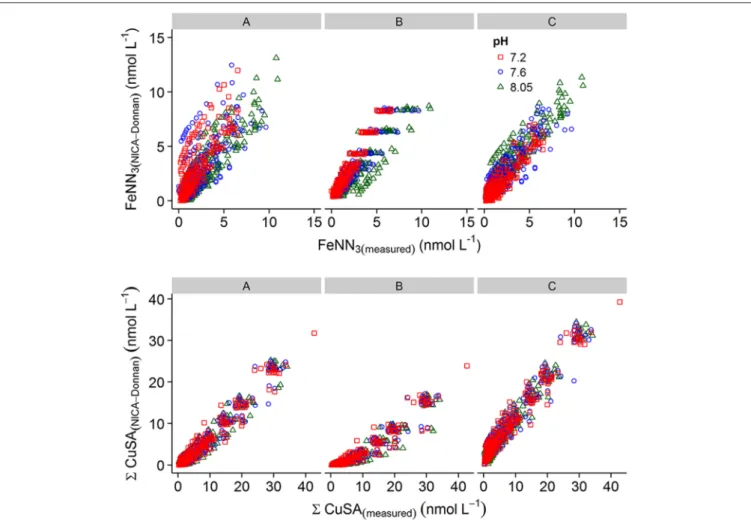
Plots of calculated MeALx vs measured MeALx produced after incorporation of an inert iron fraction using three different parameter sets are shown inFigure 6. We adopted an empirical
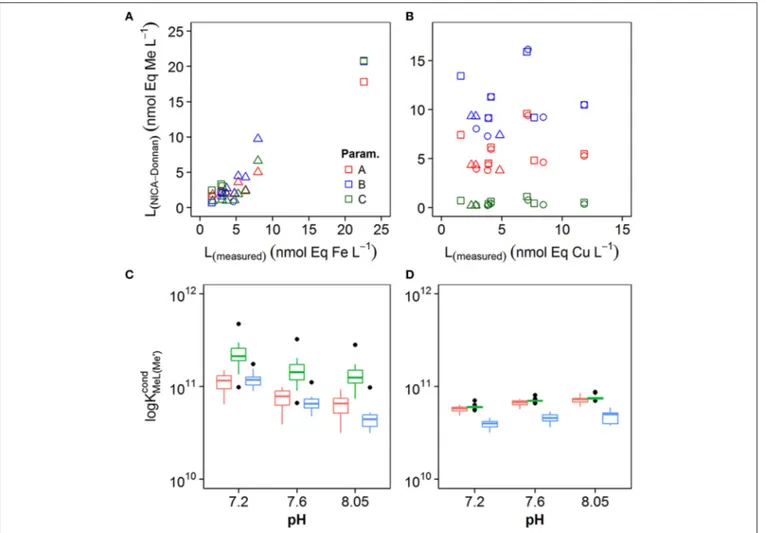
FIGURE 4 | Concentrations of ligand estimated in samples using the discrete ligand approach for (A) iron and (B) copper.Error bars represent±1 standard deviation from the average.(C)Box and whisker plots obtained for conditional stability constantsKcond
FeLi,Fe′observed at pH 8.0, 7.6, and 7.2 for iron(C)and copper(D). The box incorporates the 25th and 75th percentiles, whilst outliers are plotted as black circles.
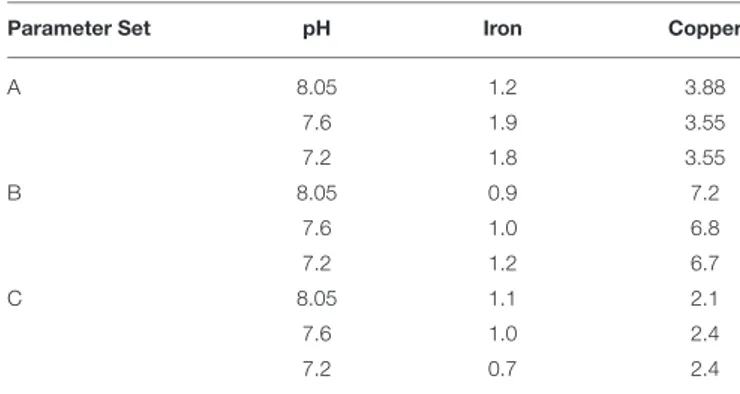
approach to model optimization, as this was a proof of concept study. Root mean squared errors obtained from comparison of measured vs. calculated data at each pH are presented inTable 4.
For iron, parameters derived for our previous estuarine study (A) and by Hiemstra and Van Riemsdijk (2006) (B) resulted in an overestimation of FeNN3 at lower pH values, although those derived by Hiemstra and Van Riemsdijk (2006)resulted in an improved fit as observed from lower RMSE (Table 4).
Increasing the apparent strength of the more acidic fraction (FA1) by both reducing the non-ideality factor for FA1 to 0.26 and increasing the NICA constant to 3.6 improved the fit at lower pH (Figure 6C,Table 4). It should be noted here that we assumed the inert iron fraction was also inert to the change in temperature as it is commonly assumed that there is no impact on titration data from freezing (Buck et al., 2012). We assumed the inert fraction was also inert to the change in pH on the timescale of our titrations (<day) as incorporating ferrihydrite precipitation at the pH of the titration resulted in an increased RMSE for iron at pH 7.6 and pH 7.8 (results not shown) and thus a pH trend inconsistent with observed results. For
copper, parameters derived for our estuarine study (A) resulted in a better approximation of6Cu(HSA)x with no pH bias in RMSE, although6Cu(HSA)x was consistently underestimated (Figure 6). Set A was, however, an improvement on the generic parameters (Milne et al., 2003; Set B, Table 3) and a further decrease in logKFA2(Cu) andnFA2Curesulted in an improved fit of the calculated to the measured6Cu(HSA)x concentrations (Figure 6C).
In order to understand the potential impact of the different NICA-Donnan model parameters on conditional stability constants and ligand concentrations, we applied the discrete model approach to the simulated titration datasets. Results from the calculation of stability constants and ligand concentrations from the simulated titrations are shown in Figure 7. We compared [Li,Me]determined from our titrations (Lmeasured) with the apparent [Li,Me] determined from the simulated titrations (LNICA−Donnan) (Figures 7A,B), and we plotted the average of the conditional stability constants for each pH and for the three different model parameter sets inFigures 7C,D. For iron, log KFeLcond
i,Fe′ and Li,Fe obtained from simulated data agreed quite
FIGURE 5 | Iron competitive ligand equilibrium titrations at pH 8.0 (A) observed for station 3, 10, and 14, (B) simulated using dissolved organic matter calculated with NICA-Donnan parameters only considering organic complexation and (C) simulated using NICA-Donnan parameters and incorporating an insoluble inert iron phase represented by ferrihydrite.
well with that obtained from the real titrations. Correlation coefficients between LNICA−Donnan and Lmeasured were > 0.95 for all three parameter sets for iron. For copper, log KCuLcond
i,Cu′
obtained for the simulated titrations were within the range of those obtained for real samples (Figure 7D), but ligand concentrations did not agree well for any of the applied parameter sets (Figure 7B).
Application of the NICA-Donnan Model to the Prediction of the Impact of Increasing pCO2on Iron and Copper Complexation
IncreasingpCO2from 280 to 400, 900, and 1900µatm resulted in decreases in pH of 0.13, 0.45, and 0.75 pH units respectively, while the concentration of carbonate ions decreased to 78, 42, and
TABLE 4 | RMSE (nmol L−1) obtained on comparison of measuredMeALx concentrations with calculatedMeALxconcentrations obtained using vMINTEQ.
Parameter Set pH Iron Copper
A 8.05 1.2 3.88
7.6 1.9 3.55
7.2 1.8 3.55
B 8.05 0.9 7.2
7.6 1.0 6.8
7.2 1.2 6.7
C 8.05 1.1 2.1
7.6 1.0 2.4
7.2 0.7 2.4
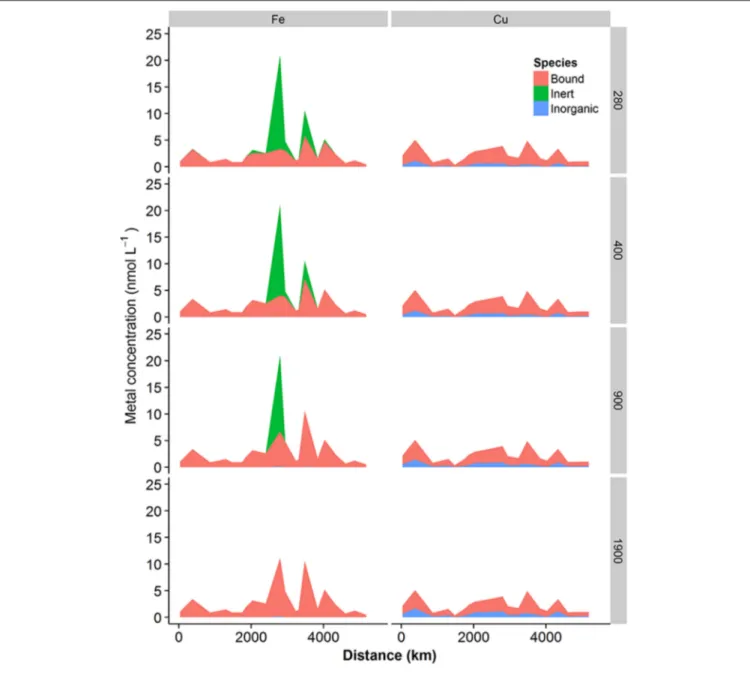
22% of preindustrial levels respectively. The projected changes in these inorganic major ions would thus be expected to have an impact on both iron and copper speciation. Results obtained from calculation of the speciation of iron and copper in our shelf sea samples at decreased pH and CO23−ion concentrations are presented inFigures 8,9.Figure 8shows the proportion of metal bound to fulvic acid analogs (“Bound”), the inert fraction (“Inert”—for iron only) and present as simple inorganic ion pairs or as the free metal (“Inorganic”), whileFigure 9 shows the changes in inorganic iron (pFe’) and free Cu2+ (pCu2+) in more detail. Iron was present mainly in the bound fraction, with the inert fraction becoming important at iron concentrations greater than ca. 4–5 nM, (depending on the concentration of DOC) atpCO2 <400µatm. When modeled as inorganic ferric hydroxides, the inert fraction was reduced by increases in pCO2, so that atpCO2levels of 1900µatm, bound iron reached concentrations as high as ca. 10.9 nM at Station 10. In this study, we observed that the concentration of the biologically available inorganic iron decreased (i.e., pFe’ increased since it is the negative log of the inorganic iron concentration,Figure 9A) with increasingpCO2. However, this trend was reversed when iron concentrations were high enough to result in the formation of an inert fraction (i.e., when the solubility ofFe′was exceeded, and ferrihydrite was formed).
Copper was predominantly present bound to DOM (71–95%, Figure 8). Free Cu2+ concentrations were calculated to vary between ca. 10−12and 10−10nM, with increasingpCO2resulting in increased free Cu2+ concentrations (Figure 9B), as reported previously (Gledhill et al., 2015).
DISCUSSION
In this study we have undertaken the most comprehensive investigation to date into changes in the speciation of the trace metals iron and copper that result from changes in pH. We interpreted measurements of metal speciation using CLE-AdCSV with the discrete ligand approach and a NICA-Donnan modeling approach. We applied two data interpretation approaches in this study, but there are further approaches that have been applied to trace metal complexation in the marine environment including
FIGURE 6 | Plots of measured versus calculated metal added ligand concentrations obtained using parameter sets (A–C) applied to the NICA-Donnan model in vMINTEQ.Top panel, iron; bottom panel, Cu. The applied parameter set is given above the graph. For details of the parameter sets, seeTable 3.
those described in Pizeta et al. (2015), WHAM VII (Stockdale et al., 2011, 2015) and the Stockholm Humic Model (Gustafsson, 2001; Ndungu, 2012). In our discussion, we will first examine the changes in logKMeLcond
i,Me′ andLi,Me concentrations with pH obtained with the discrete ligand approach. We then assess the potential of the NICA-Donnan model as an alternative method for the interpretation of CLE titrations. Finally, we illustrate the potential utility of the NICA-Donnan approach through an investigation of the potential effects of an increase inpCO2on the iron and copper speciation in our shelf sea samples.
The Single Detection Window Discrete Ligand Approach
The discrete ligand approach allowed us to identify an increase in conditional stabilities for iron natural ligand complexes of the order of 1.9 log units with a decrease in pH from 8.05 to 7.2 (Figure 4), similar to that observed previously byGledhill et al. (2015) who observed an increase of 2 log units with a decrease in pH from 8.3 to 6.8. This increase in logKcondFeLi,Fe′with a decrease in pH provides further evidence for the dependence
of iron binding on the pH of seawater and suggests that in a more acidic ocean, ligand strengths are likely to increase relative to the strength of inorganic complexation, largely as a result of decreases in the concentration of hydroxide ions. Although the relative trend with pH was similar to previous observations, conditional stabilities for iron detected in this study were slightly stronger than those observed in the previous estuarine study, especially at lower pH. This could relate to real changes in binding site characteristics as DOM is transported offshore and aged. On the other hand, the experimental results on which the estuarine model was based were acknowledged to be less reliable below pH 8 as the detection window was not optimal (Gledhill et al., 2015). In this study, we adjusted the concentration of the added ligand HNN (from 2µmol L−1 used in Gledhill et al.
(2015)to 1µmol L−1in this study) in order to lower our detection window and thereby improve the reliability of estimates obtained with the discrete ligand approach at lower pH. The increase in the conditional stabilities observed at low pH could thus be related to a reduction in systematic errors associated with fitting the discrete ligand model resulting from improved detection window selection. Nevertheless, it was a notable feature of our study that
FIGURE 7 | Comparison of ligand concentrations estimated from measured MeALx(L(measured)) with ligand concentrations estimated from calculated MeALx(L(NICA−Donnan)) for (A) iron and (B) copper. (C)Box and whisker plots obtained for conditional stability constantsKcond
FeLi,Fe′from calculatedMeALx concentrations at pH 8.0, 7.6, and 7.2 for iron(C)and copper(D). The box incorporates the 25th and 75th percentiles, whilst outliers are plotted as black diamonds.
The parameter sets used to obtainMeALxare represented by the different colors (see legend).
the non-linear fit used for the discrete ligand approach was not significant at the 90% confidence level for many of our CLE- AdCSV titrations. A simple randomized error experiment on a simulated titration suggested that incurring a random error of 5% on each titration point would result in successful fit for only 4 out of 10 titrations. (i.e., if the titration was repeated on the same sample 10 times, only 4 of the resultant datasets would predict log KFeLcond
i,Fe′ orLi,Fe with >90% confidence), which is close to the number of titrations that returned logKFeLcondi,Fe′ and Li,Fefor our dataset. We chose HNN as the added ligand because it is possible to determine iron over a relatively wide pH range, however undoubtedly the level of random error incurred during our titrations was exacerbated by the use of an added ligand with relatively low sensitivity (ca. 0.8 nA nmol−1), which resulted in low peak heights, even for concentrations of iron present in samples in this shelf sea study.
In the case of copper, no trend in logKCuLcond
i,Cu′ was detected with decreasing pH (Figure 4). This is in contrast to the previous estuarine study where a decrease of 0.7 units from pH 8.0 to
7.2 was observed. Similarly, we did not observe any changes in Li,Cuwith a decrease in pH, unlike the small decrease observed in Gledhill et al. (2015). Although, the number of titrations that returned logKCuLcond
i,Cu′andLi,Cufor our copper dataset was higher than those for iron, the use of a high detection window (10µM SA) affected our ability to detect any significant changes in ligand stabilities outside our selected window. A high detection window also likely affected our ability to obtain good titration fits for all our samples.Li,Cu increased with dissolved copper concentrations and samples with the highest observedLi,Cuwere situated very close to the UK coastline (Station 7 and 8,Figure 1, Table S1).
The NICA-Donnan Approach
The addition of the added ligands to the thermodynamic database in vMINTEQ allowed us to calculate the concentrations of MeALxand thus directly compare them to those determined by CLE-AdCSV. This approach thus represents an alternative for interpreting CLE experiments. The approach is more robust, in
FIGURE 8 | Concentrations of metal complexed with DOM (bound), inert (ferrihydrite, iron only) or labile inorganic complexes (OH−, CO2−3 , etc) calculated for increasing concentrations of atmospheric CO2.Iron speciation is presented in the left column and copper speciation in the right column.pCO2 Applied to the model is indicated to the right of the figure.
that the complete dataset could be used to optimize the model parameters. Furthermore, the software could be used to account for inert components as well as binding with DOM to give a more complete picture of metal speciation. The approach thereby overcomes some of the bias introduced by a single detection window approach (Gledhill and Buck, 2012; Pizeta et al., 2015).
Our approach in this study was empirical, and further rigor could be achieved with a statistically sound optimization of the results, once basic parameters such as the number and acidity of marine DOM binding sites were known with greater certainty (e.g.,Weber et al., 2006). We found that incorporation of an inert phase was required in order to calculate Fe(NN)3
concentrations to within an order of magnitude of measured Fe(NN)3 concentrations in samples with high dissolved iron (Figure 5). We examined the addition of a “strong organic fraction” as an inert phase, but this resulted in an overall reduction in calculated Fe(NN)3 concentration when binding sites were under saturated, followed by large increases in Fe(NN)3 when binding sites were saturated. This pattern of behavior did not fit the measured Fe(NN)3 concentrations, which were low for titration points with zero added iron even for stations 10 and 14 where initial dFe concentrations were 21.0 and 10.6 nM, respectively. We therefore assumed an inert phase for iron with kinetically inhibited dissolution and which was thus