J. Clin. Chem. Clin. Biochem.
Vol. 26, 1988, pp. 617-622
© 1988 Walter de Gruyter & Co.
Berlin · New York
Accumulation of Iron and Iron Compounds in Liver Tissue
A Comparative Study of the Histological and Chemical Estimation of Liver Iron
By C. van Deursen
Department of Internal Medicine, M. de Metz
Department of Clinical Chemistry and Department of Pathology, J. Koudstaal
Department of Pathology and P. Brombacher
Department of Clinical Chemistry and Department of Pathology De Wever-Hospital, Heerlen, The Netherlands
(Received March 12/July 20, 1988)
Summary: Unsatisfactory results obtained by histological evaluation of liver tissue in iron loading diseases
prompted us to study the distribution of the total liver iron, haem iron and ferritin iron in post mortem human liver tissue from two different sites of the same liver. The total liver iron content was measured by flameless atomic absorption spectroscopy in native liver homogenates and in acid digested liver tissue from 60 consecutive autopsies, and the results from the two methods were compared. From the standard deviation of the duplicate analyses, it was deduced that the liver iron is possibly inhomogeneously distributed. The CV
duplo(22%) of total iron, measured in acid digested tissue was higher than the CV
duplo(14%) of total iron in homogenates ffom liver tissue from which non-homogenized tissue e. g. vessel walls, fibrotic tissue, had been removed.
The CV
dUpi
0of ferritin iron and haem iron in liver homogenate was 14% and 30% respectively. The ferritin iron increased with an increasing total iron content until saturation of ferritin iron appeared to be reached at 2.5 g ferritin iron per mg liver protein.
When the results of total non-beam liver iron measurements are expressed properly (amount of iron per i amount of homogenized liver protein), the distribution of iron is found to be homogeneous in both normal
and pathological liver tissues.
j It was concluded that the estimation of liver iron content by visual microscopic evaluation is unsatisfactory, and that more reliable results are obtained by atomic absorption spectrophotometry.
J. Clin. Chem. Clin. Biochem. / Vol. 26,1988 / No. 10
618 van Deursen et al.: Comparison of histological and chemical estimation of liver iron Introduction
While the liver is generally viewed as an homogeneous tissue, this is not always the case, especially in path- ological conditions (1). In the determination of iron in liver biopsy samples, conflicting results are reported for the sampling error, and it has been stated that there is a rather inhomogeneous distribution of total iron, especially in cirrhosis (2). It is not always clear how the results of one biopsy or consecutive biopsies from patients should be interpreted. Some authors report that the iron content does not differ in needle biopsy specimens taken from the left, right or centre lobes of the liver (3). We presumed that these conflict- ing data might be method-dependent when the influ- ence of blood contamination is excluded (4).
Traditionally the total iron or non-haem iron contents of the liver are measured chemically in acid digested tissue, and expressed as the amount of iron per amount of tissue weight (2—5). The weight includes functional liver tissue (liver parenchyma), connective tissue (vessels) and possibly fibrotic tissue, whereas the iron is mainly stored in functional liver tissue (6).
It is the iron in this latter tissue, which induces the harmful effects of iron overloading, such as fibrosis and possibly cirrhosis of the liver.
Moreover, the presence of fat and connective tissue (fibrosis, cirrhosis) will have its impact on the iron concentration in situ. Hence measurement of liver iron in functional liver tissue is preferred.
Our main interest is in partients with idiopathic hae- mochromatosis or haemosiderosis; the liver iron con- tents in these patients are of primary importance for diagnosis and therapy (6, 7).
The diagnosis of haemochromatosis or haemoside- rosis is made after histological examination and his- tochemical iron staining of liver biopsies. However, the degree of iron staining in histological slides does not necessarily reflect the total amount of iron pres- ent, which can be measured by chemical procedures after tissue destruction. For example, in Perfs staining method there is a difference in staining intensity be- tween ferritin and haemosiderin iron, while transferrin is not stained at all (8). This accounts for the poor correlation of results between histochemical and chemical methods for iron detection (9, 10). From a physiological point of view, iron overloading leads to an excess of ferritin and the formation of haemosi- derin, which is easily stainable and very important for determining the degree of haemochromatosis (7).
Chemical methods for iron analysis should therefore discriminate between haemosiderin and ferritin iron.
In the present work a method for iron analysis in
functional liver tissue, using graphite furnace atomic absorption spectroscopy is presented, which also ful- fills the above mentioned prerequisites for chemical iron analysis. This method was compared with a method based on acid digestion* pf liver tissue, and the distribution of iron was studied.
Materials and Methods
Liver tissue and sample preparation
Fresh human liver tissue from the right and left lobe was obtained from 60 consecutive autopsies. A portion of the tissue was processed for routine histologieal examination. The tissue was cut into small pieces (approx, 10 mg), frozen in liquid nitrogen and stored at — 80 °C. Thawed material was washed three times with 15 ml ice cold isotonic saline for 5 min. For mineralisation, the washed tissue was dried (110°C, 2h), weighed and decomposed at 90 °C for 2 h in a mixture of concentrated sulphuric acid and nitric acid in a ratio of 1 + 1 (by vol.). Approximately 1 ml of decomposition mixture was added to 25 mg of liver tissue (dry weight).
Liver homogenate was prepared in 200 ul H2O per 10 mg washed liver tissue by 20 strokes with a loose fitting pestle in a glass homogenizer. The homogenate was strained to remove non-homogenized material such as connective tissue etc. before the measurement of total iron (vide infra) and protein (11).
Atomic absorption spectroscopy
Flameless atomic absorption measurements were performed on a Perkin Elmer (Uberlirigen, F. R. G.) model 3030 spectropho- tometer with deuterium background correction, equipped with a PE HGA 500 graphite furnace atomizer (programmable) and a PE AG 40 autosampler. The iron hollow cathode lamp was from Instrumentation Laboratory no. 89225 (Paderno, Italy).
Due to the analytical sensitivity of this type of analysis, the samples (acid digested liver tissue or liver homogenate) must be diluted at least 200 times (by vol.) with 200 mmol/1 ammo- nium acetate containing 30 rnmol/1 nitric acid before analysis.
In this way the method is also perfectly suitable for the analysis of needle biopsies, as never more than an equivalent of 0.2 mg tissue is required. The measurement was performed according to Kreeftenberg et al. (2) with some modifications as described in table 1.
Tab. 1. Instrumental conditions for the determination of iron in liver tissue by flameless atomic absorption spectro- photometry.
Sample volume 20 μΐ
Fe-hollow cathode lamp 15 mA Slit width 0.2 nm, alternate Wavelength 248.8 nm
Deuterium background corrector on
Graphite furnace tube with L'vov platform, pyrolytic coated Purge gas, argon: 300 ml/min.
Dry cycle
Char cycle 250 °C130 °C 850 °C 1400 °C 2400 °C 2700 °C
10s10s 10s6s OsI s
rampramp rampramp rampramp
20s5s 10s5s 5s3s
holdhold holdhold holdhold Atomize cycle
Cleaning cycle
Signal processing, peak area, 3 s after »start atomize cycle.
Gas flow, interrupt at atomization.
Calibration mixtures were prepared from a ferric nitrate stand- ard solution (178 μπιοΙ/1) in 200 mmol/1 ammonium acetate containing 30 mmol/1 nitric acid. A linear calibration was ob- tained with mixtures with 0, 0.53, 1.07 and 1.61 μιηοΙ/1 iron.
Precision of the method was monitored with acid digested liver homogenate, stored at —80 °C in polypropylene cups.
Ferritin and haem iron
Haem iron is measured colorimetrically as haemicyanide after extraction, as described by Zuyderhoudt et al. (4). Liver ferritin was isolated from homogenates (protein concentration ca. 4 g/1) by heat treatment (70—75 °C, 5 min) and centrifugation as described by Zuyderhoudt et al. (4). Ferritin iron was measured in the supernatant, after dilution with 200 mmol/1 ammonium acetate, 30 mmol/1 nitric acid. Ferritin protein was measured with an immunoenzymatic assay of Hybritech Europe (Liege, Belgium) according to the manufacturer's instructions. The percentage of iron core in the ferritin molecule was calculated as (FeOOH)8 FeO3PO2H2 per ferritin protein (12).
Histological examination
The 46 samples of liver tissue were also processed for histologial examination, and iron was stained by the Prussian blue reaction (Perfs staining). The iron content was graded according to the modified Rowe system (13), i.e. visual evaluation of iron stain- ing by microscopy and classification into five grades according to intensity of staining in relation to the magnification.
% S *·
!i
^ O)ί z
o"o
0 1 2 3 4
Total iron in acid digested liver homogenate [^g/rng protein]
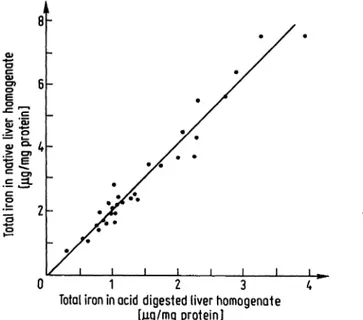
Fig. 1. Comparison of the iron contents, measured in native liver homogenate (y-axis) and acid digested homogenate (x-axis).
y = 1.06x - 0.21, n = 31, r = 0.98
Reagents
Unless specified outherwise, all reagents were purchased from Merck (Darmstadt, FRG).
Results
The influence of sample preparation on the total iron analysis
The influence of acid digestion was studied by com- paring the iron determination in native homogenate and dried and acid-treated homogenate. This results in a correlation coefficient of 0.98 (fig. 1).
A comparison between iron, which is determined in dried, weighed and acid digested tissue (including non- homogenized material) and iron, which is determined in native homogenate (without non-homogenized ma- terial) results in a correlation coefficient of 0.93 (fig.
2),Οc.
0>
> CD
0 1 2 3 4
Total iron in acid digested liver tissue [/ig/mg dry weight]
Fig. 2. Comparison of the iron contents measured in native liver homogenate (y-axis) and acid digested, dried liver tissue (x-axis)
y = 1.76X - 0.32, n = 31, r = 0.93
Liver iron content
The distribution of the liver iron content is shown in table 2. Ferritin iron and protein were measured in 10 randomly selected liver homogenates; the iron core in the ferritin molecules was 0.21 + 0.05 (x + 2 SD), as calculated by the ratio of the total iron content to total ferritin. Haem iron in congested livers (n = 4) was first measured separately, but as these data were in good agreement with those obtained from other
Tab. 2. Liver iron content
Iron content ^g/mg protein)
χ ± SD Range
Total iron (n = 60) Ferritin iron (n = 56) Haem iron (n = 36)
2.4+1.6 1.2 ±0.7 0.3 ± 0.1
0.2 ± 8.3 0.1 ± 3.3 0.1 ± 0.8 J. Clin. Chem. Clin. Biochem. / Vol. 26,1988 / No. 10
620 van Deursen et al.: Comparison of histological and chemical estimation of liver iron livers, they were included in the total group. The
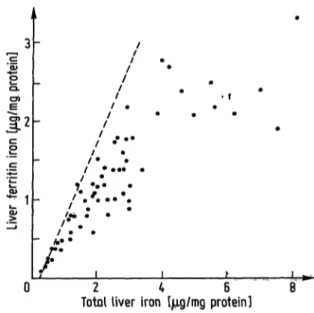
samples with a low total iron content contain pre- dominantly ferritin iron and haem iron, and hardly any haemosiderin iron. With increasing iron stores, the ferritin iron increases, but above a total iron content of ca. 3 μg/mg protein most iron is stored in insoluble compounds e. g. haemosiderin (fig. 3), which accounts for the difference between total iron and the sum of ferritin plus haem iron.
Influence of sampling
A fundamental problem in the determination of dif- ferences between the iron contents of different samples is that the comparison of analysis results is always influenced by the technical accuracy of the studied data. With insufficient analytical accuracy the possi- bility arises that real differences between samples may escape observation, or that observed small differences are due to analytical errors.
This problem was investigated by comparison of two remote tissue samples from the same liver with two samples from the same slice. We found that differ- ences in iron concentrations between liver homoge- nates from different samples (method I) were smaller than differences between samples after acid decom- position (method II) and this was invariably found for both the samples from remote parts of the liver and for samples from the same locus (tab. 3). More- over, taking into account the within-day coefficient of variation of the analysis (CV^um-day 4.5%), the differences between homogenates of samples from the same locus appeared to be small.
Histology
The results of the chemical liver iron determination were plotted against the grades of iron staining found by histological examination (fig. 4). A poor correla- tion between these two assessments of the liver iron content was observed. There is a considerable range of chemically determined values in the histological grade 0—2. The overlap of histological grades for a given chemically determined value is conspicuous.
Discussion
As stated in the introduction, the liver iron content should be expressed as the amount of iron per amount of functional liver tissue and not per total tissue weight (wet or dry). This requirement can be approx- imately met by iron determination in liver homoge- nates, from which collagenous tissue has been re- moved. In addition, if the iron is expressed per mg protein the presence of fat deposits will have no in-
I
/ «/·
Λ·«
0 2 4 6 8
Total liver iron t/ig/mg protein]
Fig. 3. Correlation between total liver iron and liver ferritin iron in native liver homogenate. The dashed line re^
presents the hypothetical outcome if all the liver iron is stored as ferritin iron and 0.3 μβ/π^ protein as haem iron.
Tab. 3. Influence of sampling on the measurement of iron in liver tissue.
Total liver iron, ferritin iron and haem iron were meas- ured in two samples from the same liver after homog- enization (method I). Total liver iron was also measured after drying, weighing and acid digestion of the tissue (method II).
Iron analysis CV duplo (percentage) Remote parts Local site Total iron (n = 60)
method I 14 method II 22 Ferritin iron (n = 56) 14 Haem iron (n = 36) 30
268 10
10
'S
t 8
σι σ>
S
TUT
Ι
0 1 2 3 4 5
Histological grade according to Rowe
Fig. 4. Liver iron content (atomic absorption spectrophoto- metry, AAS) in preparations with different histological grades (Rowe grading system).
fluence on the results. Moreover, the precison of iron determination in homogenates is better than in dried tissue samples (tab. 3, method I vs method II). Method comparison also shows that a better correlation coef- ficient is obtained between two iron determinations in homogenates freed from connective tissue etc. (des- ignated as "functional tissue homogenates", fig. 1), than between an iron determination in functional tissue vs in total liver tissue (fig. 2). This might be explained by the inhomogeneous distribution of tissue components like vessel walls, bile ducts, fibrotic (scler- otic) tissue and fat deposits. Only a few data are available from other publications on the distribution of iron at separate sites in the same liver, and in these publications, method dependency is not taken into account. It must be concluded from our results (tab.
3) that a large sampling error is not to be expected, when iron is appropriately measured, so that analyt- ical bias does not really contribute to the observed differences. A correction for haem iron at low total iron contents might be needed, because blood clots can be distributed non-homogeneously in the liver
tissue.When the iron content is measured with flameless atomic absorption spectroscopy, sample preparation by destruction of tissue with strong acid before intro- ducing it into the graphite furnace is not necessary.
The instrument setting can be chosen to minimize matrix effects and imprecision. This is shown in figure 1, where iron determinations in native liver homoge- nate and in acid digested homogenate are compared.
The correlation is good (r = 0.98), but since acid digestion may accidentally introduce contamination, we prefer a direct analysis of liver homogenate. More- over, in flameless atomic absorption a sample size of over 0.2 mg tissue is never required, so that needle biopsies can always be investigated.
A comparison of results for the iron content from different laboratories is often only possible after re- calculation. For this recalculation we assumed that fresh liver tissue contains 80% water and that 50%
of the dry weight is protein. When our data (tab. 2) are compared with the values found in the literature for a reference group (6, 10), higher values for the iron content are to be expected, because the liver tissue was obtained post mortem from elderly people.
The liver iron content increases with age (14), whereas the haem iron content is somewhat higher in post mortem material than in fresh biopsy specimens (4).
Ferritin iron and ferritin protein were measured in the supernatant of heat denatured liver homogenates.
This fraction contains to a large extent the total non- haem iron pool in normal individuals (15 — 18). The iron core in the ferritin molecule can also be calculated
and values between 0.10 and 0.40 of iron have been reported (4, 18). We have found an average iron core in ferritin of 0.21 and will continue to measure this parameter routinely in biopsies. Although its clinical relevance is unclear, the data might be used for quality control purposes.
A correlation between the total iron content and the ferritin iron is depicted in figure 3. A more or less linear correlation is seen up to a total iron concentra- tion of 3 g/mg protein. This value is approximately in agreement with the value for the hepatic iron con- centration above which values must be considered abnormal (10). The ferritin iron appears to be rela- tively constant at elevated total iron concentrations, whereas insoluble iron (haemosiderin) increases. The increase in haemosiderin iron seems to be prognostic for toxic effects of iron overloading (7), but the clinical implication of the measurement of the ferritin iron/
haemosiderin iron ratio for the individual patients needs to be evaluated.
The increase in ferritin iron to a certain level and the concurrent increase in the ferrition iron/haemosiderin ratio was also found by Seiden et al. (15,17), although they use a Chromatographie method for the separation of haem iron, ferritin iron and haemosiderin in liver biopsies and focus on heavy iron overloading (Fe above 10 g/mg protein). Zuyderhoudt et al. (18) could not confirm that the ratio ferritin iron/haemosiderin fell with increasing iron overload. They suggest that storage conditions might be reponsible for this dis- crepancy, but we could not validate this. We could, however, not exclude the possibility that part of the ferritin becomes less soluble post mortem (before freezing the tissue) and is then determined as insoluble haemosiderin.
It is apparent that the histological iron grading is insufficient for a precise and accurate evaluation of the liver iron content. There is a considerable overlap between various histological grades in samples with comparable iron contents as determined by chemical analysis.
For better understanding, chemical methods of iron analysis have to include the determination of the different forms of iron and iron compounds. In this paper we have described chemical methods, but in our laboratory we also recently introduced a histo- chemical method for ferritin staining, in addition to iron staining with Perfs blue. It now seems that earlier reported discrepancies between data obtained either by chemical or by histochemical methods for iron analysis (9, 10) may be due to hitherto insufficient knowledge of the nature and distribution of the iron compounds concerned.
J. Clin. Chem. Clin. Biochem. / Vol. 26,1988 / No. 10
622 van Deursen et al.: Comparison of histological and chemical estimation of liver iron References
1. Maharaj, B., Maharaj, R. J., Leary, W. P., Cooppan, R.
M., Naran, A. D., Pirie, D. & Pudifin, D. J. (1986) Lancet 7,523-525.
2. Kreeftenberg, H. G., Koopman, B. J., Huizenga, J. R., van Vilsteren, T., Wolthers, B. G. & Gips, C. H. (1984) Clin.
Chim. Acta 144, 255-262.
3. van Eijk, H. G., Wiltink, W. F., Gre Bos & Goossens, J.
P. (1974) Clin. Chim. Acta 50, 275-280.
4. Zuyderhoudt, F. M. J., Hengeveld, P., van Gool, J. &
Jörning, G. G. A. (1978) Clin. Chim. Acta 86, 313-321.
5. Barry, M. & Sherlock, S. (1971) Lancet /, 100-103.
6. Gollan, J. L. (1983) Gastroenterology 84, 418-421.
7. Tavill, A. S. & Bacon, B. R. (1986) Hepatology 6, 142- 8. Richter, G. W. (1978) Am. J. Pathol. 91, 363-396.145.
9. Brissot, P., Bourel, M., Herry, D., Verger, J. P., Messner, M. Beaumont, C., Regnouard, F., Ferrand, B. & Simon, M. (1981) Gastroenterology 80, 557-565.
10. Edwards, C. Q., Caroll, M., Bray, P. & Cartwright, G. E.
(1977) N. Eng. J. Med. 297, 7-13.
11. Lowry, O. M., Rosebrough, N. J., Parr, A. L. & Randall, R. J. (1951) J. Biol. Chem, 193, 265-275.
12. Zuyderhoudt, F. M. J., Linthorst, C. & Hengeveld, P.
(1978) Clin. Chim. Acta 90, 93-99.
13. Searle, J. W., Kerr, J. F. R., Hailiday, J. W. & Powell, L.
W. (1987) Iron storage disease. In: Pathology of the liver (MacSween, K. N. M., Anthony, P. P. & Scheuer, P. J., eds.) 2nd ed. pp. 181-201. Churchill Livingstone, Edin- burgh, London, Melbourne and New York,
14. Bassett, M. L., Hailiday, J. W. & Powell, L. W. (1986) Hepatology 6, 24^29.
15. Cham, B. E., Roeser, P., Nudes, A. C. & Ridgway, K. M.
(1986) Clin. Chim. Acta 158y 71-79.
16. Seiden, C., Owen, M., Hopkins, J. M. P. & Peters, T. J.
(1980) Br. J. Haematol. 44, 593-603.
17. Seiden, C. & Peters, T. J. (1979) Clin. Chim. Acta 98, 47-52.
18. Zuyderhoudt, F. M. J., Sindram, J. W., Marx, J. J. M., Joining, G. G. A. & van Gool, J. (1983) Hepatology 3>
232-235.
Prof. Dr. P. J. Brombacher Department of Clinical Chemistry De Wever-Ziekenhuis
P.O. Box 4446 NL 6401 CX Heerlen