Doctoral Thesis
A novel, high-precision stable iron isotope method for objective evaluation of iron metabolism in humans and its application to monitor the effectiveness of programs to improve iron nutrition
Author(s):
Speich, Cornelia Publication Date:
2020
Permanent Link:
https://doi.org/10.3929/ethz-b-000451295
Rights / License:
In Copyright - Non-Commercial Use Permitted
This page was generated automatically upon download from the ETH Zurich Research Collection. For more information please consult the Terms of use.
A novel, high-precision stable iron isotope method for objective evaluation of iron metabolism in humans and its application to monitor the effectiveness of programs
to improve iron nutrition
a thesis submitted to attain the degree of DOCTOR OF SCIENCES of ETH ZURICH
(Dr. sc. ETH Zurich)
presented by
CORNELIA FRANZISKA SPEICH
MSc in Food Science, ETH Zurich, Switzerland
born on 19.11.1990
citizen of Münchenstein, BL, Switzerland
accepted on the recommendation of
Prof. Dr. med. Michael B. Zimmermann, examiner Prof. Dr. med. Gary M. Brittenham, co-examiner
Prof. Dr. Susan Fairweather-Tait, co-examiner Dr. Diego Moretti, co-examiner
2020
Life is like riding a bicycle.
To keep your balance you must keep moving.
Albert Einstein
dedicated to my grandma
ACKNOWLEDGEMENT
I would like to express my gratitude to Prof. Dr. Michael B. Zimmermann for giv- ing me the opportunity to carry out such an interesting and complex PhD project at the Human Nutrition Laboratory, for his outstanding scientific knowledge, and
enthusiasm.
***
I am deeply grateful to my supervisors Dr. Colin Cercamondi and Dr. Diego Moretti for their exceptional supervision, endless encouragement, numerous val- uable inputs and all the stimulating discussions we had, for being both, challeng-
ing and motivating and for all the patience they had.
***
A special thank you also goes to Prof. Dr. Gary M. Brittenham for being the brain of the dilution of stable iron isotopes methodology and for never stopping being enthusiastic about this methodology, his invaluable guidance and for never losing
patience. I learned so much.
***
My sincere thanks go to Prof. Dr. Susan Fairweather-Tait for enthusiastically ac- cepting the task of being co-examiner of my thesis.
***
For the fruitful collaboration with Université d’Abomey-Calavi, Benin, College of Medicine in Blantyre, Malawi, and the Clinical Trials Center at University Hospital
in Zurich I would like to thank Dr. Evariste Mitchikpè, Prof. Dr. Kamija Phiri, Dr.
Thandile Nkosi-Gondwe, Dr. Martin Mwangi, Dr. med. Saidon Banda, Dr. med.
Fabian Tay, Dr. med. Doris Wisler, Livia Löffler, Diana Verner, and Monika Spital- eri and all the other diligent workers of these institutions involved in my projects.
***
Of course, all my projects would not have been possible without the generous contribution of all my participants in Benin, Malawi, and Switzerland. Thank you.
***
Carrying out a study in Benin was one of the most enriching experiences in my life. Travailler au Benin a été l’une des expériences les plus enrichissantes de ma
vie. Rien n’aurait toutefois pu être possible sans l’engagement inconditionnel de mon équipe: Gloria Padonou, Linérolle Fassinou, Evariste Mitchikpè, et spéciale-
ment mon équipe à Natitingou, Karl Koumagou, Dieudonné Yeropa et Adolphe Yakonta. Grand merci ! (… et je ne vais jamais trouver assez de mots pour adé- quatement remercier Ntcha pour tout ce qu’il a fait pour que je puisse me sentir
chez moi même à des milliers de kilomètres de ma propre patrie).
***
Thanks also to all my committed and hard working students: Hanna von Sieben- thal, Celeste Graf, Isabelle Rüfenacht, Joanne Büchi, Lena Fischer, Sidonia Schu-
bert, Matthias Buchli, Sandra Martinek, Sophia Morsten, Sarah Date, and Mathilda Freymond. Without them, I would still be locked in clean lab for ages…
***
Many thanks also to all present and former members of the Human Nutrition La- boratory for their support and home feeling. A special thank you goes especially to my wonderful office mate Sandra Hunziker for being there for me, for always having an open ear and valuable suggestions to solve any of my problems over
the course of the last four-plus years at HNL. Special thanks also go to Chris- tophe Zeder for all his support with all kind of technical issues, either in the lab or with calculations. I am grateful to Timo Christ and Adam Krzystek for all their
technical support and for measuring all my 1369 prepared stable iron isotopes blood samples with their ICP-MS.
***
Funding by ETH Zurich, Swiss Foundation for Nutrition Research and the Walter Hochstrasser Foundation is highly appreciated.
***
Finally, a big and sincere thank you to my wonderful family, my parents Simone and Hansjakob, my sister Isabelle, my brother Reto, and my grandmother Rosmarie for always supporting me no matter what I do, for encouraging me during this journey and for all the endless airport rides during the last few years.
A very big thank you also goes to all my fantastic and loyal friends supporting and encouraging me all the time.
TABLE OF CONTENT
FIGURES ... VI TABLES ... VII ABBREVIATIONS ... VIII
SUMMARY ... 1
ZUSAMMENFASSUNG ... 7
INTRODUCTION ... 13
LITERATURE REVIEW ... 17
1 Iron in human nutrition ... 17
1.1 Physicochemical properties of iron ... 17
1.2 Iron in the human body ... 18
Erythropoiesis and heme synthesis ... 19
1.3 Iron absorption ... 22
1.4 Iron losses ... 23
1.5 Iron homeostasis ... 30
Cellular regulation of iron homeostasis ... 32
Systemic regulation of iron homeostasis ... 32
Iron homeostasis during immune response ... 34
1.5.3.1 Iron homeostasis during anemia of chronic disease ... 35
1.5.3.2 Iron homeostasis during malaria infection ... 35
1.5.3.3 Iron homeostasis and hookworm infestation ... 36
1.5.3.4 Iron homeostasis during schistosomiasis ... 37
1.5.3.5 Iron homeostasis and Helicobacter pylori infestation... 38
1.6 Iron requirements ... 39
Factorial modeling of iron requirements ... 40
Dietary iron intake recommendations ... 42
2 Iron status assessment ... 49
2.1 Assessment of the inflammatory status ... 53
2.2 Common iron status parameters ... 53
Serum ferritin ... 55
Transferrin receptor ... 58
sTfR-to-SF-ratio / Cook body iron stores ... 59
Hemoglobin ... 61
Free erythrocyte / zinc protoporphyrin ... 62
Serum iron ... 63
Stainable iron in bone marrow ... 64
Further iron indices ... 65
2.3 Stable iron isotopes to assess iron metabolism ... 66
Isotope erythrocyte incorporation approach ... 68
2.3.1.1 Conversion of the isotope ratio R into the actual amount of an isotopic tracer present in the blood ... 72
Dilution of stable iron isotopes approach ... 74
2.3.2.2 Dilemma of un-equilibrated iron stores during iron supplementation ... 76
Dilution of other nutrients’ stable isotope composition ... 78
3 Nutritional iron deficiency ... 82
3.1 Prevalence of iron deficiency, anemia and iron deficiency anemia ... 82
Etiology of iron deficiency ... 82
Consequences of iron deficiency ... 83
3.2 Strategies to combat nutritional iron deficiency ... 87
Iron fortification ... 88
Iron supplementation ... 89
References ... 92
MANUSCRIPT 1 ...121
MANUSCRIPT 2 ...139
MANUSCRIPT 3 ...177
MANUSCRIPT 4 ...223 GENERAL DISCUSSION AND CONCLUSIONS ...263 CURRICULUM VITAE ...279
FIGURES
Figure 1: Estimated size of the main iron compartments in healthy adults. ... 18
Figure 2: Visualization of erythropoiesis. ... 20
Figure 3: The heme biosynthetic pathway. ... 21
Figure 4: Decay of radioactivity in circulating erythrocytes of normal man. ... 24
Figure 5: Summary of the most important processes of iron homeostasis. ... 31
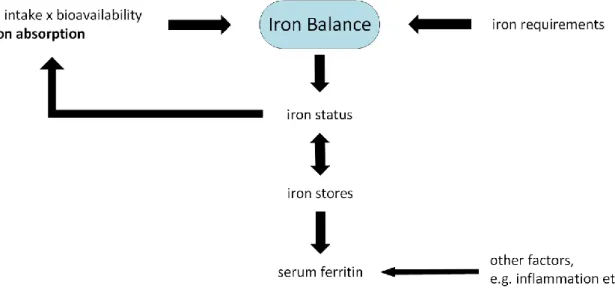
Figure 6: Iron balance. ... 39
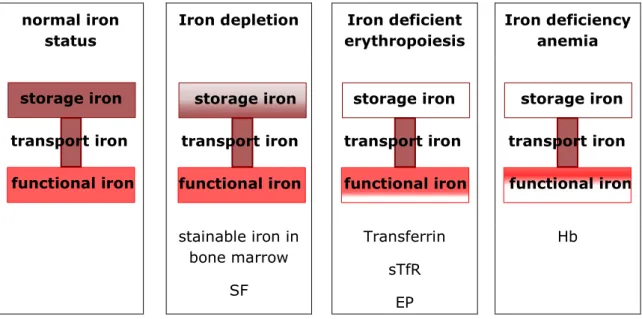
Figure 7: Body iron compartments in different stages of iron deficiency. ... 50
Figure 8: Iron deficiency prevalence with different iron indices. ... 58
Figure 9: Aspirates of normal bone marrow in Perl’s stain. ... 64
Figure 10: Basic principles of the isotope erythrocyte incorporation approach.. 69
TABLES
Table 1: Isotopic composition of iron and isotope abundances ... 17
Table 2: Iron excretion of women and men in the most prominent studies ... 26
Table 3: Median iron requirements estimated by WHO/FAO. ... 27
Table 4: Median iron requirements estimated by IOM. ... 28
Table 5: Important dietary iron absorption influencers. ... 43
Table 6: Algorithms and models used to estimate iron bioavailability. ... 47
Table 7: Population dietary iron reference intake values. ... 48
Table 8: Commonly used iron indices. ... 51
Table 9: Main causes of absolute iron deficiency and iron deficiency anemia. .. 85
Table 10: Synthesis of thesis results. ...269
ABBREVIATIONS
AGP α-1 acid glycoprotein
amA abundance of an isotope with a given mass number m in tracer A amB abundance of an isotope with a given mass number m in tracer B amnat abundance of an isotope with a given mass number m in nature BIS Cook body iron stores
BMP bone morphogenetic protein
BRINDA Biomarkers Reflecting the Inflammation and Nutritional Determi- nants of Anemia Working Group
bw body weight
C carbon
13C carbon with 6 protons and 7 instead of 6 neutrons CO carbon monoxide
CO2 carbon dioxide
12CO2/13CO2 carbon dioxide with carbon atoms of 6 and 7 neutrons, respectively C18O2 carbon dioxide with heavy oxide (10 neutrons instead of 8)
Cr chromium
CRP C-reactive protein
65Cu copper with 29 protons and 36 instead of 35 neutrons DALY disability-adjusted life year
DMT divalent metal transporter DRI dietary reference intakes DRV dietary reference values
EAR Estimated Average Requirement EFSA European Food Safety Authority
EIC erythrocyte incorporation correction factor ELISA Enzyme-linked Immunosorbent Assay EP erythrocyte protoporphyrin
Epo erythropoietin
Fe iron
Fe2+ ferrous iron Fe3+ ferric iron
57Fe iron 57 with 26 protons and 31 neutrons (instead of 30 neutrons)
58Fe iron 58 with 26 protons and 32 neutrons (instead of 30 neutrons) Feabs daily amount of iron absorbed [mg/d]
Fecirc circulating iron / erythroid iron Fegain net iron balance per day [mg/d]
Feloss daily amount of iron lost [mg/d]
Festore storage iron
Fetissue tissue iron (iron in muscles and enzymes)
Fetotal total body iron [mg]
Fpn ferroportin
2H deuterium (hydrogen containing 1 proton and 1 neutron)
Hb hemoglobin
HIF hypoxia-inducible factor
HIV human immunodeficiency virus H2O water
2H2O deuterium oxide / heavy water
2H218O heavy oxygen water
I iodine
IAEA International Atomic Energy Agency
ICP-MS inductively coupled plasma mass spectrometry ID iron deficiency
IDA iron deficiency anemia IL interleukin
IOM US Institute of Medicine
IRE iron-responsive element on messenger ribonucleic acid (mRNA) IRP iron regulatory protein
iv intravenous
JAK Janus tyrosine kinase
kabs rate of change of body iron or rate of decrease in body iron compo- sition; proportional to iron absorption [mmol/d]
kD kilo Dalton
kloss rate of decrease in body iron; proportional to iron loss [mmol/d]
LIP labile iron pool
mRNA messenger ribonucleic acid
14N nitrogen with 7 protons and 7 neutrons
15N nitrogen with 7 protons and 8 neutrons
nA amount (in mol) of isotopic tracer A
NHANES National Health and Nutrition Examination Survey of the United States of America
nnat amount (in mols) of natural iron NTBI non-transferrin bound iron
Ntotal total body iron of mixed isotopic composition
18O heavy oxygen (with 8 protons and 10 instead of 8 neutrons) R isotope ratio
RDI Reference daily intake / recommended daily allowance RNA ribonucleic acid
SD standard deviation SF serum ferritin
sTfR soluble transferrin receptor Tf transferrin
TfR transferrin receptor
TIMS thermal ionization mass spectrometry US United States (of America)
WHO World Health Organization
WHO/CDC World Health Organization and the Centers for Disease Control and Prevention at the US Ministry of Health
WHO/FAO World Health Organization and the Food and Agriculture Organiza- tion of the United Nations
Zn zinc
ZPP zinc protoporphyrin
SUMMARY
Background
Iron deficiency is considered the most common nutritional disorder in the world and is responsible for a substantial health burden in both developed and develop- ing countries. Nutritional iron deficiency occurs when physiological iron require- ments cannot be covered by iron absorption. Dietary iron bioavailability is a key determinant of iron status, and is a function of both dietary and physiological fac- tors (e.g. iron status, infection and inflammation, hypoxia, anemia). Iron require- ments for growth and increased blood losses caused for example by menorrhagia, gastrointestinal bleeding provoked by intestinal parasites (hookworm) or by other gastrointestinal injuries, or also extensive endurance training are other possible contributors to the high prevalence of iron deficiency and anemia.
Quantification of the impact of different risk factors affecting iron metabolism is difficult. Conventional iron indices can be used to assess iron balance, but do not distinguish between iron absorption and iron losses. Furthermore, known iron in- dices are often strongly biased by underlying inflammation, limited precision, high day-to-day variability, and measure iron absorption only indirectly. Among the many potential reasons for the failure of health and nutrition policies to decrease the burden of iron deficiency, the inability to distinguish between iron absorption and iron loss and to accurately assess iron status may not be adequately appreci- ated.
Objectives
The overall aim of this thesis was to develop and evaluate the dilution of stable iron isotopes methodology to provide I) an adequate measure for the assessment of iron interventions by precisely quantifying iron absorption, iron losses as well as resulting iron balance, and II) reliable data on iron requirements and turnover in different populations.
Methods
As iron absorption is naturally low and depending on many factors, dietary iron intake recommendations consistent with good health need to be higher than just the amount of iron required to compensate for obligatory iron losses (and iron needs for growth in children). Factors converting physiological iron requirements into dietary reference values are required. In manuscript 1 we tested the applica- bility of a recently developed probability-model for the determination of such con- version factors for the British (Western) diet in a different diet, here the typical diet in Benin. Without knowing actual amounts of iron absorbed, the probability model estimates dietary iron bioavailability through matching the observed prev- alence of iron insufficiency (based on serum ferritin (SF) concentrations <15 µg/L) to the prevalence of iron insufficiency predicted for a series of postulated iron ab- sorption values (1–40%) and measured dietary iron intakes. Requirements of ab- sorbed iron are extrapolated from iron excretion data in adult men and from one of the very rare datasets assessing iron excretion data in menstruating women.
In manuscripts 2–4 we provided more such scarce, directly measured data on iron balance by directly measuring iron absorption and iron losses using the stable iron isotopes dilution methodology. Administration of small amounts (normally 2–
20 mg) of an isotopic iron label (54Fe, 57Fe, or 58Fe) permanently modifies the iron isotopic signature in the body. After equilibration of the isotopic signature in all body compartments, altered isotopic signature asymptotically converges towards natural isotopic composition (i.e. isotopic signature before tracer administration) by dilution of the altered signature with dietary iron of natural isotopic composition.
The rate of this dilution is proportional to iron absorption over the long-term.
In manuscript 2 we assessed the dilution of stable iron isotopes methodology under strictly supervised conditions in Gambian toddlers consuming micronutrient powders containing 12 mg iron as ferrous fumarate for 3 months followed by a 3 months control period without iron supplementation. In manuscript 3 we as- sessed the dilution of stable iron isotopes methodology in young women in Benin and in Switzerland consuming iron supplements containing 50 mg iron as ferrous sulfate for 4 and 3 months, respectively, followed and preceded by a 4 months (3 months, respectively) period without iron supplementation. In manuscript 4 we assessed the dilution of stable iron isotopes methodology in healthy Malawian
schoolchildren (4.8–7.2 years) in a two years observational study without any iron intervention.
Results
In manuscript 1, applying the recently developed probability model for the de- termination of iron absorption conversion factors in the British (Western) diet in the Beninese diet, we found an iron bioavailability of 6%. The use of different distributions of requirements of absorbed iron did not affect the iron bioavailability estimation, except at low SF concentrations.
All our direct measurements of iron absorption and iron losses in manuscripts 2–
4 revealed values broadly consistent to estimates derived through factorial mod- eling of data from Western populations by important institutions such as World Health Organization (WHO), Food and Agriculture Organization of the United Na- tions (FAO), the American Institute of Medicine (IOM), or the European Food Safety Authority (EFSA).
In anemic Gambian toddlers, iron absorption increased ~3.8-fold during iron sup- plementation, resulting in iron absorption covering recommendations for absorbed iron and iron needed for growth during iron supplementation, but not without sup- plemental iron. Interestingly, also iron losses increased ~3.4-fold during iron sup- plementation in these Gambian toddlers (manuscript 2).
In young women in Benin, 4-months iron supplementation increased iron absorp- tion ~3.4-fold compared to pre- and post-intervention control period while iron losses remained nearly constant. In young women in Switzerland, 3-months iron supplementation increased iron absorption ~2.7-fold compared to pre-intervention control period and ~4.2-fold compared to post-intervention control period when iron status was improved. Similarly to what we found in The Gambia, iron losses in women in Switzerland increased by ~3.3-fold compared to pre-intervention con- trol period during iron supplementation and remained elevated during post-inter- vention control period (manuscript 3).
In manuscript 4 we would like to emphasize on the adequacy or the iron intake recommendations by WHO/FAO for African children, even though these estimates
have originally been derived from Western populations. Absorbing similar propor- tions of iron, increases in total body iron of our Malawian children are comparable to increases in total body iron of WHO/FAO model child, even though our African children started from substantially lower levels. Still, due to a lack in available iron in the diet, upregulation of iron absorption in response to erythropoietic demand was not possible.
Conclusions
Estimated iron bioavailability of 6% in the Beninese diet is in good agreement with results from earlier multiple meal iron isotope studies in the same subjects and also fits well with an estimated iron bioavailability of 5% typical for monotonous cereal-based diets in African countries, used by WHO to derive dietary recommen- dations. Thus, the recently developed probability model for the determination of iron absorption conversion factors in the British (Western) diet may be used for estimating dietary iron bioavailability in diets differing from a Western type diet.
However, the use of different distributions of requirements of absorbed iron did affect the iron bioavailability estimation at low SF concentrations and calls for more data on requirements of absorbed iron, especially in populations with low SF con- centrations (manuscript 1).
Data provided in manuscripts 2–4 are a first step in understanding and quanti- fying such context specific iron requirements. Reliability of the dilution of stable iron isotopes methodology is supported by external and internal consistency of our results: Externally, our measured iron absorptions, iron losses and net iron bal- ances are generally well comparable to values derived through factorial modeling of data from Western populations by WHO, FAO, IOM, and EFSA. Internally, the net iron balance calculated conventionally (total body iron at the end of observa- tion minus total body iron at baseline) was well comparable to that determined isotopically (absorption minus losses) in all our studies.
We recommend the dilution of stable iron isotopes methodology as a precise ref- erence method for evaluating programs of iron fortification and supplementation as well as for assessing iron bioavailability and iron requirements in free-living individuals, providing new insights into iron uptake and turnover in health and disease independently from indirect iron indices and their limitations.
Increased iron losses during iron supplementation in anemic Gambian toddlers and young women in Switzerland, but not in young women in Benin, absolutely require further confirmation and investigation of the pathophysiological mechanisms re- sponsible, before, potentially, resulting in the development of new iron formula- tions.
ZUSAMMENFASSUNG
Hintergrund
Eisenmangel ist weltweit wohl die am häufigsten auftretende Mangelernährung und trägt sowohl in Entwicklungsländern als auch in Industrieländern substanziell zur Belastung der Volksgesundheit bei. Eisenmangel entsteht, wenn das durch die Nahrung aufgenommene Eisen den physiologischen Eisenbedarf nicht decken kann. Die Bioverfügbarkeit von Eisen in der Nahrung ist daher eine wichtige De- terminante für den Eisenstatus einer Person. Die Bioverfügbarkeit von Eisen hängt sowohl von ernährungsspezifischen als auch von physiologischen Faktoren ab (z.B.
Eisenstatus, Vorkommen von Infektionen und Entzündungen, Hypoxien, Anämien etc.). Neben der Bioverfügbarkeit von Eisen sind auch der erhöhte Eisenbedarf im Wachstum sowie hohe Blutverluste, beispielsweise ausgelöst durch Menorrhagie oder gastrointestinale Blutungen (z.B. durch Darmparasiten oder andere gastroin- testinale Verletzungen), oder auch ein umfangreiches sportliches Ausdauertraining weitere wichtige Ursachen für Eisenmangel und Anämie.
Die Quantifizierung der Auswirkungen verschiedener Risikofaktoren auf den Eisen- stoffwechsel ist schwierig. Herkömmliche Eisenindizes können zur Beurteilung des Eisengleichgewichts verwendet werden, bestimmen aber Eisenabsorption und Ei- senverluste nicht einzeln. Darüber hinaus variieren bekannte Eisenindizes häufig stark von Tag zu Tag und können von verschiedenen Infektionen und Entzündun- gen manipuliert sein. Ihre Präzision ist damit limitiert. Generell bestimmen her- kömmliche Eisenindizes die Eisenabsorption resp. das Eisengleichgewicht nur indi- rekt. Die fehlende Möglichkeit, Eisenabsorption und Eisenverluste zu quantifizieren sowie den Eisenstatus zuverlässig zu bestimmen, könnte eine wichtige, unter- schätzte Rolle bei der Erklärung des fehlenden Erfolgs verschiedener Gesundheits- und Ernährungsstrategien spielen.
Zielsetzung
Das übergeordnete Ziel dieser Arbeit war es, die Eisenisotopen-Verdünnungs-Me- thode weiter zu entwickeln und zu evaluieren, um I) eine akkurate Grösse für die Bewertung von Eiseninterventionen bezüglich Eisenabsorption, Eisenverlusten und
Eisengleichgewicht zur erhalten, und II) zuverlässige Daten zum Eisenbedarf und –umsatz verschiedener Bevölkerungsgruppen zu generieren.
Methodik
Da die Eisenaufnahme von Natur aus gering ist und von vielen Faktoren abhängt, müssen die Referenzwerte für die für eine gute Gesundheit benötigte Eisenzufuhr grösser sein als nur die Eisenmenge, die zum Ausgleich der unabdingbaren Eisen- verluste (und des Eisenbedarfs für das Wachstum bei Kindern) erforderlich ist.
Umrechnungsfaktoren, die den physiologischen Eisenbedarf in Referenzwerte für die Eisenzufuhr umwandeln, sind erforderlich. In Manuskript 1 haben wir die An- wendbarkeit eines kürzlich entwickelten Wahrscheinlichkeitsmodells zur Bestim- mung solcher Umrechnungsfaktoren für die britische (westliche) Ernährung in ei- ner anderen Ernährung, hier in Benin, getestet. Ohne die tatsächlich absorbierte Eisenmenge zu kennen, schätzt das Wahrscheinlichkeitsmodell die Bioverfügbar- keit von Eisen in der Nahrung, indem es die beobachtete Eiseninsuffizienzprävalenz (basierend auf einer Serum Ferritin (SF)-Konzentrationen <15 µg/L) an die Ei- seninsuffizienzprävalenz für eine Reihe postulierter Eisenabsorptionswerte (1–
40%) und an die tatsächlich bestimmte diätische Eisenzufuhr anpasst. Der Bedarf an absorbiertem Eisen für die Prognostizierung verschiedener Eisenabsorptions- werte wird dabei aus Daten zur Eisenausscheidung von erwachsenen Männern und aus einem der raren Datensätze zur Eisenausscheidung bei menstruierenden Frauen extrapoliert.
In den Manuskripten 2–4 generierten wir nun selbst weitere Datensätze zur Ei- senabsorption und Eisenausscheidungen in verschiedenen Bevölkerungsgruppen, indem wir die Eisenabsorption und die Eisenverluste mithilfe der Eisenisotopen- Verdünnungs-Methode direkt massen. Die Verabreichung kleiner Mengen (norma- lerweise 2–20 mg) eines (reinen) stabilen Eisenisotopes (54Fe, 57Fe oder 58Fe) zu Markierungszwecken verändert die Eisenisotopensignatur im Körper dauerhaft.
Sobald sich die Eisenisotopensignatur in allen Organen des Körpers im Gleichge- wicht befindet, konvergiert die veränderte Isotopensignatur durch Verdünnung mit Eisen mit natürlicher Isotopenzusammensetzung, das nur durch Eisenaufnahme zugeführt werden kann, asymptotisch zur natürlichen Isotopenzusammensetzung
(d.h. zur Isotopensignatur vor der Verabreichung der Markierung) zurück. Die Ge- schwindigkeit dieser Verdünnung ist proportional zur Eisenabsorption.
In Manuskript 2 evaluierten wir die Eisenisotopen-Verdünnungs-Methode in gam- bischen Kleinkindern, die drei Monate lang unter strenger Aufsicht ein Mikronähr- stoffpulver mit 12 mg Eisen als Eisenfumarat konsumierten, und danach während weiterer drei Monate zu Vergleichszwecken in unserer Studie verblieben. In Ma- nuskript 3 evaluierten wir die Eisenisotopen-Verdünnungs-Methode bei jungen Frauen in Benin und in der Schweiz, die während vier bzw. drei Monaten Eisenprä- parate mit 50 mg Eisen als Eisensulfat konsumierten und davor und danach wäh- rend weiterer vier respektive drei Monaten zu Kontrollzwecken studiert wurden. In Manuskript 4 beschreiben wir eine zweijährige Beobachtungsstudie ohne Eisen- intervention, in der wir die Eisenisotopen-Verdünnungs-Methode bei gesunden, malawischen Schulkindern (4.8–7.2 Jahre alt) evaluierten.
Ergebnisse
Mittels des kürzlich entwickelten Wahrscheinlichkeitsmodells zur Bestimmung der Eisenbioverfügbarkeit in der britischen (westlichen) Ernährung konnten wir in der beninischen Ernährung eine Eisenbioverfügbarkeit von 6% bestimmen. Die Ver- wendung unterschiedlicher Verteilungen des Bedarfes an absorbiertem Eisen ver- änderte die Bioverfügbarkeit von Eisen nur bei niedrigen SF-Konzentrationen (Ma- nuskript 1).
Alle unsere direkten Messungen der Eisenabsorption und der Eisenverluste in den Manuskripten 2–4 ergaben Werte, die weitgehend mit Schätzungen überein- stimmen, die durch faktorielle Modellierung von Daten westlicher Bevölkerungs- gruppen von wichtigen Institutionen wie der Weltgesundheitsorganisation (WHO), der Ernährungs- und Landwirtschaftsorganisation der Vereinten Nationen (FAO), des American Institute of Medicine (IOM) oder der Europäischen Behörde für Le- bensmittelsicherheit (EFSA) etabliert wurden.
Bei anämischen gambischen Kleinkindern erhöhte sich die Eisenabsorption wäh- rend der Verabreichung von Eisenpräparaten um das 3.8-fache. Dies führte wäh- rend der Eisensupplementierung zu einer Eisenabsorption, die den herkömmlichen Empfehlungen zur Eisenabsorption während des Wachstums entspricht. Ohne Ei-
sensupplementierung wurden die Empfehlungen allerdings nicht erreicht. Interes- santerweise erhöhten sich auch die Eisenverluste während der Eisensupplementie- rung um das 3.4-fache (Manuskript 2).
Bei jungen Frauen in Benin erhöhte eine viermonatige Eisensupplementierung die Eisenabsorption im Vergleich zur Kontrollperiode vor und nach der Intervention um das 3.4-fache, während die Eisenverluste nahezu konstant blieben. Bei jungen Frauen in der Schweiz erhöhte eine dreimonatige Eisensupplementierung die Ei- senabsorption im Vergleich zur Kontrollperiode vor der Intervention um das 2.7- fache und im Vergleich zur Kontrollperiode nach der Intervention, als der Eisen- status verbessert war, um das 4.2-fache. Ähnlich wie bei gambischen Kleinkindern stiegen die Eisenverluste bei Frauen in der Schweiz im Vergleich zur Kontrollperi- ode vor der Intervention während der Eisensupplementierung um das 3.3-fache und blieben während der Kontrollperiode nach der Intervention erhöht (Manu- skript 3).
In Manuskript 4 heben wir die Angemessenheit der WHO/FAO Referenzwerte zur Eisenzufuhr in afrikanischen Schulkindern hervor. Dies, obwohl die für die faktori- elle Modellierung dieser Schätzung verwendeten Werte von westlichen Bevölke- rungsgruppen stammen. Bei Absorbierung ähnlicher Eisenmengen ist der Anstieg des Körpereisens in unseren malwischen Schulkindern vergleichbar mit dem An- stieg des Körpereisens eines WHO/FAO Referenz-Kindes. Dies obwohl unsere ma- lawischen Kinder mit klar weniger Körpereisen starteten. Ein Hochregulieren der Eisenabsorption als Antwort auf einen erhöhten erythropoethischen Eisenbedarf war in unseren malawischen Schulkindern wegen des Fehlens von zusätzlichem bioverfügbarem Eisen in der Ernährung allerdings nicht möglich.
Schlussfolgerungen
Die geschätzte Eisenbioverfügbarkeit von 6% in der beninischen Ernährung stimmt gut mit den Ergebnissen früherer multiple meal Eisenisotopenstudien mit densel- ben Probandinnen überein und passt auch gut zu einer von der WHO geschätzten Eisenbioverfügbarkeit von 5% bei monotoner, Getreide-basierter Ernährung, wie sie in afrikanischen Ländern typisch ist. Das kürzlich entwickelte Wahrscheinlich- keitsmodell für die Bestimmung der Eisenbioverfügbarkeit in der britischen (west- lichen) Ernährung kann somit auch zur Abschätzung der Eisenbioverfügbarkeit in
Ernährungen verwendet werden, die sich von einer westlichen Ernährung unter- scheiden. Bei niedrigen SF-Konzentrationen wirkte sich die Verwendung unter- schiedlicher Verteilungen des Bedarfs an absorbiertem Eisen auf die Abschätzung der Bioverfügbarkeit von Eisen aus und verlangt nach mehr Daten zum Bedarf an absorbiertem Eisen in Bevölkerungsgruppen mit niedrigen SF-Konzentrationen (Manuskript 1).
Die für die Manuskripte 2–4 bestimmten Daten zur Eisenabsorption und zu den Eisenverlusten in verschiedenen Bevölkerungsgruppen sind ein erster Schritt, den kontextspezifischen Bedarf an absorbiertem Eisen besser zu verstehen und quan- tifizieren zu können. Die Zuverlässigkeit der Eisenisotopen-Verdünnungs-Methode wird durch externe und interne Konsistenz unserer Ergebnisse gestützt: Extern sind unsere gemessenen Eisenabsorptionen, Eisenverluste und Netto-Eisenbilan- zen im Allgemeinen gut mit Werten vergleichbar, welche die WHO, FAO, IOM und EFSA durch faktorielles Modellieren aus Daten von westlichen Populationen erar- beitet haben. Bezüglich interner Konsistenz, sind sich die konventionell berechne- ten Netto-Eisenbilanzen (Gesamteisen am Ende der Beobachtung minus Gesamt- eisen zu Studienbeginn) und die isotopisch ermittelten Eisenbilanzen (Eisenab- sorption minus Eisenverluste) in allen Studien ziemlich ähnlich.
Wir empfehlen die Eisenisotopen-Verdünnungs-Methode als zuverlässige, akkurate und hochpräzise Referenzmethode für die Evaluierung von Programmen zur Eisen- anreicherung und –ergänzung, zur Bewertung der Eisenbioverfügbarkeit in ver- schiedenen Ernährungen und zur Bestimmung des Eisenbedarfs von verschiedenen Bevölkerungsgruppen. Die Eisenisotopen-Verdünnungs-Methode kann unabhängig von herkömmlichen, teils unspezifischen und/oder wenig selektiven, Eisenindizes zu neuen Erkenntnissen über die Eisenabsorption und den Eisenumsatz bei gesun- den Menschen als auch während (chronischer) Krankheiten beitragen.
Die gefundenen erhöhten Eisenverluste während der Eisensupplementierung von anämischen gambischen Kleinkindern und jungen Frauen in der Schweiz, jedoch nicht von jungen Frauen in Benin, erfordern weiterführende Untersuchungen der verantwortlichen pathophysiologischen Mechanismen, bevor möglicherweise neue Eisenformulierungen entwickelt werden müssen.
INTRODUCTION
Iron deficiency (ID) is the most common and widespread nutritional disorder worldwide, not only affecting a large number of children and women in developing countries, but also being the only nutrient deficiency significantly prevalent in in- dustrialized countries (WHO, 2020). Having extraordinary catalytic properties and being a reliable oxygen and electron transporter, iron has an important role in various biochemical reactions and is needed by every human cell and almost all living organisms (Brittenham, 2000). Weaknesses, fatigue, difficulty in concentrat- ing and poor work productivity are symptoms correlating with low oxygen delivery to body tissues and are often listed as the most important and common symptoms of ID (Camaschella, 2015).
Unfortunately, policies to improve iron nutrition have not always been successful;
ID still accounts for an estimated 30 million disability-adjusted life years (DALYs;
Fitzmaurice, 2018). The inability to accurately and reliably assess the outcomes of iron intervention programs and the lack of direct measurements to quantify long- term iron absorption or iron gains as well as provoked iron losses further compli- cates interpretation of iron intervention programs designed and implemented to improve iron nutrition.
Conventional iron indices such as hemoglobin (Hb), serum ferritin (SF), soluble transferrin receptor (sTfR), zinc protoporphyrin (ZPP), or combinations thereof only indirectly reflect changes in total body iron and often have low specificity and/or sensitivity as they may be affected by infection, inflammation, and a variety of chronic disorders (Lynch et al., 2018). Iron balance studies are logistically and practically very difficult (IAEA, 2012).
The abundance of the four existing stable isotopes of iron (54Fe, 56Fe, 57Fe and 58Fe) is narrowly fixed (Meija et al., 2016). If one of the seldom stable iron isotopes is purified and added to a certain investigation vector in known amounts, iron ab- sorption from this labelled investigation vector can be accurately determined by assessing the appearance of the tracer in erythrocytes approximately two weeks post-dosing, a technique that has been widely established in iron research (IAEA, 2012). Administration of a stable iron isotope permanently alters the isotopic sig- nature. Inversion of the short-term stable iron isotope erythrocyte incorporation
methodology and observing how iron of natural isotopic iron composition dilutes the altered isotopic signature, let to the discovery of the dilution of stable iron isotopes methodology for reliable and accurate quantification of iron transport into the body by Fomon and coworkers (Fomon et al., 2003, Fomon et al., 2005).
In this thesis the dilution of stable iron isotopes methodology is further evaluated and refined in order to assess different iron interventions and to define basal iron requirements in different populations. While chapter 1 of the literature review pro- vides further understanding of iron metabolism in general, the rationale for and the basic principles of the dilution of stable iron isotopes methodology are derived in chapter 2, before completing the literature review with a short discussion of the current prevalence of ID in chapter 3. The original research results of this thesis are introduced by an iron bioavailability estimation based on a probability model applied to a dataset of 30 women in Benin (manuscript 1). In manuscripts 2 and 3 we evaluated different iron interventions (daily supplementation of Gambian toddlers with 12 mg iron as ferrous fumarate in a MixMe WHO micronutrient pow- der for 12 weeks, manuscript 2; and daily oral iron supplementation of young women in Benin and Switzerland with 50 mg iron as ferrous sulfate for 120 and 90 days, respectively, manuscript 3) with the use of the dilution of stable iron isotopes methodology, before using the dilution of stable iron isotopes methodol- ogy to assess iron requirements of a Malawian population of 5–8 years old children (manuscript 4).
References
Brittenham GM. 2000. Disorders of Iron Metabolism: Iron Deficiency and Overload.
In: Hoffman R, Benz EJJ., Shattil SJ, Furie B, Cohen HJ, Silberstein LE. & Mcglave P. (eds.) Hematology: Basic Principles and Practice. 3rd ed. Philadelphia: Churchill Livingstone.
Camaschella C. 2015. Iron Deficiency Anemia. N Engl J Med, 372, 1832–1843.
Fitzmaurice C, Akinyemiju TF, Al Lami FH, Alam T, Alizadeh-Navaei R, Allen C, Alsharif U, Alvis-Guzman N, Amini E, Anderson BO. et al. 2018. Global, regional, and national cancer incidence, mortality, years of life lost, years lived with disability, and disability-adjusted life-years for 29 cancer groups, 2006 to 2016: A systematic analysis for the Global Burden of Disease study. JAMA Oncol, 4, 1553- 1568.
Fomon SJ, Drulis JM, Nelson SE, Serfass RE, Woodhead JC. & Ziegler EE. 2003.
Inevitable iron loss by human adolescents, with calculations of the requirement for absorbed iron. J Nutr, 133, 167–172.
Fomon SJ, Nelson SE, Serfass RE. & Ziegler EE. 2005. Absorption and loss of iron in toddlers are highly correlated. J Nutr, 135, 771–777.
IAEA. 2012. Assessment of iron bioavailability in humans using stable iron isotope techniques, Vienna, IAEA human health series.
Lynch S, Pfeiffer CM, Georgieff MK, Brittenham G, Fairweather-Tait SJ, Hurrell RF, Mcardle HJ. & Raiten DJ. 2018. Biomarkers of Nutrition for Development (BOND)- Iron Review. J Nutr, 148, 1001S–1067S.
Meija J, Coplen TB, Berglund M, Brand WA, De Bievre P, Groning M, Holden NE, Irrgeher J, Loss RD, Walczyk T. & Prohaska T. 2016. Isotopic compositions of the elements 2013 (IUPAC Technical Report). Pure and Appl Chem, 88, 293–306.
WHO. 2020. WHO Micronutrient deficiencies: Iron deficiency anemia [online].
World Health Organization. Available: http://www.who.int/nutrition/topics/ida/en [accessed 25.02.2020].
LITERATURE REVIEW
1 Iron in human nutrition
1.1 Physicochemical properties of iron
Iron (Fe), a lustrous and metallic transition metal with a silver-grey tinge is found on position 26 of the periodic table and has a molar weight of 55.85 g/mol (Bolm, 2009). Iron is the second most common metal on Earth (Bolm, 2009). According to the Wächtershäuser theory, iron was the catalytic element that allowed the formation of macromolecules from CO2 and H2 during evolution (Huber and Wachtershauser, 1997).
Having extraordinary catalytic properties and being a reliable oxygen and electron transporter, iron has an important role in various biochemical reactions and is needed by almost all living organisms and every human cell (Brittenham, 2000).
As during evolution photosynthesis led to a dramatic increase in ambient oxygen concentrations, most iron became oxidized and precipitated in its insoluble ferric (Fe3+) form (Ilbert and Bonnefoy, 2013). Thus, iron availability for biological or- ganisms is highly limited nowadays and iron deficiency (ID) is taxed as the most common and widespread nutritional deficiency worldwide (WHO, 2020a).
In nature, iron exists in the form of four stable isotopes (54Fe, 56Fe, 57Fe and 58Fe;
Table 1) and three radioactive isotopes (52Fe, 55Fe, 59Fe). The abundance of the different isotopes is highly conserved (IAEA, 2012).
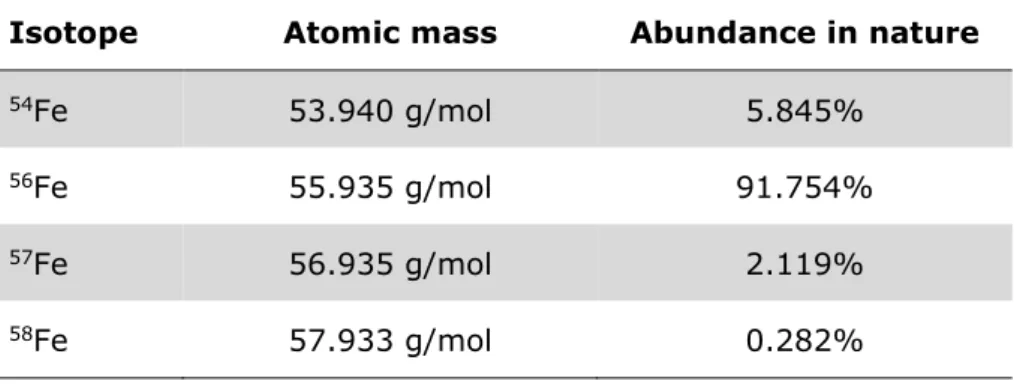
Table 1: Natural isotopic composition of iron and isotope abun- dances as given by Meija et al., 2016
Isotope Atomic mass Abundance in nature
54Fe 53.940 g/mol 5.845%
56Fe 55.935 g/mol 91.754%
57Fe 56.935 g/mol 2.119%
58Fe 57.933 g/mol 0.282%
1.2 Iron in the human body
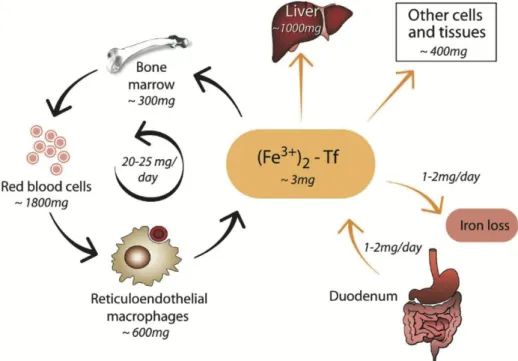
Within human body, iron is present in amounts of normally 3–4 g in adults [40–
50 mg/kg body weight (bw)], with lower concentrations in women than in men (Brittenham, 2000). Around ⅔ of body iron are present as heme iron (see chapter 1.2.1) within circulating red blood cells (iron concentration of red blood cells: 1 mg Fe / mL (~10-2 M) packed erythrocytes). Most of the remaining ⅓ of iron is stored within hepatocytes and macrophages or as iron in myoglobin, the oxygen carrier in muscles with a similar structure to hemoglobin (Hb), or iron- containing enzymes (cytochromes and sulfur proteins detoxifying foreign sub- stances in the liver or cofactors within dopamine and serotonin synthesis in the brain). Only a tiny, negligible amount of nonheme iron can be found in circulation, bound to transferrin (Tf; Figure 1; Biesalski and Grimm, 2011). In health and steady state, only 1–2 mg iron are absorbed and lost every day (Hentze et al., 2004).
Quantification of total body iron is generally critical, but can be calculated as the sum of circulating heme iron, tissue iron, and storage iron according to the follow- ing equation:
Fetotal = Fecirc + Fetissue + Festore. (1)
Figure 1: Estimated size of the main iron compartments in healthy adults. Values are approximate and subject to significant person-to-person variation. For being bound to transferrin (Tf), iron needs to be present in its ferric (Fe3+) state. Figure taken from Hentze et al., 2004.
Fecirc reflects the circulating heme iron, and can be calculated as blood volume x Hb concentration in the blood x iron concentration in Hb, with blood volume often de- rived from age-specific equations such as the Brown equation for adult women (Brown et al., 1962) or the Linderkamp equations for children (Linderkamp et al., 1977), or simply assumed as 65–85 mL/kg bw as proposed by many pedi- atricians (see also chapter 2.3.1). Fetissue represents the iron in myoglobin and iron- containing enzymes and is generally accepted to be 5–7 mg/kg bw (Finch and Huebers, 1982; FAO & WHO, 1988). Festore reflects the storage iron, consisting of iron in ferritin and hemosiderin. There are several approaches estimating iron stores on the basis of conventional iron status parameters (see chapter 2). Simple approaches estimate storage iron on the basis of 1 µg/L serum ferritin (SF) corre- sponding to 8–10 mg body iron stores or more elaborated 1 µg/L SF corresponding to 120 µg Fe / kg bw (Finch et al., 1986). More precise attempts to estimate body iron stores involve sophisticated equations for estimating iron stores. Based on results of one of the last ethically approved phlebotomy study by Skikne et al. in 14 subjects in the late 1980s (Skikne et al., 1990), Hallberg et al. (1998) derived the following equation:
iron stores [µg/kg] = 9380 x log(SF [µg/L]) – 11’260 (2) and Cook et al. (2003) derived
body iron [mg/kg] = -[log(sTfR [µg/L]/SF [µg/L] ratio) – 2.8229]/0.1207 (3) with sTfR soluble transferrin receptor concentration.
While Hallberg et al. determined SF concentrations <15.9 µg/L to correspond to negative iron stores only indicating absent iron stores but without further inter- pretation or quantification, Cook et al. taxed negative body iron as iron deficits. It remains unclear whether functional iron deficits can only be attributed to circulat- ing heme iron or whether and to what extent they also occur in tissue iron.
Erythropoiesis and heme synthesis
Mature human erythrocytes make up around one quarter of all cells in the human body (Ganz, 2018a). About 20 mL packed erythrocytes or 200 billion erythrocytes are produced each day by average human man (Ganz, 2018b, Hentze et al., 2004).
Approximately 250’000 Hb molecules constitute one erythrocyte and each of these
Hb molecules binds four iron atoms (IAEA, 2012). Thus, approximately 20 mg iron are required for Hb synthesis every day, equal to about 80% of all iron moving through the circulating plasma Tf compartment each day (Hentze et al., 2004).
During their average lifespan of 120 days, erythrocytes subject their iron-rich Hb to almost 200’000 redox cycles (Ganz, 2018a).
As all body cells require iron, erythrocyte production is closely regulated by the concentration of Tf-bound plasma iron and by the concentration of iron in erythro- blasts, causing erythropoiesis to slow down during periods of ID to leave more iron for other tissues (Ganz, 2018a). Self-renewing hematopoietic stem cells residing in the bone marrow are at the origin of erythropoiesis building new erythrocytes in about 9–12 days (Hattangadi et al., 2011). To initiate erythropoiesis, the hem- atopoietic stem cells give rise to burst-forming unit erythroid progenitors that then progress into colony-forming unit erythroid cells, generating proerythroblasts. Pro- erythroblasts further ripen into erythroblasts and finally normoblasts surrounding a central “nurse-macrophage” in the extravascular bone marrow (Muckenthaler et al., 2017). Together with its surrounding, the “nurse-macrophage” constitutes the erythroblastic island (Muckenthaler et al., 2017). After enucleation, normoblasts mature into reticulocytes moving out of the erythroblastic island and entering the bloodstream where they ripen into mature erythrocytes circulating in the blood Figure 2: Visualization of erythropoiesis. Figure adapted from Muckenthaler et al., 2017.
until reaching senescence after approximately 120 d (Figure 2; Muckenthaler et al., 2017).
Hb synthesis starts in the proerythroblast. In the proerythroblastic mitochondria glycine and succinyl-coenzyme A condensate, forming δ-aminolevulinate what is then transported out of the mitochondria for conversion into prophobilinogen (Fig- ure 3). Prophobilinogen synthase having one divalent metal per subunit, normally zinc, is needed for prophobilinogen synthesis. In case lead is included in propho- bilinogen synthase instead of zinc, the reaction comes to a halt, and erythropoiesis is impaired, leading to anemia (Hamza and Dailey, 2012). Prophobilinogen mole- cules react into hydroxymethylbilane and uroporphyrinogen III (Figure 3). Decar- boxylation of uroporphyrinogen III transforms the molecule into coproporphyrino- gen III, containing 4 methyl groups (Figure 3). Back in the mitochondrial inter- membrane space, oxidative decarboxylation leads to the formation of protopor- Figure 3: The mammalian heme biosynthetic pathway presented by Hamza and Dailey, 2012. The diagram presents the enzymatic steps and structures of all intermediates in the pathway from δ-aminolevulinate to heme. Steps that occur in the mitochondrion are en- closed in the dashed box. Regions highlighted in red show the site of chemical change catalyzed by the enzyme listed. Synthesis of δ-aminolevulinate from glycine and succinyl coenzyme A, which is the first committed step and occurs in the mitochondrion, is not shown.
phyrinogen IX containing vinyl groups (Figure 3). After a last oxidation step form- ing protoporphyrin IX, iron can be inserted into the protoporphyrin macrocycle through ferrochelatase, forming protoheme (Figure 3). Back in the cytosol, proto- heme binds to distinct globins through its vinyl groups resulting in the formation of Hb. The heme groups of protoheme act as the prosthetic group binding oxygen.
1.3 Iron absorption
Iron is absorbed in the proximal duodenum, where enterocytes are arranged in villi protruding into the intestinal lumen maximizing the absorptive surface area (Andrews, 2008). Soluble, low molecular weight iron complexes and ferrous iron (Fe2+) ions are well absorbed, while high molecular weight and hardly soluble complexes are absorbed only poorly (Miret et al., 2003). Nonheme iron must be present in its Fe2+ form for absorption (Muckenthaler et al., 2017), but unfortu- nately, food iron is normally present in high molecular weight species and as Fe3+ (Miret et al., 2003). Fe3+ even precipitates as hydroxide at pH values above 4 (Salovaara et al., 2002) and compounds able to form soluble complexes with iron ions are needed to improve iron bioavailability. The low pH of the stomach together with ascorbic acid and duodenal cytochrome b (Dcytb), a ferric reductase located at the apical membrane of enterocytes, reduces Fe3+ into Fe2+. Driven by a proton gradient between gut lumen and enterocyte cytoplasm, transmembrane protein divalent metal transporter 1 (DMT1; formerly called natural resistance as- sociated macrophage protein Nramp2) then accomplishes the import of Fe2+ and other divalent minerals such as zinc or cadmium from the gut lumen into entero- cyte cytosol (Sharp, 2010, Silva and Faustino, 2015). There is rising evidence that besides this DMT1 pathway also other iron absorption pathways may exist: e.g.
calcium channels (Oudit et al., 2003; Gaasch et al., 2007). Similarly, the mecha- nisms of heme iron absorption are not yet fully understood (Silva and Faustino, 2015).
Within the labile iron pool (LIP) in the enterocyte, iron is either stored in ferritin (and “excreted” through sloughing of enterocytes after a lifespan of 2–
3 days (Powell and Halliday, 1981)) or transported to the basolateral membrane where it is exported into the circulation through ferroportin (Fpn; Silva and Faustino, 2015). After export at the basolateral membrane, ferrous Fe2+ iron is
immediately re-oxidized to Fe3+ by ferroxidase, hephaestin or ceruloplasmin for further distribution in the body via circulatory Tf (Silva and Faustino, 2015).
Tf exists in three states: I) apo-Tf with no iron bound, II) mono-ferric Tf with a single iron atom bound, and III) diferric Tf also known as holo-Tf, with two iron atoms bound (Silva and Faustino, 2015). Monoferric and diferric Tf bind to trans- ferrin receptor 1 (TfR1) located at the cell membrane of target cells and the Tf- bound iron-TfR1 complex gets endocytosed (Silva and Faustino, 2015). Through the entry of H+-ions into the endosome, facilitated by an ATP-dependent proton pump, the pH in the endosome decreases and Fe3+ is released from the com- plex (Silva and Faustino, 2015). The Steap 3 enzyme present in the endosome then reduces Fe3+ into Fe2+ and DMT1 transporters at the endosome surface export the iron into the cytosol of the target cell (Silva and Faustino, 2015). Meanwhile, endosomes without iron are driven back to the cell surface where apo-Tf is released to the plasma and the TfR is ready for another iron transport cycle (Silva and Faustino, 2015).
1.4 Iron losses
The first meaningful information on iron excretion was obtained by Widdowson and McCance in their painstaking chemical balance studies in the 1930s (Widdowson and McCance, 1937, McCance and Widdowson, 1938). In 14 days following a 36–
46-days period of oral iron consumption of more than 1000 mg iron daily, iron content of urine and feces was not higher than it was before this iron supplemen- tation period, indicating iron excretion does not correct for elevated body iron con- tent (Widdowson and McCance, 1937). Later on, the same authors confirmed their findings by demonstrating urinary and fecal iron losses not to be increased during the 14 days following seven days with daily intravenous (iv) iron administration of 7 mg Fe (McCance and Widdowson, 1938). In the 1950s, Clement A. Finch finally overcame the persistent problem of large quantities of unabsorbed iron in feces highly complicating and impairing chemical balance studies (Finch, 1959).
Finch studied long-term iron losses by expressing erythrocyte radioactivity as a percentage of the erythrocyte ra- dioactivity after 55Fe injection (Finch, 1959). An exponential decay (defined by a linear decay in a semi-logarith- mical graph) resulted from plotting measurements taken over 54 months versus time (Figure 4). Finch quanti- fied daily iron excretion as approxi- mately 0.6 mg/d in men, 0.64 mg/d in non-menstruating women and 1.2 mg/d in menstruating women (Finch, 1959). Before the steady, exponential decay in radioac- tivity in blood, a rapid drop in circulat- ing radio-isotope concentration hap- pened due to mixing of the radio-iso- topes with other bodily compartments after release from the first few gener- ations of labelled erythrocytes.
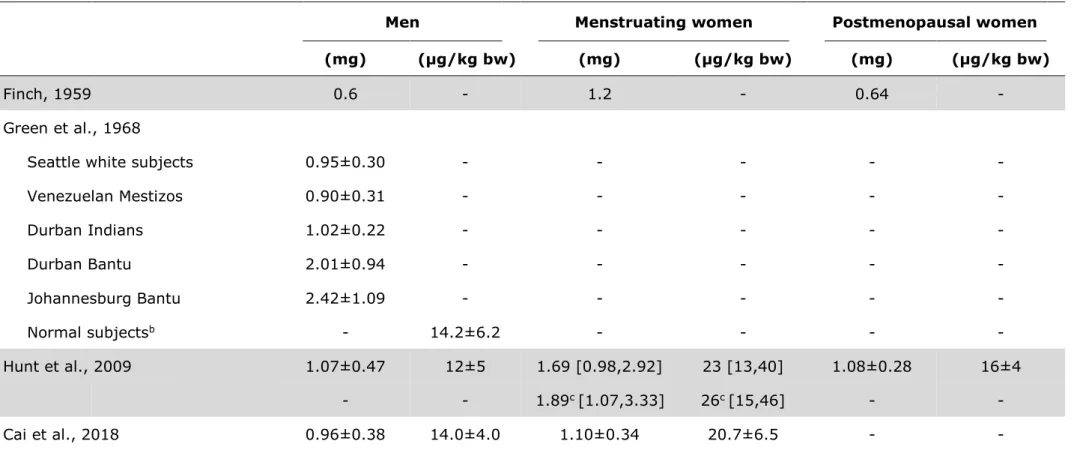
Later on, in the 1960s, Green et al.
used Finch’s approach to quantify iron excretion in different male popula- tions and measured daily basal iron losses of 14 µg/kg bw (resulting in daily iron losses of 0.98 mg for a 70- kg man; Table 2; Green et al., 1968).
These 14 µg/kg bw still constitute the reference for extrapolation for all fur- ther iron losses estimates based on factorial modeling to define dietary reference values (DRV; dietary refer- ence intakes (DRI) in Canada and the Figure 4: Decay of radioactivity in
circulating erythrocytes of normal man (A, six subjects), non-menstru- ating women (B, 12 subjects), and menstruating women (C, six sub- jects) determined and plotted by Finch, 1959.
United States (US)) for iron (IOM, 2001, WHO & FAO, 2004). Through separately quantifying gastrointestinal iron losses, biliary iron losses, urinary iron losses, and dermal iron losses, Green et al. also undertook attempts to measure iron excretion from different body compartments (Green et al., 1968): Adding these measure- ments resulted in total daily iron losses of 0.86 mg/d (compared to 0.98 mg/d achieved via the radio-isotopes approach).
Only 40 years later in 2009, Hunt et al. directly determined basal daily iron losses of 23 [13,40] µg/kg bw in menstruating women (Table 2) using the same radio- isotope approach, and also confirmed Green et al.’s results in men (Hunt et al., 2009). Daily basal iron losses in menstruating women even slightly increased to 26 [15,46] µg/kg bw if the four hormonal contraceptive users were excluded from analysis in the study by Hunt et al. Similar findings were reported in a recent study from China using the stable isotope dilution approach, where daily iron losses of 14 µg/kg bw were reported for male adults and 21 µg/kg bw for women of repro- ductive age, respectively (Cai et al., 2018). Data on basal iron losses in children still remain very scarce. Using the stable isotope dilution technique (see chap- ter 2.3.2), Fomon et al. recently reported basal iron losses of 0.25 ±0.12 mg/d for 13–26 months old US toddlers (Fomon et al., 2005), 0.70 mg/d for male US ado- lescents, and 0.84 mg/d for female US adolescents, respectively (Fomon et al., 2003).
Determined through observation of a 59Fe tracer in feces, Green et al. reported daily gastrointestinal blood losses of approximately 0.8 mL/d corresponding to around 0.38 mg/d iron. Furthermore, based on the early peak of radioactivity ap- pearing in feces 2–8 days after 59Fe injection, they suggested daily nonheme iron losses of approximately 0.14 ± 0.07 mg/d (Green et al., 1968). Together with shedding of mucosal cells, even though there was no correlation between the amount of gastrointestinal nonheme iron lost and the percentage saturation of Tf, bile highly contributes to nonheme iron losses (Dubach et al., 1955, Conrad et al., 1964, Green et al., 1968). Green et al. found a mean iron content of 0.24 ± 0.13 mg in bile (Green et al., 1968). Thus, there must by high iron resorp- tion from bile and not all bile iron was eventually excreted. Hawkins and Hahn could show increased iron excretion in bile after the induction of hemolysis in dogs (Hawkins and Hahn, 1944).
Table 2: Iron excretion of women and men in the most prominent and recent studies of iron lossesa
Men Menstruating women Postmenopausal women
(mg) (µg/kg bw) (mg) (µg/kg bw) (mg) (µg/kg bw)
Finch, 1959 0.6 - 1.2 - 0.64 -
Green et al., 1968
Seattle white subjects 0.95±0.30 - - - - -
Venezuelan Mestizos 0.90±0.31 - - - - -
Durban Indians 1.02±0.22 - - - - -
Durban Bantu 2.01±0.94 - - - - -
Johannesburg Bantu 2.42±1.09 - - - - -
Normal subjectsb - 14.2±6.2 - - - -
Hunt et al., 2009 1.07±0.47 12±5 1.69 [0.98,2.92] 23 [13,40] 1.08±0.28 16±4
- - 1.89c [1.07,3.33] 26c [15,46] - -
Cai et al., 2018 0.96±0.38 14.0±4.0 1.10±0.34 20.7±6.5 - -
a All values are arithmetic mean±SD or geometric mean [–SD, +SD] for skewed data. bw, body weight.
b Mean of all calculated iron losses for non iron deficient Seattle white subjects, Venezuelan Mestizos, and Durban Indians as the two Bantu groups were classified as iron overloaded and thus excluded from further analysis.
c after exclusion of hormonal contraceptive users (n=4 out of 19 analyzed women of reproductive age).
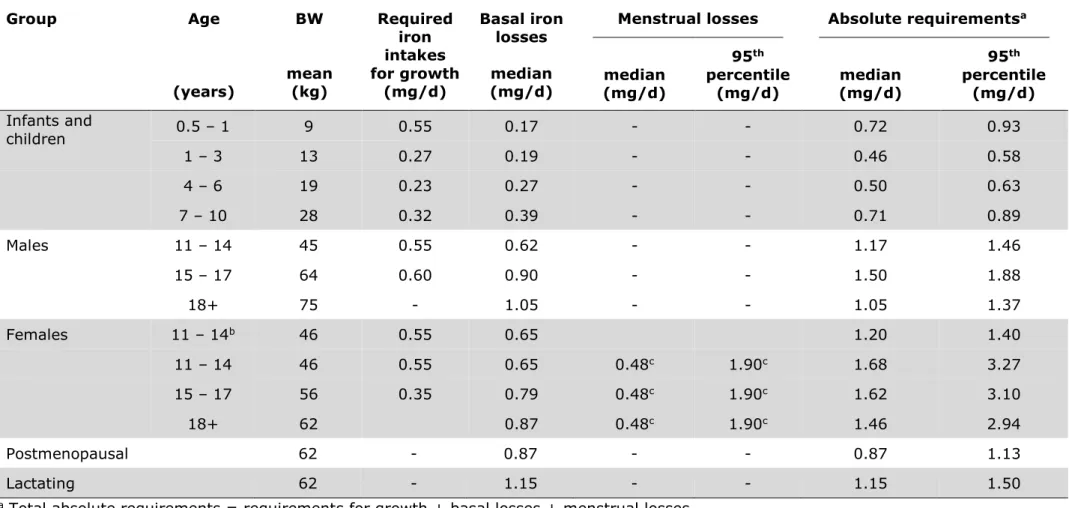
Table 3: Iron required for growth under the age of 18 years, to cover median basal iron losses, and to cover menstrual iron losses in women, as well as total absolute iron requirements estimated by WHO and FAO. Taken from WHO & FAO, 2004.
Group Age
(years)
BW
mean (kg)
Required iron intakes for growth
(mg/d)
Basal iron losses median (mg/d)
Menstrual losses Absolute requirementsa
median (mg/d)
95th percentile
(mg/d) median (mg/d)
95th percentile
(mg/d) Infants and
children 0.5 – 1 9 0.55 0.17 - - 0.72 0.93
1 – 3 13 0.27 0.19 - - 0.46 0.58
4 – 6 19 0.23 0.27 - - 0.50 0.63
7 – 10 28 0.32 0.39 - - 0.71 0.89
Males 11 – 14 45 0.55 0.62 - - 1.17 1.46
15 – 17 64 0.60 0.90 - - 1.50 1.88
18+ 75 - 1.05 - - 1.05 1.37
Females 11 – 14b 46 0.55 0.65 1.20 1.40
11 – 14 46 0.55 0.65 0.48c 1.90c 1.68 3.27
15 – 17 56 0.35 0.79 0.48c 1.90c 1.62 3.10
18+ 62 0.87 0.48c 1.90c 1.46 2.94
Postmenopausal 62 - 0.87 - - 0.87 1.13
Lactating 62 - 1.15 - - 1.15 1.50
a Total absolute requirements = requirements for growth + basal losses + menstrual losses.
b Pre-menarche.
c Effect of the normal variation in hemoglobin concentration not included in these data.