The impact of land-fast ice on the distribution of terrestrial dissolved organic matter in the Siberian Arctic shelf seas
Jens A. Hölemann
1, Bennet Juhls
2,3, Dorothea Bauch
4,5, Markus Janout
1, Boris P. Koch
1,6, Birgit Heim
35
1Alfred Wegener Institute, Helmholtz Centre for Polar and Marine Research, Bremerhaven, Germany
2Department of Earth Sciences, Institute for Space Sciences, Freie Universität Berlin, Berlin, Germany
3Alfred Wegener Institute, Helmholtz Centre for Polar and Marine Research, Potsdam, Germany
4Leibniz Laboratory for Radiometric Dating and Stable Isotope Research, University of Kiel CAU, Kiel, Germany
5GEOMAR, Helmholtz Centre for Ocean Research, Kiel, Germany 10
6University of Applied Sciences Bremerhaven, Germany Correspondence to: Jens Hölemann (jens.hoelemann@awi.de)
Abstract. Remobilization of soil carbon as a result of permafrost degradation in the drainage basin of the major Siberian rivers combined with higher precipitation in a warming climate potentially increase the flux of terrestrial derived dissolved organic matter (tDOM) into the Arctic Ocean. The Laptev (LS) and East Siberian Seas (ESS) receive enormous amounts of tDOM- 15
rich river water, which undergoes at least one freeze-melt cycle in the Siberian Arctic shelf seas. To better understand how freezing and melting affect the tDOM dynamics in the LS and ESS, we sampled sea ice, river and seawater for their dissolved organic carbon (DOC) concentration and the colored fraction of dissolved organic matter. The sampling took place in different seasons over a period of 9 years (2010-2019). Our results suggest that the main factor regulating the tDOM distribution in the LS and ESS is the mixing of marine waters with freshwater sources carrying different tDOM concentrations. Of particular 20
importance in this context are the 211 km³ of meltwater from land-fast ice from the LS, containing ~ 0.3 Tg DOC, which in spring mixes with 245 km³ of river water from the peak spring discharge of the Lena River, carrying ~ 2.4 Tg DOC into the LS. During the ice-free season, tDOM transport on the shelves takes place in the surface mixed layer, with the direction of transport depending on the prevailing wind direction. In winter, about 1.2 Tg of brine-related DOC, which was expelled from the growing land-fast ice in the LS, is transported in the near-surface water layer into the Transpolar Drift Stream that flows 25
from the Siberian Shelf toward Greenland. The actual water depth in which the tDOM-rich brines are transported, depends mainly on the density stratification of the LS and ESS in the preceding summer and the amount of ice produced in winter. We suspect that climate change in the Arctic will fundamentally alter the dynamics of tDOM transport in the Arctic marginal seas, which will also have consequences for the Arctic carbon cycle
1. Introduction 30
The mean annual air temperature in the Arctic continues to rise (Overland et al., 2019), resulting in a rapid decrease in summer sea ice extent and volume (Perovich et al., 2014) and, consequently, a longer ice-free season. Furthermore, the terrestrial permafrost temperature increases (Biskaborn et al., 2019) with major implications for the Arctic carbon cycle. Due to the accelerated degradation of terrestrial permafrost, an estimated 1035 ±150 Pg of organic carbon stored in the upper three meters of circumpolar permafrost soils (Hugelius et al., 2014) can be either mineralised and released as gaseous emissions into the 35
of soil carbon into the hydrosphere in combination with an increasing freshwater discharge from Arctic rivers (Rawlins et al.
2010; Haine et al., 2015; McClelland et al., 2006) might thus increase the flux of tDOM into the ocean (Frey and Smith 2005;
Guo et al. 2007; Prokushkin et al., 2011; Tank et al., 2016). Changes in the land-ocean fluxes of tDOM in the Arctic are of particular importance for the global carbon cycle, since the rivers in the high northern latitudes export significant quantities of 40
tDOM to the Arctic Ocean (AO). DOM is typically quantified via its carbon content (dissolved organic carbon; DOC), which contributes roughly half to the total mass of DOM. Currently, the annual riverine input of DOC into the AO is about 25-36 Tg C yr-1 (Raymond et al., 2007; Anderson and Amon, 2015), with the six largest Arctic rivers discharging about 18-20 Tg C yr-
1 (Stedmon et al., 2011; Amon et al., 2012). The three major Siberian river systems (Ob, Yenisey and Lena) account for about 14 Tg C yr-1 (Holmes et al., 2012) with the Lena River alone discharging 6.8 Tg C yr-1 DOC into the Siberian Laptev Sea (LS) 45
(Juhls et al., 2020). The LS additionally receives freshwater from the outflow of the Kara Sea (KS), which transports river water from Ob and Yenisey through the Vilkitzky Strait into the northwestern LS (Janout et al., 2015).
If the input of tDOM into the AO increases as a consequence of climate change, it is crucial to achieve a better understanding of tDOM transport dynamics and biogeochemical cycles. Previous studies in the Arctic marginal seas have reported a strong negative linear relationship between salinity and DOC, which implies that tDOM-rich river water mixes with DOM-poor 50
marine waters from the AO without significant losses and gains along the salinity gradient (i.e. conservative mixing) (Kattner et al. 1999; Köhler et al., 2003; Amon, 2004; Amon and Meon, 2004; Shin and Tanaka, 2004; Gueguen et al 2005; Matsuoka et al., 2012; Pugach and Pipko, 2013; Pavlov et al., 2016; Tanaka et al. 2016, Pugach et al., 2018). In contrast, a number of studies indicate extensive degradation of tDOM in the AO (Alling et al., 2010; Stedmon et al., 2011; Letscher et al., 2011;
Kaiser et al., 2017a) and the Hudson Bay (Granskog, 2012). One reason for the partly contradictory observations could be the 55
extreme seasonality in the discharge of Arctic rivers and the associated high variability in the tDOM concentrations and composition. In the course of the peak spring discharge (spring freshet), which have the highest annual tDOM concentrations, about half of the annual tDOM is exported to the AO (Cauwet and Sidorov, 1996; Stedmon et al., 201; Holmes et al., 2012).
In summer, autumn and winter, tDOM concentrations in Arctic rivers are significantly lower (Stedmon et al., 2011; Juhls et al., 2020). Several studies have shown that tDOM, discharged during the spring freshet, displays a different chemical 60
composition and a higher biological and photochemical lability compared to the summer discharge (Osburn et al., 2009; Amon et al., 2012; Mann et al., 2012, Kaiser et al. 2017b). This could lead to a tDOM degradation of 20-40 % within less than one month during the spring freshet (Holmes et al., 2008).Therefore, seasonal changes in tDOM composition and lability are another possible explanation for the observed variability in degradation rates.
Similar to the studies on the degradation of tDOM on the shelves, the studies on the total residence time of tDOM in the AO 65
do not provide a consistent picture. Alling et al. (2010) reported a first-order removal rate of ~0.3 year-1 while Letscher et al.
(2011) calculated a first-order decay constant of 0.24 ± 0.07 year-1 in the Siberian Shelf Seas. Applying a residence time of 3.5
±2 years of river water on the Siberian shelf systems (Schlosser et al., 1994) would thus result in a loss of ~30-75% of the DOC in this region. A study from the western AO (Hansell et al., 2004) suggests that 30-70% of DOC is mineralized during a
10 year residence time in the Beaufort Gyre while a study by Mann et al. (2016) calculated DOC turnover rates for the AO 70
that range from 7 to 30 months.
Considering the high seasonal variability in input and chemical composition of tDOM and a predicted strong degradation of tDOM that is controlled by multiple processes, it appears puzzling that most studies in the LS have observed a pronounced and relatively invariant linear decrease of tDOM along the salinity gradient. This is even more so as the formation and freeze- melt cycle of sea ice in the Siberian shelf seas, which has a significant influence on the salinity-tDOM relationship (Anderson 75
and Amon, 2015), should lead to a much greater variability of tDOM concentrations along the salinity gradient. Melting of sea ice is important because the meltwater may dilute tDOM concentrations in the underlying water column (Amon, 2004; Mathis et al., 2005; Granskog et al., 2015; Logvinova et al., 2016). At the end of winter, the central and northern part of the LS shelf is covered by thin sea ice, which melts almost completely from May to June (Itkin and Krumpen, 2017). In contrast, the inner shelf of the eastern LS and East Siberian Sea (ESS) is covered by landfast-ice that lasts until mid-July (Selyushenok et al., 80
2015). During sea ice formation, tDOM is expelled from the ice crystals and concentrates in salt brines, which accumulate in the underlying water column (Amon, 2004; Anderson and Macdonald, 2015). This also explains the observed low tDOM concentrations in the LS landfast-ice that forms from the tDOM-rich surface water sourced by the Lena river (Wegner et al., 2017). The presence of tDOM-poor meltwater and tDOM-rich river water in the Arctic shelf seas together with the extreme seasonality of tDOM input make it difficult to study tDOM removal processes based on the interpretation of the relationship 85
between tDOM concentration and salinity (Anderson and Amon, 2015). Although sea ice formation and melt are obviously important processes for AO tDOM dynamics it is not adequately studied.
Here, we investigate the physical drivers that control the distribution and fate of tDOM, based on one of the most comprehensive bio-optical, DOC and hydrographic data sets from the Siberian Arctic. In particular, we aim to understand if sea ice formation and melt have a discernible impact on the distribution and fate of tDOM in the Siberian Shelf Seas. We report 90
on the first multi-year study of the colored fraction of dissolved organic matter (CDOM), which includes observations in (1) river runoff during spring freshet, (2) marine waters from the coastal area to the shelf edge of the LS and ESS, and (3) ice and water samples from the landfast-ice region covering the southeastern LS during winter and spring. Sampling was carried out in different seasons of the year over a period of 9 years (2010-2019).
2. Materials and methods 95
2.1 Field Sampling
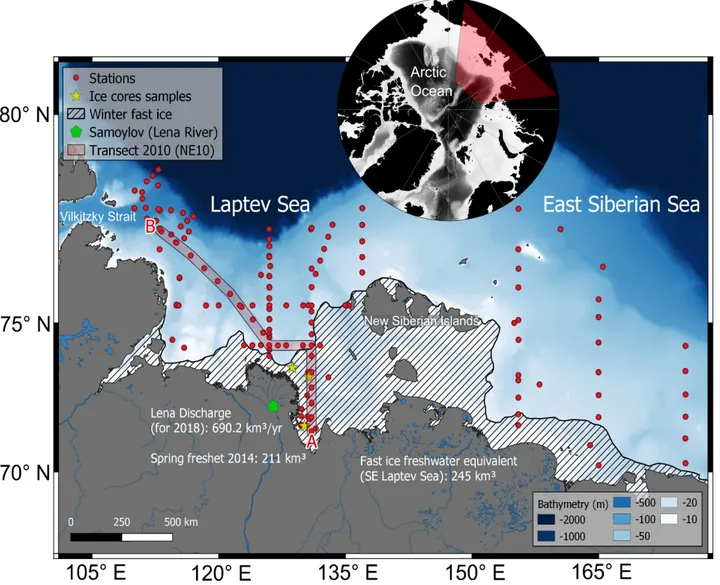
Seven summer ship expeditions between 2010 and 2019 and one sea ice-based winter expedition in 2012 were carried out to perform oceanographic and biogeochemical measurements in the Laptev Sea (Table 1 and Fig. 1). During the ship-based expeditions, we operated a CTD profiler (conductivity temperature-depth; Seabird 19+) to sample the basic hydrographic parameters. The CTD is operated on a carousel water sampler (SBE 32SC) allowing automated water sampling at pre-selected 100
Nansen water samplers. Ice cores (9 cm diameter) were collected in 2012 at stations on the land-fast ice (Fig. 1) between March 19 and April 24 (Ti12). We analysed six ice cores from, which were taken at three different sampling sites (Fig. 1).
Samples were taken at 10 cm intervals to represent the different periods in which the ice formed, with the youngest ice occurring in the lower section and the oldest ice from the first phases of ice formation during early winter in the uppermost 105
sections of the ice core.
Figure 1. Map of the Laptev and East Siberian Seas and station distribution during the ship-based expeditions in summers 2010, 2011, 2013, 2014, 2018, and 2019. In addition, samples of land-fast ice (fast ice) and the water column were taken from March to April 2012. The grey line between A and B represents the oceanographic transect shown in Figure 7.
110
Lena River data presented here were collected as part of the Lena 2014 expedition. Samples were taken close to the Samoylov Station (N 72°22’, E 126°29’, Fig. 1) in the central part of the Lena Delta from 21 May – 16 June 2014. Sample treatment and applied methods were similar to those described above.
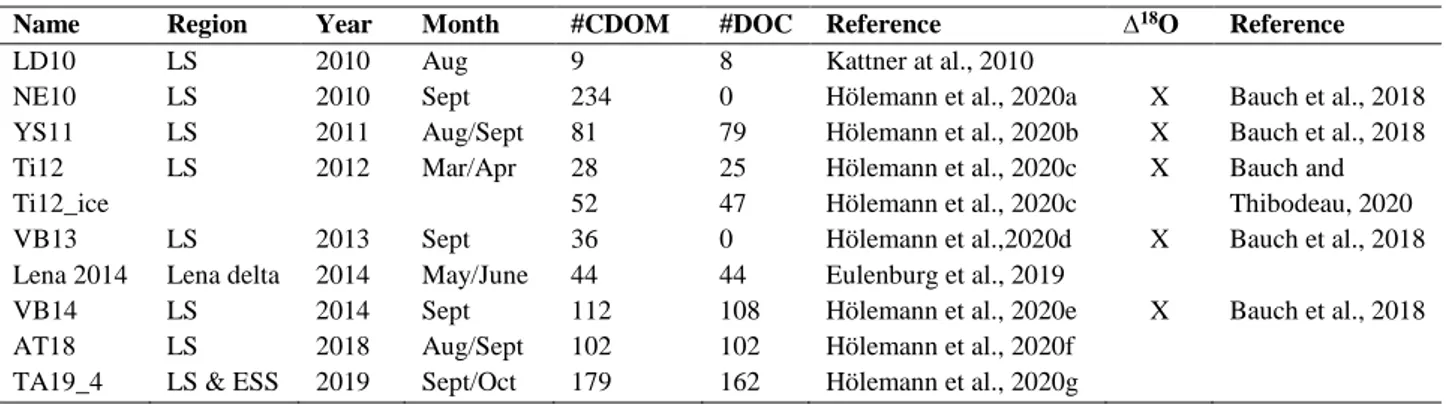
Table 1. Expedition data and the number of samples (#) used in this study. The data are accessible on PANGAEA.
115
Name Region Year Month #CDOM #DOC Reference ∆18O Reference
LD10 LS 2010 Aug 9 8 Kattner at al., 2010
NE10 LS 2010 Sept 234 0 Hölemann et al., 2020a X Bauch et al., 2018
YS11 LS 2011 Aug/Sept 81 79 Hölemann et al., 2020b X Bauch et al., 2018 Ti12
Ti12_ice
LS 2012 Mar/Apr 28
52
25 47
Hölemann et al., 2020c Hölemann et al., 2020c
X Bauch and Thibodeau, 2020
VB13 LS 2013 Sept 36 0 Hölemann et al.,2020d X Bauch et al., 2018
Lena 2014 Lena delta 2014 May/June 44 44 Eulenburg et al., 2019
VB14 LS 2014 Sept 112 108 Hölemann et al., 2020e X Bauch et al., 2018
AT18 LS 2018 Aug/Sept 102 102 Hölemann et al., 2020f
TA19_4 LS & ESS 2019 Sept/Oct 179 162 Hölemann et al., 2020g
2.2 Sample Analysis
Water samples were immediately filtered through pre-combusted Whatman GF/F glass microfiber filters (4.7 cm diameter) with a nominal pore size of approx. 0.7 µm. The filtrate was filled into acid cleaned and pre-rinsed high-density polyethylene bottles and stored dark and cold for CDOM analysis and frozen at -20 °C for DOC analysis. Filtered DOC samples from the 120
LENA 2014 expedition were filled into a pre-combusted 20 mL glass vial and acidified with 25 μL HCl (Merck, suprapur grade, 10 M) and stored in the dark at 4 °C. The ice cores were drilled using an electromechanical ice corer (Kovacs Enterprise, USA) and subsequently placed in polyethylene bags and transported frozen to the land-based laboratory. Within a few hours after coring, the core was placed in polyethylene boxes in the dark at room temperature until they were completely melted.
Immediately after melting, the salinity of the meltwater was determined with a conductivity meter (WTW 197i) with a standard 125
conductivity cell (WTW TetraCon 325) and samples were subjected to vacuum filtration. In addition, under-ice water samples were collected. Sample storage and analytical procedures were identical to those described for water samples.
DOC was determined by high temperature catalytic oxidation (HTCO) with a Shimadzu TOC-VCPN analyzer. In the autosampler, 6 mL of sample volume (pre-combusted or thoroughly rinsed vials) were acidified with 0.12 mL HCl (2 M) and sparged with oxygen (100 mL min-1) for 5 min to remove inorganic carbon. 50 µL sample volume was injected directly on the 130
catalyst (heated to 680°C). Detection of the generated CO2 was performed with an infrared detector. Final DOC concentrations were average values of triplicate measurements. If the standard variation or the coefficient of variation exceeded 0.1 µmol L-1 C or 1 %, respectively, up to 2 additional analyses were performed and outliers were eliminated. Detection limit was 7 µmol L-1 C with an accuracy of ± 2 µmol L-1 C determined with Low Carbon Water and Seawater Reference Material (DOC-CRM, Hansell Research Lab, University of Miami, US). Quality control was assured by measuring one Milli-Q blank and two 135
The optical properties of CDOM provide information on, both, the amount of DOM present and its chemical properties (Coble, 2007). In order to retrieve the absorption by CDOM, optical density (OD) spectra were analyzed on a dual beam spectrophotometer (Specord200, Jena Analytik) within 2 months after the expedition. Spectra were measured from 200 to 750 nm using quartz cuvettes with a path length of 5 cm or 10 cm, according to the expected absorption intensity of the sample.
140
OD of each sample was measured three times against ultra-pure water. Napierian absorption per meter was calculated based on the averaged OD value using 2.303 x OD/L, where L is the lengths of the cuvette. In this study, we present the absorption coefficient (m-1) at a wavelength of 350 nm (aCDOM(350)). The wavelength was selected to make the results comparable with previous studies in Arctic waters (Granskog et al., 2012; Gonçalves-Araújo et al., 2015; Pavlov et al., 2016). The spectral slope of the absorption spectra in the wavelength range between 275-295 nm (S275-295) was calculated by fitting with an exponential 145
function aCDOM (λ) = aCDOM(λ0)· e −S(λ−λ0) . The spectral region between 275 nm and 295 nm lies on the shortwave edge of the natural solar spectrum. Solar ultraviolet radiation exhibits a significant degradation for DOM in natural water ecosystems.
In contrast to 295 nm almost no photons are present at 275 nm in the lower atmosphere. It is therefore assumed that the solar radiation absorbed by the DOM would always lead to a greater change in aCDOM(295) than in aCDOM(275) and consequently to an increase in S275-295, making this spectral range a good indicator of photodegradation (Helms et al., 2008).
150
Stable oxygen isotopes were analysed at the Stable Isotope Laboratory of COAS at Oregon State University (Corvallis, USA) applying the CO2-water isotope equilibration technique and analysed by dual inlet mass spectrometry (Thermo, DeltaPlus XL).
The overall measurement precision for all δ18O analysis was ± 0.04 ‰. The 18O/16O ratios were calibrated with Vienna Standard Mean Ocean Water (VSMOW) and reported in the usual δ-notation (Craig, 1961). For a quantitative interpretation of the oxygen isotope data, an exact match of salinity and δ18O values is essential. Therefore, in addition to CTD measurements, 155
bottle salinity was determined directly within the water samples taken for δ18O analysis using an AutoSal 8400A salinometer (Fa. Guildline) with a precision of ± 0.003 and an accuracy greater than ± 0.005. The river water and sea-ice meltwater (sim) contributions can be quantified with a mass-balance calculation, which was previously applied in the Arctic Ocean basins (Bauch et al., 2011) and shelf regions (Bauch et al., 2005). The basis for the mass-balance calculation is the assumption that each sample is a mixture of marine water (fmar), river-runoff (fr) and sea-ice meltwater (fsim). Following equations determine 160
the balance:
fmar + fr + fsim = 1
fmar * Smar + fr * Sr + fsim * Ssim = Smeas
fmar * Omar + fr * Or + fsim * Osim = Omeas
where fmar, fr and fSIM are the fractions of marine water, river-runoff and sea-ice meltwater in a water parcel, and Smar, Sr, Ssim, 165
Omar, Or and Osim are the corresponding salinities and δ18O values. Smeas and Omeas are the measured salinity and δ18O of the water samples. For further details on the selection of end-members for the study area refer to Bauch et al. (2013).
3. Results
3.1 CDOM-DOC relationship in the Laptev Sea and East Siberian Sea
Samples collected in the Lena River, LS and ESS, and the adjacent Nansen and Amundsen Basins illustrate the range of 170
variability in DOC concentrations and aCDOM(350). Overall, highest DOC concentrations (> 1200 µmol L-1) were found in river water during the spring freshet of the Lena River in May. Lowest riverine DOC concentrations (384 µmol L-1) were recorded one week before the onset of the spring freshet. The coastal waters near the Lena Delta are characterised by DOC concentrations of 185 µmol L-1 to 853 µmol L-1 in the surface mixed layer (0-10 m depth), with the highest values (> 500 µmol L-1) occurring near the river mouth and in the mixed layer underneath the landfast-ice east of the delta (300-520 µmol L-1, 175
salinity 9-20). The marine water masses of the outer shelf and in the basins with salinity above 20 show lower DOC concentrations of 50-75 µmol L-1.
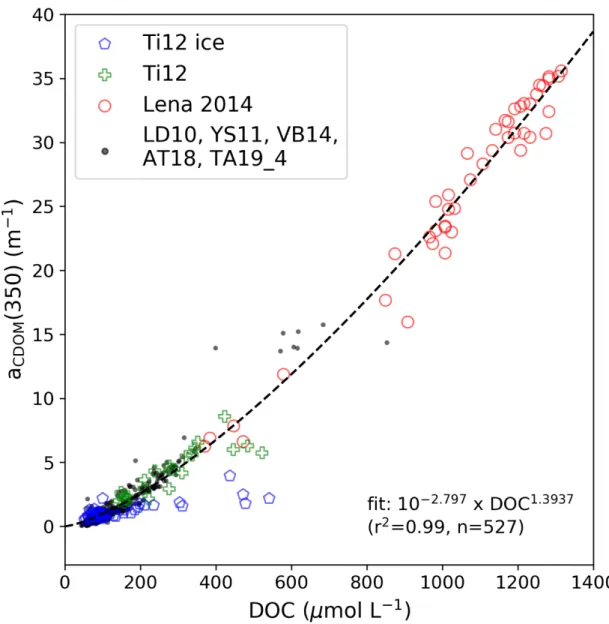
To characterize the relationship between the DOC concentration and the optical property (aCDOM(350)) of DOM in water and ice samples, we applied a nonlinear regression analysis according to the method described in Juhls et al. (2019) and Matsuoka et al. (2017). Statistical analysis of the water samples from the LS and ESS show a strong relationship between aCDOM(350) 180
and the DOC concentration (r² = 0.99; n = 527) (Fig. 2). In contrast, ice samples from the land-fast ice of the southeastern LS (Fig. 2, blue Diamonds), show a significantly different relationship. aCDOM(350) in the ice cores with DOC concentrations >
300 µmol L-1 is lower compared to water samples with comparable DOC concentrations. In particular, the DOC-rich (> 400 µmol L-1) ice samples show aCDOM(350) values that are up to five times lower than in seawater with the same DOC concentration. All ice samples with DOC concentrations > 200 µmol L-1 and aCDOM(350) < 2.5 were taken from the upper 70 185
cm of a 2 m long ice core from the coastal area near one of the mouths of the Lena River.
Figure 2. The relationship between DOC and aCDOM(350) for Lena River water, ice samples and seawater samples from the LS and ESS. The regression and r2 was calculated only on the basis of river and seawater samples.
190
3.2. tDOM characteristics in the Lena River during the spring freshet
The dominant feature of the hydrological cycle of the Lena is the spring freshet in May and June. We sampled this event in the central part of the Lena Delta during May and June 2014 (Lena 2014). The discharge data measured ~200 km upstream at Kyusyur were provided by ArcticGRO (Shiklomanov et al., 2020). We corrected the discharge data for the distance between Kyusur and Samoylov Island as described in Juhls et al. (2020) assuming a mean flow propagation speed of 88 km d-1. 195
Figure 3. (a) Corrected daily Lena River discharge data (10³ m³ sec-1), (b) aCDOM(350) and (c) DOC concentration, measured near Samoylov Island in the Lena Delta in May/June 2014.
During the observation period from May 21 to June 19, 2014, 211 km³ of freshwater with an average flow-weighted aCDOM(350) of 26.1 m-1 and a DOC discharge of 2.35 Tg entered the LS, which is one third of the annual DOC discharge of the Lena . 200
Continuously elevated aCDOM(350) values at the end of the observation period, which are still above average summer (post- freshet) values (aCDOM(350) ~14 m-1), indicate that the observation period did not cover the entire spring freshet. Taking into account the whole period of the spring freshet would lead to an even higher tDOM flux, as reported in Juhls et al. (2020).
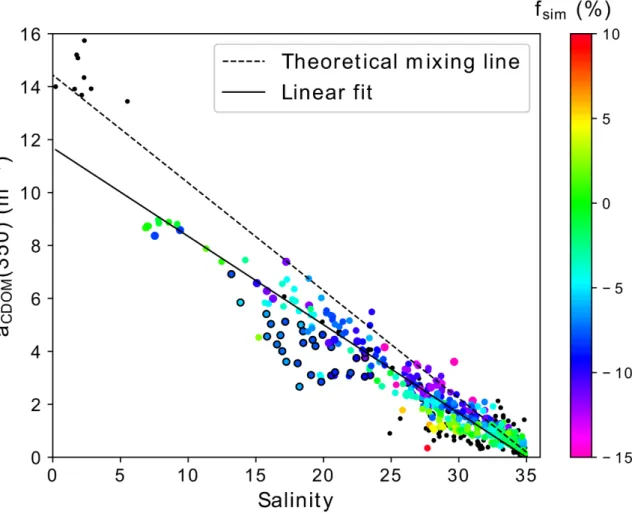
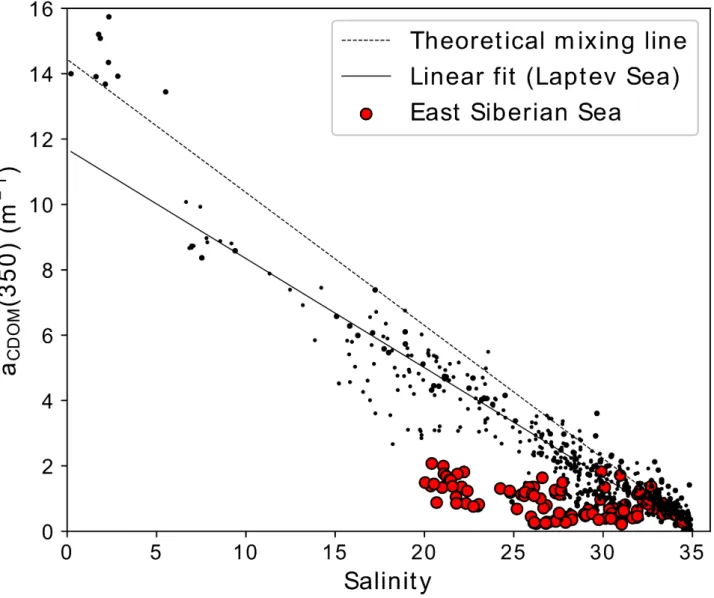
3.3 Distribution of tDOM and stable oxygen isotope characteristics in the Laptev Sea (LS) and East Siberian Sea (ESS) The samples from the LS showed a significant negative linear relationship between salinity and aCDOM(350) (r² = 0.91, n = 474, 205
p < 0.01) (Fig. 4). A mixture of the Lena freshwater with an aCDOM(350) of 14.4 m-1 in summer (standard deviation 3.4 m-1, n
= 26; Juhls at al., 2020) and the tDOM-poor seawater (salinity > 34) of the Nansen Basin without significant losses and gains along the salinity gradient would follow a theoretical mixing line shown in Figure 4. The regression line calculated from the samples used in this study (linear fit in Fig. 4) intersects the aCDOM(350) axis at ~12 m-1. The cluster of seawater samples in the salinity range 15-23 that fall below the regression line (Fig. 4, black outline points), predominantly originate from the surface 210
waters of the southern LS and were sampled in September 2011 (YS11).
Figure 4. Salinity, aCDOM(350), and the percentage of sea-ice meltwater (fsim%) measured in the Laptev Sea in summer (NE10, LD10, YS11, VB13, VB14, AT18, and TA19_4). Black lines represent the linear regression fit (solid) and the theoretical linear mixing line (dashed) between Lena post-freshet river water (endmember value taken from Juhls et al., 2020) and seawater from the Arctic 215
Ocean (Nansen Basin). Black outlined points are water samples from the surface layer (< 20 m) taken in September 2011 north and east of the Lena Delta. Black dots represent samples on which no stable oxygen isotope analysis was performed.
To describe the influence of the formation and melting of sea ice on the distribution of tDOM in the LS, the stable oxygen isotope composition of the water was studied. At salinities > 25, most water samples, which are well below the regression line (Fig. 4, linear fit) showed an increased proportion of sea ice meltwater (positive fsim). In contrast, many samples above the 220
regression line showed higher proportions of brine (negative fsim). The addition of brines, which are expelled from the sea ice during formation, was most apparent in a winter-water sample from the northern edge of the landfast-ice taken at 10 m water depth that showed a minimum fsim of -20% at a salinity of 29.7 and a comparatively high aCDOM(350) of ≈ 4 m-1. Shelf waters during winter also showed higher DOC concentrations (mean 254 µmol L-1, salinity from 10 to 31) compared to summer shelf waters of the same salinity (mean 199 µmol L-1).
225
Sampling in the ESS was carried out in August and September 2019. Across the ESS, salinities were above 20 in 2019 (Fig.
5). Even in coastal areas near the Indigarka and Kolyma rivers surface-water salinities were above 20. Moreover, aCDOM350 in the ESS (Fig. 5, red points) was significantly lower compared to LS water (Fig. 5, black points) at similar salinities and consistently below the mixing lines observed in the LS.
230
Figure 5. Salinity and aCDOM(350) measured in the East Siberian Sea in August and September 2019 (TA19_4; red dots) and the LS (black dots, for a detailed description see Fig. 4)
3.4 DOM in landfast-ice and under-ice water samples
The DOC concentration and optical properties of DOM in the landfast-ice of the southeastern LS were investigated in March and April 2012. The ice core samples had a salinity of 3.6 and an aCDOM(350) of 0.99 m-1 (median of n = 52 for both, salinity 235
and aCDOM(350)), which was approximately 10% of the aCDOM(350) observed in seawater with comparable salinity (Fig. 6).
High aCDOM(350) values of up to 4 m-1 were observed in the lowermost sections of an ice core close to the northern border of the land-fast ice. The high aCDOM(350) coincided with high chlorophyll-a concentrations (K. Abramova, pers comm.), which points to a higher proportion of marine DOM close to the ice-water interface.
240
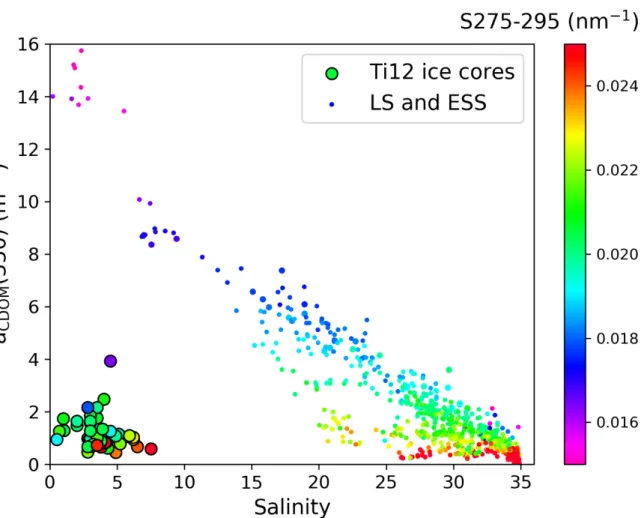
Figure 6. Salinity and aCDOM(350)including ice core data (large black outlined dots) from the landfast-ice in the Laptev Sea (LS) and water samples from the LS and East Siberian Sea (ESS) (small dots). The color of the dots shows the slope of the absorption spectra in the range between 275 and 295 nm (S275-295).
The slope of the absorption spectra in the ultraviolet range from 275 nm to 295 nm (S275-295) was related to photochemically induced shifts in molecular weights (Helms et al. 2008). In LS and ESS, S275-295 showed an inverse relationship to salinity (Fig.
245
6), suggesting that the molecular weight of tDOM in marine waters was affected by photochemical processes. Similar to the marine waters, the landfast-ice showed high S275-295 values (median = 0.0207 nm-1). An exception were the two chlorophyll- rich samples from the edge of the landfast-ice with S275-295 values of below 0.018 nm-1, indicating significantly higher molecular weights in these DOM samples.
4. Discussion 250
4.1 Dynamics of tDOM in the freshwater-influenced LS during spring and summer
Our results show that aCDOM(350) correlates strongly with the DOC concentration in riverine and marine LS and ESS waters.
The high correlation is clear evidence for the terrestrial origin of the DOM, which is transported with the river water to the LS and ESS (Lara et al, 1998; Dittmar and Kattner, 2003; Amon et al, 2012; Gonçalves-Araujo et al, 2015; Mann et al, 2016;
Kaiser et al, 2017b; Juhls et al, 2019). One reason for the generally low DOM contribution from marine algae, which would 255
significantly alter the dispersion in the CDOM-DOC dependence (Danhiez et al, 2017), could be the timing of sampling that was mainly conducted between late August and mid-September when chlorophyll concentrations on the LS shelf are generally below 1 mg/m³ (Janout et al., 2016).
To describe the tDOM dynamics in the Siberian shelf seas we analysed the optical properties of DOM along the salinity gradient in the LS, the ESS and the adjacent continental slope. In water samples from the LS, we found a statistically robust 260
negative correlation between aCDOM(350) and salinity (r² = 0.91, n = 474, p < 0.01). The strong linear relationship suggests that tDOM mixes conservatively with seawater during the transit of river water across the shelf. The calculated aCDOM(350) concentration of the river water endmember of ≈ 12 m-1 (Fig. 5, linear fit mixing line) is within the range of the Lena River post-freshet discharge in summer (14.4 m-1 with a standard deviation of 3.4 m-1, Juhls et al. 2020). Because aCDOM(350) in river water varies in summer between 10 m-1 and 22 m-1 (Juhls et al., 2020) the relatively high aCDOM(350) of 13.6-16 m-1 at 265
salinities < 6 as observed in the river plume close to the Lena Delta in summer 2010 (Fig. 4) were likely caused by short-term fluctuations of aCDOM(350) in the river.
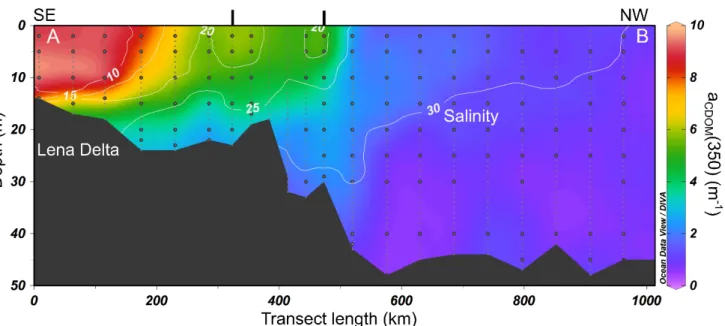
Conservative mixing is also apparent based on a hydrographic transect across the shelf observed in September 2010 (Fig. 7;
the location of the transect is given in Figure 1). The southeastern LS is dominated by the tDOM-rich river plume of the Lena.
In contrast, the salinity of the northwestern LS is mainly controlled by the inflow of tDOM-poor marine waters from the 270
Nansen Basin (Janout et al., 2013).
Figure 7. Salinity (white isoline) and aCDOM(350) (colour) on a ~ 1000 km long oceanographic transect from the Lena Delta (left) to the outer shelf of the northwestern Laptev Sea (September 2010; NE10). For the location of the profile see Figure 1. Small gray dots represent salinity measurements (meter averaged), black dots indicate water sampling for CDOM analysis. The figure was prepared 275
with Ocean Data View (ODV) using DIVA gridding (Schlitzer, 2002)
Due to the input of more than 200 km³ of tDOM-rich freshwater with an average aCDOM(350) of 26.1 m-1 over the course of the spring freshet we expected a cluster of samples with aCDOM(350) values distinctly above the theoretical mixing line between the summer discharge of the Lena River and seawater from the Nansen Basin. However, the acdom(350) vs. salinity distribution of all summer (Aug-Sept) expeditions gives no indication of the presence of freshet-related high-tDOM river water. The 280
absence of tDOM-rich waters from the freshet on the LS shelf was also noticed in an August 2008 study by Alling et al. (2010), who suggested that the lack of tDOM-rich waters was caused by a rapid wind-driven eastward transport into the adjacent ESS.
Nevertheless, the area of freshwater influence (ROFI) extends far north to the outer LS shelf under predominantly easterly winds, similar to the conditions observed in 2008. This was also observed in 2011, when strong southeasterly summer winds (Janout et al., 2020), coincided with mixed layer salinities below 16 ~ 300 km north of the Lena delta. The northern part of the 285
ROFI should thus contain a significant amount of tDOM-rich freshwater from the spring freshet. However this was not apparent from the data (Fig. 4).
One possible explanation for the absence of high tDOM waters from the spring freshet within the ROFI could be photochemical or biogeochemical removal. This would imply that ~50% of the tDOM discharged into the southeastern LS in May and June had already been removed prior to the August and September sampling period. A study in the Mackenzie River showed that 290
photodegradation of tDOM was highest after the spring freshet (Osburn et al., 2009). Nevertheless, photochemical degradation of the DOM should not play an important role during the Lena spring freshet, as the river plume flows mostly underneath the land-fast ice (Hölemann et al., 2005) that covers the inner shelf from October to mid-July (Barreis and Görgen, 2005;
aCDOM(350) for the freshwater end-member should be well below 12 m-1 because the river water is diluted with meltwater from 295
the land-fast ice that has a low aCDOM(350).
4.2 The importance of the freeze-melt cycle of land-fast ice for tDOM dynamics
DOM is expelled from the ice matrix during ice formation and is enriched in the brine, which then is ejected into the ambient seawater (Giannelli et al., 2001; Müller et al., 2013). Consequently, the average aCDOM(350) in landfast-ice is significantly lower than in surface water of the ROFI from which the ice originated. The formation of the land-fast ice, which stores 30- 300
50% of the annual freshwater discharge of the Lena River (Eicken et al., 2005), begins in mid-November with phases of rapid development in January and February (Selyushenok et al., 2015) during which the release of tDOM-rich brine is highest. In the following summer, when the land-fast ice melts, the tDOM-poor meltwater mixes with the ambient seawater and thus could dilute the tDOM concentration of the surface mixed layer (Mathis et al., 2005; Logvinova et al., 2016). On the inner shelf the melting starts close to the Lena Delta in June and progresses eastward while the seaward edge of the landfast-ice moves slowly 305
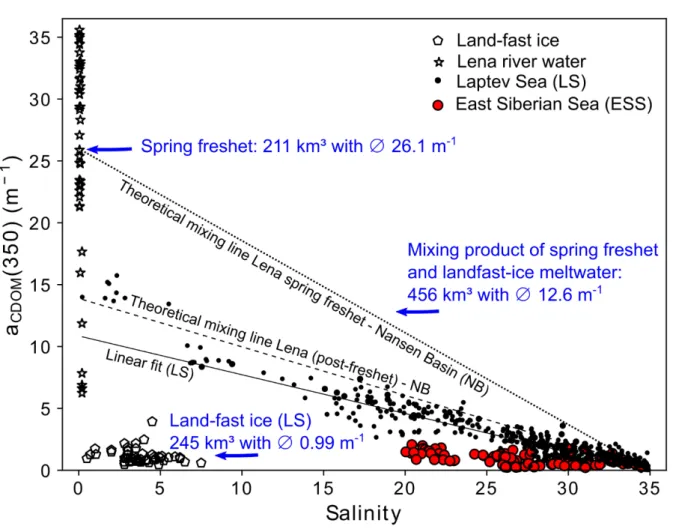
southward (Selyuzhenok et al., 2015). In general, the ice in the southeastern LS retreats completely by the end of July. The melting of the landfast-ice therefore occurs at the same time and in the same region where the freshet enters the LS. It is therefore likely that the meltwater mixes completely with the river water from the spring freshet (Bauch et al, 2013). To evaluate the influence of mixing on the tDOM concentration, we established a tDOM budget for the southeastern LS. During the course of the freshet in 2014 the Lena discharged about 211 km³ of freshwater with a flow-weighted average aCDOM(350) 310
of 26.1 m-1 and a DOC load of 2.35 Tg. The maximum land-fast ice area in the southeastern LS is 134 x 10³ km² (Selyushenok et al., 2015) with an average ice thickness of 2.04 m (Kotchetov et al., 1994; Barreis and Görgen, 2005). With an average salinity of 3.6, the land-fast ice thus holds a freshwater equivalent of 245 km³ (reference salinity 34.8) with a median aCDOM(350) of 0.99 m-1 and a total DOC load of 0.28 Tg. Our budget calculations reveal that the mixing product of meltwater and the river water from the spring freshet has an aCDOM(350) of 12.6 m-1. This is close to the average absorption of the post- 315
freshet (summer) discharge of the Lena River and matches the aCDOM(350) of the freshwater end member calculated based on the LS samples. Thus the mixing of land-fast ice meltwater with low tDOM concentration and freshet related river water with high tDOM concentration may explain the significant negative linear relationship between salinity and aCDOM(350) in the LS.
Figure 8. Salinity and acdom350 measured in land-fast ice from the Laptev Sea (pentagon), Lena river water during the freshet (stars), 320
and marine waters from the Laptev (black dots) and East Siberian Sea (red dots). The lines represent the theoretical mixing lines between the river water of the spring freshet and seawater water of the Nansen Basin (dotted line), the Lena discharge during the summer (post-freshet) and the Nansen Basin (broken line) and the linear regression fit in the LS (solid line). The blue arrows indicate the average acdom350 value and the water volume of the spring freshet and land-fast ice meltwater (freshwater equivalent), as well as the mixing product of the two freshwater sources.
325
The reason that the high meltwater input in the southern LS was only mentioned in a few studies is likely also due to the difficulty of interpreting oxygen isotope data from seasonally ice-covered shelves. The proportions of meltwater and brine visible in the oxygen isotope data from the LS at salinities > 25 are not clearly pronounced at salinities < 25 (Fig. 4). The fact that the oxygen isotope data from shelf water with salinities < 25 do not indicate a dilution with meltwater, but even show increased amounts of brine, does not mean that no meltwater was added. This, at a first glance, contradictory result can be 330
explained by the high export of sea ice in winter (Itkin and Krumpen, 2017). Part of the brine formed in winter is still present in the LS the following summer (Schlosser et al., 1994; Bauch et al., 2009b), while the newly-formed sea ice from which the brine originates is continuously exported to the central AO. At the end of winter the LS is therefore mainly covered with
brine signal (Bauch et al. 2013), but the isotopic composition nevertheless remains dominated by the brine-enriched winter 335
water. Hence, the stable oxygen isotope signal of the sea-ice meltwater fraction is masked by the high brine signal from the winter.
4.3 Land-fast ice meltwater as cause for the tDOM-Salinity anomaly in the LS in 2011 and the ESS in 2019
Previous studies indicate that approximately 30% of the river-induced DOC is remineralised already on the shelf (Cooper et al., 2005), with the western ESS being a hotspot for organic matter degradation (Anderson et al., 2011; Anderson and Amon, 340
2015; Semiletov et al., 2016). Thus, increased removal of tDOM could also be the cause for the low-tDOM cluster of samples that we observed in the LS in September 2011. The cluster, which lies well below the linear mixing line (black outlined dots in Figure 4) represents water samples from the upper water column (< 20 m) north of the Lena Delta. aCDOM(350) in the low- tDOM cluster was up to 40 % lower than in samples with the same salinity lying on the mixing line. The general hydrography of the LS in September 2011 was characterized by low surface mixed layer salinities and sea surface temperatures (SST), 345
which were ~ 2 °C higher than the long term average (ERA5;Copernicus Climate Change Service, 2017). High SSTs caused by solar warming, support the assumption that photodegradation is the major factor leading to tDOM loss and a high S275-295. However, surface samples from the region with highest SSTs in 2011 have S275-295 gradients which correspond to samples that were taken during years with average SST. An alternative explanation to the removal of tDOM in 2011 could be a change in the relative proportion of one of the freshwater endmembers or a change in concentration in one of the tDOM sources. In 2011, 350
large areas of the southeastern LS were covered by melting land-fast ice until the end of July. Exceptionally strong southeasterly winds in August 2011 (Janout et al., 2020) directed the meltwater plume to the northwest resulting in an additional admixture of CDOM-poor meltwater to the shelf waters north of the Lena Delta, and a further dilution of shelf waters with low-tDOM meltwater late in August and September. Although a decrease of the tDOM concentration due to photochemical or biogeochemical processes cannot be excluded, our study indicates that mixing of plural water masses rather 355
than removal controls the tDOM distribution on this shelf. Similar findings were discussed for the Chukchi Sea (Tanaka et al., 2016).
The relationship between salinity and aCDOM(350) measured in the ESS in summer 2019 was significantly different from the relationship observed in the LS. The entire ESS shelf had salinities above 20 and aCDOM(350) being about 50% lower than in LS samples having the same salinity (Fig. 5). Pugach et al. (2018) showed that the distribution of tDOM concentration in the 360
ESS is mainly controlled by wind forcing. During our sampling in the ESS in 2019, winds from the east (ERA5;Copernicus Climate Change Service, 2017) pushed the inflow from the Pacific Ocean westward far onto the ESS shelf. At the same time, southeasterly winds over the LS might have blocked the Lena ROFI from extending into the western ESS (Anderson et al., 2011; Janout et al., 2020). In addition, summer 2019 was characterized by anomalously low river discharge into the LS and ESS (ArcticGRO; Shiklomanov et al., 2020). The wind forcing and low river discharge led to a tDOM and salinity distribution 365
in the ESS in 2019 that was comparable to the distribution in 2008 and 2011, during which wind forcing was similar (Alling et al., 2010; Pugach et al., 2018). In contrast, in summers when the Lena River ROFI extends further eastward, the western
ESS is characterized by lower salinities and higher tDOM concentrations (Pugach et al., 2018), with a salinity-tDOM relationship that corresponds to the one we observed in the ROFI of the LS . Alling et al., (2010) assumed that due to the long residence time of the water of the Lena River on the ESS shelf, degradation of tDOM may be more advanced, leading to 370
generally low tDOM concentrations in the western ESS, as observed in August and September 2008. However, the addition of large amounts of land-fast ice meltwater should, just as in the LS, lead to a strong dilution of the already low river water input. The ESS west of 170° E is characterized by an extensive land-fast ice belt that varies in extent from 130,000 km² to 200,000 km². The land-fast ice, which contains a freshwater equivalent of 230-360 km³, usually melts back in the first two weeks of July, and drifting fields of decaying ice might persist until August. We assume that the absence of the Lena ROFI in 375
the western ESS, the generally low river runoff and the resulting higher fraction of low-tDOM land-fast ice meltwater in the ESS led to the comparatively low tDOM concentrations in the western ESS observed in 2008 and 2019. This assumption contradicts the study by Alling et al. (2010), which emphasizes that the analysis of oxygen isotope data showed no evidence of meltwater input in the western ESS in September 2008. However, as the analysis of the ice distribution in 2008 (ASI sea ice concentration; Spreen et al., 2008) shows, the land-fast ice still covered large areas of the southern ESS in mid-July. It is 380
therefore more likely that the difficult interpretation of oxygen isotope data from seasonally ice covered shelves that are characterized by high sea ice export rates (see chapter 4.2) led to an overlooking of the land-fast ice meltwater signal.
4.4 Transport dynamics of tDOM-rich brines in the LS
The land-fast ice in the southeastern LS forms from seawater with an average salinity of 9 (SD ± 8) and an average DOC concentration of 475 µmol L-1 (SD 165 µmol L-1). As a result, about 1.2 Tg DOC is removed from the land-fast ice with the 385
brine in winter. The process of brine release is reflected in the water samples from the polynya at the northern landfast-ice edge in the southeastern LS, which show high brine fractions with simultaneously increased tDOM concentrations (Ti12, winter 2012). High S275-295values (≥ 0.02 nm-1) in sea ice and in brine-enriched waters near the polynya indicate that the molecular composition of tDOM in ice and brine was already altered (Helms et al., 2008).
Due to the low salinity of the surface mixed layer in the southeast LS at the beginning of the freezing season and the continuous 390
outflow of freshwater from the Lena River in winter (Juhls et al., 2020) the loss of buoyancy, which resulted from the addition of brine to the surface mixed layer is not high enough to completely erode the pycnocline by convective mixing processes.
This leads to permanently stratified waters under the land-fast ice of the southeastern LS (Bauch et al., 2009a) as well as in the Polynya north of the Lena Delta, even during phases of high ice production (Krumpen et al., 2011). The stratification of the water column results in the trapping of tDOM-rich brines in the upper water column followed by advection together with the 395
winter river discharge (Macdonald et al., 1995). How fast the brines are advected across the shelf depends on the ocean currents in winter. Eicken et al. (2005) described under-ice spreading velocities of 1-2.7 cm s-1. Moored velocity records from below the landfast-ice (1998-1999, Hölemann unpub. data) showed a residual northeastward flow of ~2 cm s-1. These velocities are on the same order of magnitude as those measured north of the Lena Delta in winter (Bauch et al., 2010; Janout et al., 2013).
northeastern LS shelf in March-April (Kwok and Morrison, 2011). At the continental margin residual eastward velocities can reach more than 20 cm s-1 (Janout et al., 2015). The tDOM-rich brine formed in the southeast LS in December could thus be transported over several hundred kilometres in a northeasterly direction until the end of June, when the land-fast ice melts.
This is in accordance with Bauch et al. (2009b) who showed that the residence time of the brines on the shelf could be as short as one year. A significant proportion of the near-surface waters of the LS and western ESS leaves the Siberian shelf north of 405
the New Siberian Islands (Morison and Kwok, 2012) and supplies the Transpolar Drift Stream with tDOM-rich water masses (Charette et al., 2020), while denser bottom waters flow north of the New Siberian Island further to the east and leave the shelf in the western ESS (Anderson et al. 2017). The transport of tDOM in the water masses at the upper halocline is confirmed by investigations in the East Greenland Current where a higher CDOM absorption occurring between 30 and 120 m water depth is explained by a high fraction of brine and river water from the Siberian shelves (Granskog et al., 2012).
410
During the northward transport of the brine-enriched water masses across the shelf, an increase in density occurs due to the further influx of brines from ice formation in leads and polynyas of the western and central LS (Janout et al., 2017). The brines formed on the shelf likely have a lower concentration of tDOM, thus diluting the tDOM concentration of the brines formed near the Lena Delta. However, the increase in density means that the brine rich in tDOM is now transported also in deeper water layers on the shelves. The water depth at which the brine is transported across the LS shelf depends mainly on the density 415
structure of the water column in winter, which in turn depends on the position of the ROFI in the previous summer (Bauch et al, 2012). An eastward-directed transport south of the New Siberian Islands towards the ESS at depth greater than ~ 20 m is inhibited by the shallow water depths of the Dmitry Laptev (10 m) and Sannikov Straits (18 m). Because brine-induced tDOM maxima have not been observed in the bottom waters of the LS and ESS shelves in summer we conclude that the cross-shelf transport of tDOM-rich brines is restricted to near surface waters. Since the tDOM in the brines has a higher bioavailability 420
(Jørgensen et al., 2015), a fast removal of the brine-related tDOM could also be important. In order to clarify these questions, further measurements with high spatial and temporal resolution during ice formation in the LS and ESS are necessary.
5. Conclusions
The eastern LS and western ESS jointly represent a region where much of the freshwater-influenced Siberian Shelf waters exit into the Transpolar Drift Stream toward Greenland and the Nordic Seas (Morison et al., 2012; Timmermans and Marshall, 425
2020). This region is thus a key region for a better understanding of the Arctic marine carbon cycle. The analysis of the extensive data set in this study, which covers several years and different seasons, clarifies that the distribution of tDOM the LS and ESS is mainly driven by the physical mixing of multiple water sources with different tDOM concentrations. Our analysis also shows that the formation and melting of the land-fast ice in the Laptev Sea and the peak spring discharge of the Lena River are of particular importance.
430
The duration of the landfast-ice season in the LS is reduced by 2.8 days per year (Seyushenok et al., 2015), while in the second decade of the 21st century the onset of the spring freshet of the Lena River happens about 6 days earlier than at the beginning
of the observational period in 1940 (Juhls et al., 2020). Further changes of the ice regime and the timing of spring freshet will certainly have an impact on the dynamics of tDOM in the AO. In addition, the decline of Arctic sea ice and the associated longer ice-free season will lead to changes in wind forcing in the shelf systems of the Arctic and to an increased input of solar 435
radiation into the water column. This will significantly change freshwater transport pathways and water column stratification in the LS and ESS. Because stratification controls where and at which depth the tDOM-rich brine leaves the shelf, changes in shelf stratification also impact the future transport pathways of tDOM in the AO. Furthermore, the increased input of solar radiation causes a rise in water temperature in summer (Timmermans et al., 2020b) and could thus potentially intensify the photochemical processes in the surface mixed layer. The study of tDOM dynamics in the AO is important not only to decipher 440
the Arctic carbon cycle, but also because it regulates physical processes such as radiation input into the upper ocean, which has important effects on sea surface temperature, water column stratification and the penetration depth of UV radiation (Gnanadeskian et al. 2019; Soppa et al., 2019).
More detailed studies of the physical and biogeochemical processes on the Arctic shelves in all seasons are needed to predict how the tDOM dynamics will change with respect to climate change within the Arctic.
445
References
Alling, V., Sanchez-Garcia, L., Porcelli, D., Pugach, S., Vonk, J. E., van Dongen, B., Morth, C. M., Anderson, L. G., Sokolov, A., Andersson, P., Humborg, C., Semiletov, I., and Gustafsson, O.: Nonconservative behavior of dissolved organic carbon across the Laptev and East Siberian seas, Global Biogeochem Cy, 24, Artn Gb4033, 10.1029/2010gb003834, 2010.
Amon, R. M. W.: The role of dissolved organic matter for the organic carbon cycle in the Arctic Ocean, in: The organic carbon 450
cycle in the Arctic Ocean, edited by: Stein, R., and MacDonald, R. W., Springer Verlag, Berlin, 83-99, 2004.
Amon, R. M. W., and Meon, B.: The biogeochemistry of dissolved organic matter and nutrients in two large Arctic estuaries and potential implications for our understanding of the Arctic Ocean system, Mar Chem, 92, 311-330, 10.1016/j.marchem.2004.06.034, 2004.
Amon, R. M. W., Rinehart, A. J., Duan, S., Louchouarn, P., Prokushkin, A., Guggenberger, G., Bauch, D., Stedmon, C., 455
Raymond, P. A., Holmes, R. M., McClelland, J. W., Peterson, B. J., Walker, S. A., and Zhulidov, A. V.: Dissolved organic matter sources in large Arctic rivers, Geochim Cosmochim Ac, 94, 217-237, 10.1016/j.gca.2012.07.015, 2012.
Anderson, L. G., Bjork, G., Jutterstrom, S., Pipko, I., Shakhova, N., Semiletov, I., and Wahlstrom, I.: East Siberian Sea, an Arctic region of very high biogeochemical activity, Biogeosciences, 8, 1745-1754, 10.5194/bg-8-1745-2011, 2011.
Anderson, L. G., and Amon, R. M. W.: Chapter 14 - DOM in the Arctic Ocean, in: Biogeochemistry of Marine Dissolved 460
Organic Matter (Second Edition), edited by: Hansell, D. A., and Carlson, C. A., Academic Press, Boston, 609-633, 2015.
Anderson, L. G., and Macdonald, R. W.: Observing the Arctic Ocean carbon cycle in a changing environment, Polar Res, 34, ARTN 26891, 10.3402/polar.v34.26891, 2015.
Anderson, L. G., Jorgen, E. K., Ericson, Y., Humborg, C., Semiletov, I., Sundbom, M., and Ulfsbo, A.: Export of calcium carbonate corrosive waters from the East Siberian Sea, Biogeosciences, 14, 1811-1823, 10.5194/bg-14-1811-2017, 2017.
465
Barreis, J., and Görgen, K.: Spatial and temporal variability of sea ice in the Laptev Sea: analyses and review of satellite passive-microwave data and model results, 1979 to 2002, Global Planet Change, 48, 28-54, 2005.
Bauch, D., Erlenkeuser, H., and Andersen, N.: Water mass processes on Arctic shelves as revealed from delta O-18 of H2O, Global Planet Change, 48, 165-174, DOI 10.1016/j.gloplacha.2004.12.011, 2005.
Bauch, D., Dmitrenko, I., Kirillov, S., Wegner, C., Holemann, J., Pivovarov, S., Timokhov, L., and Kassens, H.: Eurasian 470
Arctic shelf hydrography: Exchange and residence time of southern Laptev Sea waters, Cont Shelf Res, 29, 1815-1820, 10.1016/j.csr.2009.06.009, 2009a.
Bauch, D., Dmitrenko, I. A., Wegner, C., Holemann, J., Kirillov, S. A., Timokhov, L. A., and Kassens, H.: Exchange of Laptev Sea and Arctic Ocean halocline waters in response to atmospheric forcing, J Geophys Res-Oceans, 114, Artn C05008, 10.1029/2008jc005062, 2009b.
475
Bauch, D., Holemann, J., Willmes, S., Groger, M., Novikhin, A., Nikulina, A., Kassens, H., and Timokhov, L.: Changes in distribution of brine waters on the Laptev Sea shelf in 2007, J Geophys Res-Oceans, 115, Artn C11008, 10.1029/2010jc006249, 2010.
Bauch, D., van der Loeff, M. R., Andersen, N., Torres-Valdes, S., Bakker, K., and Abrahamsen, E. P.: Origin of freshwater and polynya water in the Arctic Ocean halocline in summer 2007, Prog Oceanogr, 91, 482-495, 10.1016/j.pocean.2011.07.017, 480
2011.
Bauch, D., Holemann, J. A., Dmitrenko, I. A., Janout, M. A., Nikulina, A., Kirillov, S. A., Krumpen, T., Kassens, H., and Timokhov, L.: Impact of Siberian coastal polynyas on shelf-derived Arctic Ocean halocline waters, J Geophys Res-Oceans, 117, Artn C00g12, 10.1029/2011jc007282, 2012.
Bauch, D., Holemann, J. A., Nikulina, A., Wegner, C., Janout, M. A., Timokhov, L. A., and Kassens, H.: Correlation of river 485
water and local sea-ice melting on the Laptev Sea shelf (Siberian Arctic), J Geophys Res-Oceans, 118, 550-561, 10.1002/jgrc.20076, 2013.
Bauch, D., Cherniavskaia, E., Novikhin, A., Kassens, H.: Physical oceanography, nutrients, and δ¹⁸O measured on water bottle samples in the Laptev Sea. PANGAEA, https://doi.org/10.1594/PANGAEA.885448, 2018.
Bauch, D., Thibodeau, B.: Stable oxygen isotope analysis of water samples during helicopter/ice camp TRANSDRIFT-XX, 490
Laptev Sea. PANGAEA, https://doi.org/10.1594/PANGAEA.924538, 2020.
Biskaborn, B. K., Smith, S. L., Noetzli, J., Matthes, H., Vieira, G., Streletskiy, D. A., Schoeneich, P., Romanovsky, V. E., Lewkowicz, A. G., Abramov, A., Allard, M., Boike, J., Cable, W. L., Christiansen, H. H., Delaloye, R., Diekmann, B., Drozdov, D., Etzelmuller, B., Grosse, G., Guglielmin, M., Ingeman-Nielsen, T., Isaksen, K., Ishikawa, M., Johansson, M., Johannsson, H., Joo, A., Kaverin, D., Kholodov, A., Konstantinov, P., Kroger, T., Lambiel, C., Lanckman, J. P., Luo, D. L., 495
Malkova, G., Meiklejohn, I., Moskalenko, N., Oliva, M., Phillips, M., Ramos, M., Sannel, A. B. K., Sergeev, D., Seybold, C.,
Skryabin, P., Vasiliev, A., Wu, Q. B., Yoshikawa, K., Zheleznyak, M., and Lantuit, H.: Permafrost is warming at a global scale, Nat Commun, 10, ARTN 264, 10.1038/s41467-018-08240-4, 2019.
Cauwet, G., and Sidorov, I.: The biogeochemistry of Lena River: Organic carbon and nutrients distribution, Mar Chem, 53, 211-227, 10.1016/0304-4203(95)00090-9, 1996.
500
Charette, M. A., Kipp, L. E., Jensen, L. T., Dabrowski, J. S., Whitmore, L. M., Fitzsimmons, J. N., Williford, T., Ulfsbo, A., Jones, E., Bundy, R. M., Vivancos, S. M., Pahnke, K., John, S. G., Xiang, Y., Hatta, M., Petrova, M. V., Heimbürger-Boavida, L.-E., Bauch, D., Newton, R., Pasqualini, A., Agather, A. M., Amon, R. M. W., Anderson, R. F., Andersson, P. S., Benner, R., Bowman, K. L., Edwards, R. L., Gdaniec, S., Gerringa, L. J. A., González, A. G., Granskog, M., Haley, B., Hammerschmidt, C. R., Hansell, D. A., Henderson, P. B., Kadko, D. C., Kaiser, K., Laan, P., Lam, P. J., Lamborg, C. H., 505
Levier, M., Li, X., Margolin, A. R., Measures, C., Middag, R., Millero, F. J., Moore, W. S., Paffrath, R., Planquette, H., Rabe, B., Reader, H., Rember, R., Rijkenberg, M. J. A., Roy-Barman, M., Rutgers van der Loeff, M., Saito, M., Schauer, U., Schlosser, P., Sherrell, R. M., Shiller, A. M., Slagter, H., Sonke, J. E., Stedmon, C., Woosley, R. J., Valk, O., van Ooijen, J., and Zhang, R.: The Transpolar Drift as a Source of Riverine and Shelf-Derived Trace Elements to the Central Arctic Ocean, Journal of Geophysical Research: Oceans, 125, 10.1029/2019jc015920, 2020.
510
Coble, P. G.: Marine optical biogeochemistry: The chemistry of ocean color, Chem Rev, 107, 402-418, 10.1021/cr050350+, 2007.
Cooper, L. W., Benner, R., McClelland, J. W., Peterson, B. J., Holmes, R. M., Raymond, P. A., Hansell, D. A., Grebmeier, J.
M., and Codispoti, L. A.: Linkages among runoff, dissolved organic carbon, and the stable oxygen isotope composition of seawater and other water mass indicators in the Arctic Ocean, J Geophys Res-Biogeo, 110, Artn G02013, 515
10.1029/2005jg000031, 2005.
Copernicus Climate Change Service (C3S): ERA5: Fifth generation of ECMWF atmospheric reanalyses of the global climate.
Copernicus Climate Change Service Climate Data Store (CDS). https://cds.climate.copernicus.eu/cdsapp#!/home, 2017.
Craig, H.: Standard for Reporting Concentrations of Deuterium and Oxygen-18 in Natural Waters, Science, 133, 1833-1834, 10.1126/science.133.3467.1833, 1961.
520
Danhiez, F. P., Vantrepotte, V., Cauvin, A., Lebourg, E., and Loisel, H.: Optical properties of chromophoric dissolved organic matter during a phytoplankton bloom. Implication for DOC estimates from CDOM absorption, Limnol Oceanogr, 62, 1409- 1425, 10.1002/lno.10507, 2017.
Dittmar, T., and Kattner, G.: The biogeochemistry of the river and shelf ecosystem of the Arctic Ocean: a review, Mar Chem, 83, 103-120, 10.1016/S0304-4203(03)00105-1, 2003.
525
Eicken, H., Dmitrenko, I., Tyshko, K., Darovskikh, A., Dierking, W., Blahak, U., Groves, J., and Kassens, H.: Zonation of the Laptev Sea landfast ice cover and its importance in a frozen estuary, Global Planet Change, 48, 55-83, 10.1016/j.gloplacha.2004.12.005, 2005.
Eulenburg, A., Juhls, B., Hölemann, J. A.: Surface water dissolved organic matter (DOC, CDOM) in the Lena River.
Frey, K. E., and Smith, L. C.: Amplified carbon release from vast West Siberian peatlands by 2100, Geophys Res Lett, 32, Artn L09401, 10.1029/2004gl022025, 2005.
Giannelli, V., Thomas, D. N., Haas, C., Kattner, G., Kennedy, H., and Dieckmann, G. S.: Behaviour of dissolved organic matter and inorganic nutrients during experimental sea-ice formation, Ann Glaciol, 33, 317-321, 10.3189/172756401781818572, 2001.
535
Gnanadesikan, A., Kim, G. E., and Pradal, M. A. S.: Impact of Colored Dissolved Materials on the Annual Cycle of sea Surface Temperatuer: Potential Implications for Extreme Ocean Temperatures, Geophys Res Lett, 46, 861-869, 10.1029/2018gl080695, 2019.
Goncalves-Araujo, R., Stedmon, C. A., Heim, B., Dubinenkov, I., Kraberg, A., Moiseev, D., and Bracher, A.: From Fresh to Marine Waters: Characterization and Fate of Dissolved Organic Matter in the Lena River Delta Region, Siberia, Front Mar 540
Sci, 2, UNSP 108, 10.3389/fmars.2015.00108, 2015.
Granskog, M. A.: Changes in spectral slopes of colored dissolved organic matter absorption with mixing and removal in a terrestrially dominated marine system (Hudson Bay, Canada), Mar Chem, 134, 10-17, 10.1016/j.marchem.2012.02.008, 2012.
Granskog, M. A., Stedmon, C. A., Dodd, P. A., Amon, R. M. W., Pavlov, A. K., de Steur, L., and Hansen, E.: Characteristics of colored dissolved organic matter (CDOM) in the Arctic outflow in the Fram Strait: Assessing the changes and fate of 545
terrigenous CDOM in the Arctic Ocean, J Geophys Res-Oceans, 117, Artn C12021, 10.1029/2012jc008075, 2012.
Granskog, M. A., Pavlov, A. K., Sagan, S., Kowalczuk, P., Raczkowska, A., and Stedmon, C. A.: Effect of sea-ice melt on inherent optical properties and vertical distribution of solar radiant heating in Arctic surface waters, J Geophys Res-Oceans, 120, 7028-7039, 10.1002/2015jc011087, 2015.
Guo, L. D., Ping, C. L., and Macdonald, R. W.: Mobilization pathways of organic carbon from permafrost to arctic rivers in a 550
changing climate, Geophys Res Lett, 34, Artn L13603, 10.1029/2007gl030689, 2007.
Haine, T. W. N., Curry, B., Gerdes, R., Hansen, E., Karcher, M., Lee, C., Rudels, B., Spreen, G., de Steur, L., Stewart, K. D., and Woodgate, R.: Arctic freshwater export: Status, mechanisms, and prospects, Global Planet Change, 125, 13-35, 10.1016/j.gloplacha.2014.11.013, 2015.
Hansell, D. A., Kadko, D., and Bates, N. R.: Degradation of terrigenous dissolved organic carbon in the western Arctic Ocean, 555
Science, 304, 858-861, 10.1126/science.1096175, 2004.
Helms, J. R., Stubbins, A., Ritchie, J. D., Minor, E. C., Kieber, D. J., and Mopper, K.: Absorption spectral slopes and slope ratios as indicators of molecular weight, source, and photobleaching of chromophoric dissolved organic matter, Limnol Oceanogr, 53, 955-969, 10.4319/lo.2008.53.3.0955, 2008.
Hölemann, J. A., Schirmacher, M., and Prange, A.: Seasonal variability of trace metals in the Lena River and the southeastern 560
Laptev Sea: Impact of the spring freshet, Global Planet Change, 48, 112-125, 10.1016/j.gloplacha.2004.12.008, 2005.
Hölemann, J. A., Juhls, B., Timokhov, L. A.: Colored dissolved organic matter (CDOM) measured during cruise TRANSDRIFT-XVII, Laptev Sea. PANGAEA, https://doi.org/10.1594/PANGAEA.924206, 2020a.
Hölemann, J., Koch, B. P., Juhls, B., Timokhov, L. A.: Colored dissolved organic matter (CDOM) and dissolved organic carbon (DOC) measured during cruise TRANSDRIFT-XIX, Laptev Sea. PANGAEA, 565
https://doi.org/10.1594/PANGAEA.924209, 2020b.
Hölemann, J. A., Koch, B. P., Juhls, B., Timokhov, L. A.: Colored dissolved organic matter (CDOM) and dissolved organic carbon (DOC) measured during helicopter/ice camp TRANSDRIFT-XX, Laptev Sea. PANGAEA, https://doi.org/10.1594/PANGAEA.924228, 2020c.
Hölemann, J. A., Juhls, B., Timokhov, L. A.: Colored dissolved organic matter (CDOM) measured during cruise 570
TRANSDRIFT-XXI, Laptev Sea. PANGAEA, https://doi.org/10.1594/PANGAEA.924203, 2020d.
Hölemann, J., Koch, B. P., Juhls, B., Timokhov, L. A.: Colored dissolved organic matter (CDOM) and dissolved organic carbon (DOC) measured during cruise TRANSDRIFT-XXII, Laptev Sea. PANGAEA, https://doi.org/10.1594/PANGAEA.924202, 2020e.
Hölemann, J. A., Koch, B. P., Juhls, B., Ivanov, V.: Colored dissolved organic matter (CDOM) and dissolved organic carbon 575
(DOC) measured during cruise TRANSDRIFT-XXIV, Laptev Sea. PANGAEA, https://doi.org/10.1594/PANGAEA.924210, 2020f.
Hölemann, J. A., Chetverova, A., Juhls, B., Kusse-Tiuz, N.: Colored dissolved organic matter (CDOM) and dissolved organic carbon (DOC) measured during cruise TRANSARKTIKA-2019 Leg4, Laptev Sea and East Siberian Sea. PANGAEA, https://doi.org/10.1594/PANGAEA.924211, 2020g.
580
Holmes, R. M., McClelland, J. W., Raymond, P. A., Frazer, B. B., Peterson, B. J., and Stieglitz, M.: Lability of DOC transported by Alaskan rivers to the arctic ocean, Geophys Res Lett, 35, Artn L03402, 10.1029/2007gl032837, 2008.
Holmes, R. M., McClelland, J. W., Peterson, B. J., Tank, S. E., Bulygina, E., Eglinton, T. I., Gordeev, V. V., Gurtovaya, T.
Y., Raymond, P. A., Repeta, D. J., Staples, R., Striegl, R. G., Zhulidov, A. V., and Zimov, S. A.: Seasonal and Annual Fluxes of Nutrients and Organic Matter from Large Rivers to the Arctic Ocean and Surrounding Seas, Estuar Coast, 35, 369-382, 585
10.1007/s12237-011-9386-6, 2012.
Hugelius, G., Strauss, J., Zubrzycki, S., Harden, J. W., Schuur, E. A. G., Ping, C. L., Schirrmeister, L., Grosse, G., Michaelson, G. J., Koven, C. D., O'Donnell, J. A., Elberling, B., Mishra, U., Camill, P., Yu, Z., Palmtag, J., and Kuhry, P.: Estimated stocks of circumpolar permafrost carbon with quantified uncertainty ranges and identified data gaps, Biogeosciences, 11, 6573-6593, 10.5194/bg-11-6573-2014, 2014.
590
Itkin, P., and Krumpen, T.: Winter sea ice export from the Laptev Sea preconditions the local summer sea ice cover and fast ice decay, Cryosphere, 11, 2383-2391, 10.5194/tc-11-2383-2017, 2017.
Janout, M. A., Holemann, J., and Krumpen, T.: Cross-shelf transport of warm and saline water in response to sea ice drift on the Laptev Sea shelf, J Geophys Res-Oceans, 118, 563-576, 10.1029/2011jc007731, 2013.
Janout, M. A., Aksenov, Y., Holemann, J. A., Rabe, B., Schauer, U., Polyakov, I. V., Bacon, S., Coward, A. C., Karcher, M., 595
Lenn, Y. D., Kassens, H., and Timokhov, L.: Kara Sea freshwater transport through Vilkitsky Strait: Variability, forcing, and
further pathways toward the western Arctic Ocean from a model and observations, J Geophys Res-Oceans, 120, 4925-4944, 10.1002/2014jc010635, 2015.
Janout, M. A., Holemann, J., Waite, A. M., Krumpen, T., von Appen, W. J., and Martynov, F.: Sea-ice retreat controls timing of summer plankton blooms in the Eastern Arctic Ocean, Geophys Res Lett, 43, 12493-12501, 10.1002/2016gl071232, 2016.
600
Janout, M. A., Holemann, J., Timokhov, L., Gutjahr, O., and Heinemann, G.: Circulation in the northwest Laptev Sea in the eastern Arctic Ocean: Crossroads between Siberian River water, Atlantic water and polynya-formed dense water, J Geophys Res-Oceans, 122, 6630-6647, 10.1002/2017jc013159, 2017.
Janout, M., Hölemann, J., Smirnov, A., Krumpen, T., Bauch, D., Laukert, G., and Timokhov, L.: On the variability of stratification in the freshwater influenced Laptev Sea region, Front Mar Sci, 10.3389/fmars.2020.543489, 2020.
605
Jorgensen, L., Stedmon, C. A., Kaartokallio, H., Middelboe, M., and Thomas, D. N.: Changes in the composition and bioavailability of dissolved organic matter during sea ice formation, Limnol Oceanogr, 60, 817-830, 10.1002/lno.10058, 2015.
Juhls, B., Overduin, P. P., Holemann, J., Hieronymi, M., Matsuoka, A., Heim, B., and Fischer, J.: Dissolved organic matter at the fluvial-marine transition in the Laptev Sea using in situ data and ocean colour remote sensing, Biogeosciences, 16, 2693- 2713, 10.5194/bg-16-2693-2019, 2019.
610
Juhls, B., Stedmon, C. A., Morgenstern, A., Meyer, H., Hölemann, J., Heim, B., Povazhnyi, V., and Overduin, P. P.: Identifying Drivers of Seasonality in Lena River Biogeochemistry and Dissolved Organic Matter Fluxes, Frontiers in Environmental Science, 8, 10.3389/fenvs.2020.00053, 2020.
Kaiser, K., Benner, R., and Amon, R. M. W.: The fate of terrigenous dissolved organic carbon on the Eurasian shelves and export to the North Atlantic, J Geophys Res-Oceans, 122, 4-22, 10.1002/2016jc012380, 2017a.
615
Kaiser, K., Canedo-Oropeza, M., McMahon, R., and Amon, R. M. W.: Origins and transformations of dissolved organic matter in large Arctic rivers, Sci Rep-Uk, 7, ARTN 13064, 10.1038/s41598-017-12729-1, 2017b.
Kattner, G., Lobbes, J. M., Fitznar, H. P., Engbrodt, R., Nothig, E. M., and Lara, R. J.: Tracing dissolved organic substances and nutrients from the Lena River through Laptev Sea (Arctic), Mar Chem, 65, 25-39, 10.1016/S0304-4203(99)00008-0, 1999.
Kattner, G., Juhls, B., Heim, B.: Surface water dissolved organic matter (DOC, CDOM) in the Lena River. PANGAEA, 620
https://doi.org/10.1594/PANGAEA.898705, 2010.
Köhler, H., Meon, B., Gordeev, V. V., Spitzy, A., and Amon, R. M. W.: Dissolved organic matter (DOM) in the estuaries of Ob and Yenisei and the adjacent Kara Sea, Russia, in: Siberian river run-off in the Kara Sea, edited by: Stein, R., Fahl, K., Fütterer, D. K., Galimov, E. M., and Stepanets, O. V., Proceedings in Marine Science, 6, Elsevier Science B. V., Amsterdam, 281-308, 2003.
625
Kotchetov, S. V., Kulakov, I. Y., Kurajov, V. K., Timokhov, L. A., and Vanda, Y. A.: Hydrometeorological regime of the Laptev Sea, Federal Service of Russia for Hydrometeorology and Monitoring of the Environment, Arctic and Antarctic Research Institute, St. Petersburg, Russia, 85, 1994.
Krumpen, T., Janout, M., Hodges, K. I., Gerdes, R., Girard-Ardhuin, F., Holemann, J. A., and Willmes, S.: Variability and trends in Laptev Sea ice outflow between 1992-2011, Cryosphere, 7, 349-363, 10.5194/tc-7-349-2013, 2013.
630