Research Collection
Other Publication
Adjustable Injection Currents: The Benefits of Controllable Inductors in Current Injection HVDC Circuit Breakers
Author(s):
Schultz, Tim; Spreen, L. Brook; Franck, Christian Publication Date:
2020-02-19 Permanent Link:
https://doi.org/10.3929/ethz-b-000400308
Rights / License:
Creative Commons Attribution-NonCommercial-ShareAlike 4.0 International
This page was generated automatically upon download from the ETH Zurich Research Collection. For more information please consult the Terms of use.
Adjustable Injection Currents:
The Benefits of Controllable Inductors
in Current Injection HVDC Circuit Breakers
doi: 20.500.11850/400308 www.hvl.ee.ethz.chT. Schultz, L. B. Spreen, C. M. Franck
High Voltage Laboratory, ETH Zurich, Physikstrasse 3, 8092, Zurich, Switzerland cfranck@ethz.ch
Abstract:
Economic and robust high voltage direct current (HVDC) circuit breakers are a strategic technology in the development of next- generation power transmission. Current injection circuit breakers require fewer complex components than other technologies, making them economically attractive. The limiting factor, however, remains the high current and voltage gradients which occur at zero current during the interruption of low fault currents.
This paper investigates a novel current injection topology that generates adjustable injection currents. This is realized by con- trolling the injection circuit inductance via a non-linear magnetic core. The inductance varies according to the core’s saturation state, which is manipulated by at least one control winding carrying a quasi-DC current. By holding inductance low at the beginning of injection, a minimal time-to-interruption may be achieved. Increasing inductance shortly before interruption reduces both the current gradient and ensuing transient voltages, thus reducing stresses on the mechanical interrupter.
In this paper, a simulation model for the proposed controllable inductor is developed and compared to results of a scaled-down experiment. On this basis, the topology is dimensioned for the use in a320 kVnetwork. The conducted simulations illustrate both feasibility and advantages of the novel topology compared to a reference current injection circuit.
Keywords: HVDC Circuit Breaker Topologies, Mechanical Circuit Breaker, Current Injection, Controllable Inductor, Magnetic Amplifier
1 Introduction
The exploitation of decentralized local and centralized but remote renewable energy sources has considerably influenced the structure of power generation in recent years. This has led to changing require- ments in energy transmission and sparked a new wave of research in HVDC technology.
In addition to a growing number of HVDC point-to-point connec- tions, the first multiterminal HVDC grids have been implemented [1–3]. As in HVAC, meshed grids require protection systems, includ- ing circuit breakers, that can interrupt fault currents and isolate faulty components from the grid. However, the requirements for fault current interruption in HVDC grids differs from HVAC. The most notable difference is the absence of a natural current zero cross- ing, which renders mechanical interrupters (MI), which are used in HVAC, ineffective. Additionally, faster fault clearance is required.
[4]To meet the requirements for fault current interruption in HVDC networks, a large number of different circuit breaker topologies have been proposed [5–7]. The general structure is typically composed of three branches, the nominal current path (NCP), the current commu- tation path (CCP) and the energy absorption path (EAP). The NCP is optimized for low resistance and carries the current if the circuit breaker is in closed state. It consists of a mechanical switch, which is either an ultra-fast disconnector or a mechanical interrupter. For cur- rent interruption, the current can be commutated into the CCP and the mechanical switch can be opened. Afterwards, a counter voltage is built up in the CCP. In the final step, the current is commutated into a surge arrester (SA) in the EAP, which limits the overvoltage to its clamping voltage and brings the fault current to leakage current level.
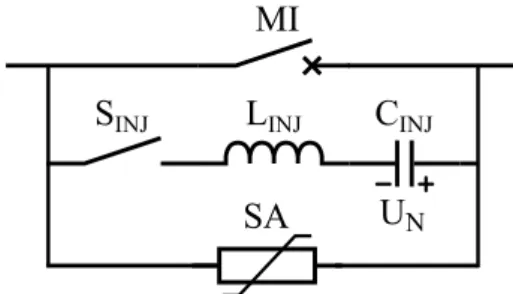
One promising DC circuit breaker realization is the current injec- tion topology (cf. Figure 1). It consists of a mechanical interrupter (MI) in the NCP and a combination of pre-charged capacitor (CINJ), inductor (LINJ) and injection switch (SINJ) in the CCP. When a fault is detected, the MI is signalled to open, drawing an arc, when a fault occurs. As soon as the contact distance of the MI is sufficient to withstand the transient interruption voltage (TIV), the injection switch is closed and a counter current is injected into the NCP to create an artificial current zero crossing. If the MI interrupts the fault
current in the NCP, the current flow is diverted into the CCP, charg- ing up the injection capacitor. The fault current starts to decrease as soon as the grid voltage is exceeded. When the clamping voltage of the SA is reached, the current commutates into the EAP, where excess energy is dissipated.
MI
SA U
NS
INJL
INJC
INJFig. 1: Schematic drawing of the current injection topology
The current injection topology does not require expensive stacks of (fully controllable) semiconductors. The injection switch can be realized with a spark gap [8]. This creates an economic advantage over other topologies and makes the current injection topology a promising candidate for the use in HVDC grids.
The reference current injection topology provides a sinusoidal injection current with fixed amplitude. This leads to increasing stresses when interrupting lower fault currents, as the gradient at zero crossing is higher. The maximum gradient that can occur at zero crossing is defined by the injection inductance and the capacitor pre- charging voltage. In addition, the remaining voltage in the injection capacitor is higher for lower fault currents, leading to an increased rate of rise of the initial transient interruption voltage (ITIV). The interruption limits of the mechanical interrupter consequently define a lower limit for the dimensioning of the injection circuit capacitor and inductor.
Regarding the technology of the mechanical interrupter, gas [9, 10] and vacuum interrupters [11–13] as well as a series connection of both [14, 15] have been suggested. Vacuum interrupters offer higher current interruption limits, but a lower voltage withstand capability
than gas interrupters. A series connection is therefore required for high voltages, increasing system complexity.
Research on current injection topologies dates back to the early stages of HVDC circuit breaker research [11, 12]. While more com- plex topologies have been proposed in the recent years, current injection topologies still provide a promising option due to their economic advantages. This is mirrored in current research and the installation of current injection circuit breakers in one of the first HVDC grids [16–18].
The commissioned current injection circuit breakers are based on a fixed injection current and a series connection of vacuum circuit breakers. However, current research suggests that interruption per- formance of current injection circuit breakers can be improved if a phase of decreased current gradient shortly before current zero crossing in the MI is added [19]. Such a phase can be generated by auxiliary circuits [20, 21]. The presented paper follows this line of thought with the introduction of an actively controllable inductor in the current injection circuit. This novel concept is derived from magnetic amplifiers and allows an active control of the inductance and thus shape of the injection current. It enables both a fast cur- rent zero creation and low stresses at interruption. This is possible by reducing the inductance of the injection circuit during the ramp- up phase of the injection current. The inductance is then increased shortly before the injection current creates the current zero cross- ing in the MI. This reduces both rate of rise of current (ROROC) before and rate of rise of voltage (ROROV) after current zero. In this paper, both simulations and measurements for a scaled down injection circuit have been conducted. Based on these, the simulation model is scaled to HVDC to illustrate the impact of the controllable inductor and investigate the feasibility of the concept. The results show that controllable inductors offer a promising solution to reduce capacitance and inductance in the injection circuit, further improving the economical advantage of the current injection topology. Addi- tionally, controllable inductors can enable the use of a single gas interrupter instead of a stack of vacuum interrupters, due to the lowered interruption stresses. This further simplifies the topology.
2 Controllable inductors
Controllable inductors (ContInd) consist of a main winding and a control winding that are linked by non-linear magnetic cores. The purpose of the control winding and its connected circuit is to set the working point of the core for the main winding by applying a DC or modulated current. The control circuit current can saturate or de- saturate the core, influencing the inductance seen by the main circuit.
[22, 23]
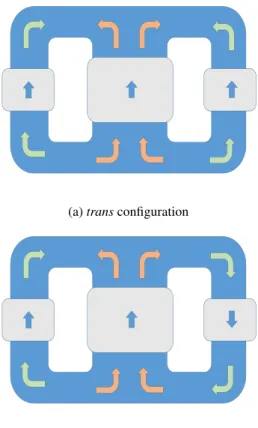
Based on this operation principle, the controllable inductor can be used as a binary switch (saturated / non-saturated) or as a mod- ulator, as evidenced by its use in transatlantic radio communication in the beginning of the20th century [24]. A standard design of a controllable inductor uses E-cores with the main winding on the cen- tral and split control windings on the outer legs. Depending on the connection of the control windings, two configurations can be real- ized. Either the control windings are connected to create opposing fluxes (trans-configuration, Figure 2a) or fluxes in the same direction (cis-configuration, Figure 2b)
In thecis-configuration, the application of a DC bias on the con- trol winding leads to a saturation of the outer parts of the core, in the central legs the fluxes compensate to a large extent. Consequently, the core is not completely saturated. If the main current is increased, it will create a flux that opposes the control flux in one leg and aligns with the flow direction in the other leg. This will drive one leg out of and one leg deeper into saturation. A further increase of main current will eventually lead to a saturation of all core legs as the flux gen- erated by the main current starts to dominate. Thecis-configuration allows a symmetrical operation, making it suitable for an operation with AC current on the main winding. The opposing connection of the control winding has the advantage that induced voltages from main winding current are equal but opposed, decoupling the effects from the control circuit.
(a)transconfiguration
(b)cisconfiguration
Fig. 2: Controllable inductor on a three-legged core, outer: control windings, inner: main winding
In contrast, in thetrans-configuration the control windings create opposing flows that also saturate the center leg of the core. A cur- rent in the main winding will cause a flux that either opposes both control fluxes or aligns with their direction. Thus, either driving the core out of saturation (and again into saturation with opposing flow direction for high main currents) or deeper into saturation. A sym- metrical operation for the use of AC on the main winding is not possible. However, thetrans-configuration offers the advantage of a larger unsaturated inductance of the main winding. As the control windings are not connected in opposed directions, voltages induced from the main into the auxiliary windings do not cancel each other.
In current injection circuit breaker topologies, the injection cur- rent is shaped by an LC circuit. As the inductance is fixed, the current is sinusoidal. A more favorable current shape would be reached if the initial inductance of the injection loop (NCP and CCP) would be low and increases before zero crossing in the MI to reduce ROROC.
This can be achieved with a controllable inductor in the CCP. Shortly before current injection, the control circuit can be used to saturate the core, leading to a fast current increase at the beginning of the injection. If control and injection circuit are designed in such a way that the flux of the main winding de-saturates the core before zero crossing, the increased inductance of the NCP - CCP loop causes a decrease in ROROC and ROROV. The stresses for the MI during interruption thus can be decreased.
3 Simulation model
To help in the design process and for extrapolation to HVDC sys- tems, a simulation model of the current injection topology with controllable inductor has been built. It is implemented using the PLECS® environment. The magnetic circuit is modelled with a sat- urable core and hysteresis is omitted. The magnetic field strength and the flux density are linked with anarctanfit, based on the following equation:
B= 2
πBsatarctan
πH
2a
+µ0H (1)
a= Bsat
µnon−sat−µ0 (2)
Here,Bsatdescribes the saturation flux density,µ0the saturated (vacuum) permeability andµnon−satthe unsaturated permeability.
While this model does not account for hysteresis, it proved to be faster and more stable over the investigated parameter range.
4 Experimental setup
The test circuit for investigating the impact of a controllable inductor on the interruption performance of a current injection circuit breaker is depicted in Figure 3.
Fault currents are generated by a low frequency LC circuit that can be connected to the circuit breaker by a making switch (SFAU).
The investigated DC circuit breaker is based on the current injection scheme. A model gas interrupter serves as the mechanical switch in the NCP, using a fixed contact system with an ignition wire and compressed air for interruption [25].
CINJ SINJ
LINJ
CCTRL
LAUX
MI
CMI RMI LFAU
CFAU SFAU
LCTRL1
LCTRL2 LContInd
Fig. 3: Experimental setup for measuring interruption performance of current injection topologies, gray: control circuit, red: magnetic coupling
The inductance in the injection circuit consists of an air core inductor (LINJ) and the controllable inductor (LContInd). The control circuit to apply a bias for core saturation consists of a pre- charged capacitor (CCTRL), which can be discharged through a the control windings of the ContInd (LCTRL1 and LCTRL2). A freewheeling diode ensures a unidirectional current flow.
In the freewheeling state, the current decays due to parasitic resistance of the circuit and diode losses. To increase the LR time constant and get closer to a quasi-DC current during the experiment, additional inductance is added (Laux).
Table 1 Parameters of the test circuit
Component Value Component Value CFAU 792µF Cctrl 392µF LFAU 7.5 mH Laux 125µH
CINJ 182µF LINJ 0.9 mH
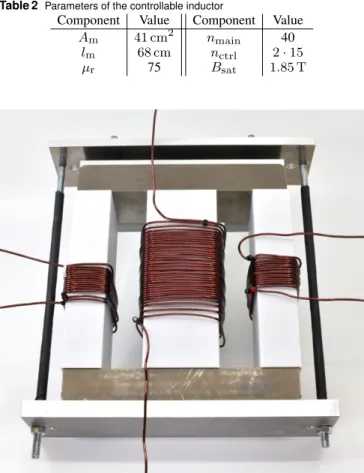
The controllable inductor is based on a double-E core design using two Micrometals E827-26 cores. The design parameters of the inductor are summarized in Table 2. A photo of the inductor used in the tests is shown in Figure 4. To maximize its effect and since only unidirectional current flow is required in the injection circuit, the controllable inductor is connected intrans-configuration.
Table 2 Parameters of the controllable inductor
Component Value Component Value Am 41 cm2 nmain 40
lm 68 cm nctrl 2·15
µr 75 Bsat 1.85 T
Fig. 4: Photo of the controllable inductor, the two E-cores are within a clamping system, control windings are on the outer legs, main winding on the inner, the core has a width of21 cmand is isolated from the windings using white polycarbonate sleeves
To investigate the impact of the controllable inductor on the injection current, a series of measurements with fixed mechanical parameters and a variation of control circuit current (i.e. control circuit capacitor pre-charge) has been conducted.
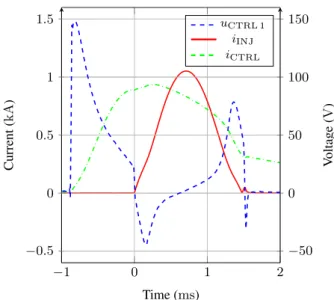
Figure 5 shows an example of the measured control circuit cur- rent (iCTRL), the voltage across one of the control circuit windings (uCTRL 1) as well as the current in the injection circuit (iINJ).
t= 0 smarks the start of the current injection. The control circuit is activated approximately800µsbefore current injection to ramp up the bias current. In the presented test, the pre-charge voltage of the control circuit is approximately400 Vand the peak current reaches slightly less than1 kA.
The current injection (iINJ) shows a slightly distorted wave shape due to the influence of the pre-saturated controllable induc- tor. It starts with a high current gradient, which after several tens of microseconds decreases as the flux generated by the main wind- ing drives the core out of saturation. At a injection current level of approximately 400 A, the core is driven into saturation again, resulting in an increased current gradient (t >200µs).
A variation of the control circuit current by adjusting the pre- charge can shift the de-saturation region for the injection current to higher or lower currents. Figure 6 shows measured and simulated injection currents for a variation of the control circuit pre-charge from0 Vto800 V. While both measurement and simulation show a shifting de-saturation region for a variation of control current, this effect is more pronounced in the simulation. Figure 7 shows the cur- rent gradient as a function of time for simulation and measurement.
Here, the de-saturation region can be seen more clearly. For zero pre- charge, both simulation and measurement show a similar behavior.
While both show the same general trends, the difference between simulation and measurement increases with increasing control cur- rent. The reduction in current gradient achvieved in this example is approximately 40%.
−1 0 1 2
−0.5 0 0.5 1 1.5
Time (ms)
Current(kA)
−50 0 50 100 150
Voltage(V)
uCTRL 1
iINJ
iCTRL
Fig. 5: Measured currents and voltages as function of time, control voltageuCTRL(t= 0) = 400 V
0 0.2 0.4 0.6 0
0.5 1
Time (ms) iINJ(kA)
(a) Measurement
0 0.2 0.4 0.6 0
0.5 1
Time (ms) (b) Simulation 0 V 200 V 400 V 600 V 800 V Fig. 6: Injection current as function of time for different control voltagesuCTRL(t= 0)
0 0.2 0.4 0.6 0
2 4
Time (ms)
diINJ dt(kAµs−1 )
(a) Measurement
0 0.2 0.4 0.6 0
2 4
Time (ms) (b) Simulation 0 V 200 V 400 V 600 V 800 V Fig. 7: didtINJ as function of time for different control voltages uCTRL(t= 0)
To complete the picture, the control current and the voltage across one of the two control windings are depicted in Figures 8 and 9 for both measurement and simulation. The control circuit current shows a similar time to peak, indicating that the L to C ratio is similar for simulation and experiment. In the simulation, peak current is higher, which can likely be attributed to a difference in damping due to skin effect and magnetization losses. Furthermore, differences in the real and simulated magnetization characteristic may influence the result.
A comparison of the control circuit currents after start of the injec- tion current (t >0 s) also indicates that the inductive coupling in the experiments is weaker than in the simulation. This difference can likely be related to geometry (fringing flux, non-homogeneous flux distribution in the core). While operating points for the core are also different due to the higher control current in the simulation, this should rather counteract the effect than pronounce it.
The control voltage also shows differences in absolute values but similarities in general trends. The initial voltage is higher for the simulation, which is probably due to the absence of parasitic capac- itance between the turns of the windings. The induced voltage from the injection current is also higher in the simulation. Besides para- sitic capacitance, this could also in part result from non-ideal linkage of the windings (e.g. fringing flux).
−1 0 1 0
1 2
Time (ms) iCTRL(kA)
(a) Measurement
−1 0 1 0
1 2
Time (ms) (b) Simulation 0 V 200 V 400 V 600 V 800 V Fig. 8: Control circuit current for different control circuit voltages for different control voltagesuCTRL(t= 0)
−1 0 1
−200 0 200 400
Time (ms) uctrl1(V)
(a) Measurement
−1 0 1
−200 0 200 400
Time (ms) (b) Simulation 0 V 200 V 400 V 600 V 800 V Fig. 9: Voltage across one of the two control circuit windings for different control voltagesuCTRL(t= 0)
While the presented results show differences between measure- ment and simulation, they nonetheless exhibit consistent and pre- dictable trends. This underlines the general suitability of the con- trollable inductor to influence gradients in current injection circuit breakers.
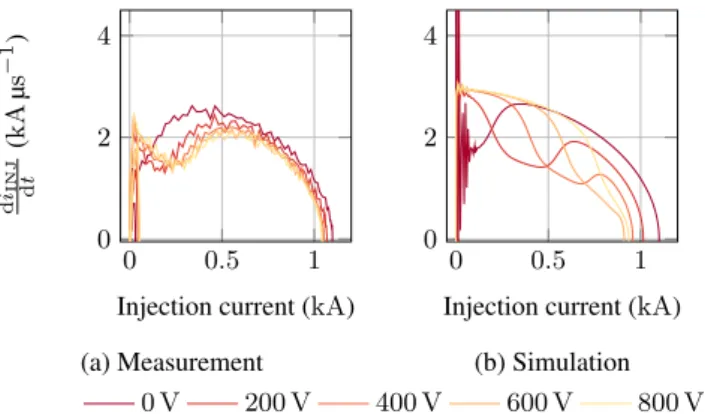
To derive the optimum control strategy for a given fault current, the injection current gradient can be plotted as a function of the injec- tion current produced with different control circuit settings (here pre-charging voltage) as illustrated in Figure 10. The system can then be programmed to set the control currents / pre-charge volt- ages that lead to the lowest current gradient for a given fault current.
To achieve this, it is necessary to predict the fault current level and adjust the control current such that a low current gradient is cre- ated at the anticipated zero crossing. The latter could be realized by replacing the control circuit thyristor with a fully controllable semiconductor switch. This switch can disconnectCCTRL during ramping up of the injection current and initiate freewheeling at the desired current below the maximum.
0 0.5 1 0
2 4
Injection current (kA)
diINJ dt(kAµs−1)
(a) Measurement
0 0.5 1
0 2 4
Injection current (kA) (b) Simulation 0 V 200 V 400 V 600 V 800 V Fig. 10: Rate of rise of current as a function of injection current for different control voltagesuCTRL(t= 0)
5 Controllable Inductors for HVDC Circuit Breakers
In this section, the feasibility to scale a controllable inductor for the use in HVDC circuit breakers is investigated. The characteristic val- ues for the system are listed in Table 3. This table also includes data for a reference current injection topology for comparison with the design of the ContInd. A schematic of the simulated topology is depicted in Figure 11. To reduce the complexity, a two-legged design is chosen. For the control circuit, the same simple and robust design as in the experiments is used.
C
INJS
INJL
INJC
CTRLL
AUXL
CTRLL
ContIndMI SA
S
CTRLFig. 11: Scaled setup for current injection circuit breaker with controllable inductor (two-legged design)
Table 3 System and component values for the reference topology (Ref) and a scaled ContInd topology
Component Value Component Value
Un 320 kV ContInd
I0 2.0 kA LINJ 0 mH
LDC 100 mH CINJ 1.2µF
RFAU 0.1 Ωto150 Ω
Ref Control circuit
LINJ 1.2 mH CCTRL 500µF
CINJ 2µF UC CTRL,0 0 kVto25 kV
Laux 100µH
Figure 12 shows the interruption of a linear rising fault current for different control current levels. For zero control current, the de- saturation region with reduced current gradient is at low injection currents and thus at the beginning of the current injection. With increasing control current, the region can be shifted to higher injec- tion currents and thus close to current zero crossing for the presented example. The width of the de-saturated region depends on current
gradient, geometry of the ContInd and the saturation flux density Bsatof the employed core material.
Table 4 ContInd dimensioning data, based on the material used in experimental investigations (Micrometals Mix-26)
Component Value Component Value
nCTRL 25 nmain 100
Bsat 1.85 Am 246 cm2
µr 75 lmag 58 cm
The stresses on the control circuit are illustrated in Figures 13 and 14. The control current is ramped up approximately2 msbefore injection. For an improved detection of the fault current level that needs to be interrupted, this could also be delayed as the time to peak is only about 300µs. At t= 0 s, the current injection starts and immediately influences the control current. This leads to higher stresses for the control circuit. However, the coupling is non-linear;
as soon as the core is in saturation, the coupling is drastically reduced.
−40 −20 0 20
0 5 10
NCP CCP 0 kV
6 kV 14 kV 25 kV
Time (µs)
Current(kA)
Fig. 12: NCP and CCP current of the ContInd topology as function of time for different control voltages for different pre-charging volt- ages of CCTRL. In this case,UC CTRL= 14 kV produces a low current gradient at the zero crossing.
The voltages that stress the control windings are highest when injection is started. They do not exceed80 kV, which defines the isolation requirements of the winding. For the semiconductors, the maximum charging voltage of the control circuit capacitor defines the voltage withstand requirement, as the circuit is in freewheeling for the rest of the operation.
−2 −1.5 −1 −0.5 0 0.5 0
20 40 60
Time (ms)
Current(kA)
0 kV 6 kV 14 kV 25 kV
Fig. 13: ContInd control current as function of time for different pre-charging voltages ofCCTRL
−2 −1.5 −1 −0.5 0 0.5
−100
−50 0 50
Time (ms)
Voltage(kV)
0 kV 6 kV 14 kV 25 kV
Fig. 14: Control winding (LCTRL) voltage as a function of time for different pre-charging voltages ofCCTRL
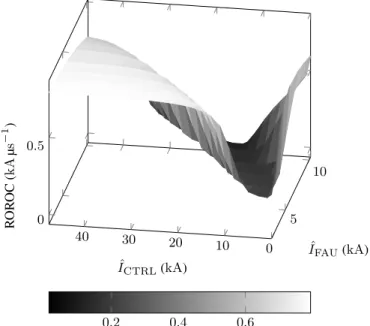
Figures 15, 16 and 17 show current gradient, voltage gradient and , the product of both, as functions of fault and control current.
Voltage and current gradients show a similar behavior. If the de- saturated phase occurs at an injection current that is equal to the fault current, the injection circuit inductance is high when the current in the MI crosses zero. This leads to a low current gradient before zero crossing. After interruption, the remaining charge in the injec- tion capacitor discharges into the MI’s stray capacitance, causing the initial transient interruption voltage. This balancing of charges is limited by the inductance in NCP and CCP. As the controllable inductor is in a de-saturated state, the voltage gradient after zero crossing is reduced. The product of both current and voltage gradient () can be used as a measure for the stresses the MI experiences dur- ing interruption. The figures show that by using the correct control current,can be reduced drastically.
10 0 30 20
40
5 10
0 0.5
IˆCTRL(kA)
IˆFAU(kA) ROROC(kAµs−1 )
0.2 0.4 0.6
Fig. 15: Rate of rise of current as a function of fault and control current
Figure 17 illustrates that a control current in the range between almost zero and approximately20 kAis sufficient to cover the com- plete range of tested fault currents. In the simulated configuration, this can be reached with a maximum charging voltage of approxi- mately11 kV. Consequently, a stack of two series connected devices for both diode and thyristor (SCTRL) would be sufficient.
Regarding the control circuit, a simple design was chosen for sim- ulation as its behavior before the freewheeling does not impact the
10 0 30 20
40 5
10 0
1,000
IˆCTRL(kA)
IˆFAU(kA) ROROV(kVµs−1)
0 200 400 600 800 1,000 1,200
Fig. 16: Rate of rise of ITIV as a function of fault and control current
performance of the ContInd. To facilitate adjusting the control cur- rent to the required level, the illustrated design (cf. Figure 11) can be updated by using a fully controllable semiconductor switch (IGBT, IGCT) forSCTRL. In this case,CCTRLcan always be charged to the maximum required voltage. To set the control current,SCTRL only has to be turned off during the ramp-up of the control current when the required value is reached and force the control circuit into freewheeling.
0 10
20 30
40
4 6 8 10
IˆCTRL(kA)
ˆIFAU(kA)
200 400 600 800 1,000
(MV Aµs−2)
Fig. 17:as a function of fault and control current, no current zero crossings above approximately9.5 kAfor control currents between 10 kAand20 kA
In Figure 18, the interruption stresses for the reference configura- tion (Ref) as well as the controllable inductor are illustrated. For the controllable inductor, examples are depicted for fixed control cur- rents (orange, dotted). Selecting the optimum control current yields the lowest achievable stresses for the MI (orange, solid).
2 4 6 8 10 12 14 0
100 200 300
Prospective current (kA) (MVAµs−2 )
Ref ContInd opt ContInd with fixedIctrl
Limit
Fig. 18: Comparison ofas a function of interrupted current for ref- erence configuration and controllable inductor, dotted lines represent CI with fixed injection current
With the implemented design, the ContInd is able to fulfill the interruption requirements of the MI over the complete range inves- tigated. Stresses for the MI are even lower than for Ref. Compared to the reference configuration, the injection circuit of the ContInd employs a smaller capacitor (60% capacitance at same voltage rat- ing) and no linear inductor. The ContInd additionally requires energy storage to create the control current. In the presented dimensioning, the control circuit capacitor would be equivalent to approximately 11% of additional capacitance at the voltage rating of the injection capacitor based on the stored energy. The control circuit also con- tains a small linear inductor, but due to the lower inductance and voltage rating, it does not add significant cost. The required semi- conductors add some cost. However, due to the moderate voltage rating of the control circuit, this is expected to be minor compared to the injection circuit. Still, an additional control system to determine fault current levels and adjust injection currents is required, which has not been investigated within this thesis. The different compo- nents make it difficult to tell if there is an overall cost advantage and how large this would be. However, the simulations clearly indicate that it is feasible to scale the proposed concept and obtain a better switching performance, which could even come at reduced cost.
6 Conclusion
The key element of current injection circuit breakers for HVDC are mechanical interrupters. Their interruption limits, i.e. rate of rise of current before and rate of rise of voltage after current zero crossing, set a lower boundary for the required capacitance and inductance in the injection circuit. This has a significant influence on the size and cost of the whole topology. Furthermore, the fixed injection cur- rents lead to increasing stresses for interrupting low (fault) currents.
Consequently, improving current injection waveforms is a promising way to improve the performance of current injection topologies.
In this paper, a novel current injection circuit breaker has been introduced. The injection circuit uses a controllable inductor to adap- tively shape the injection current based on the fault current that must be interrupted. It is able to ramp up the injection current quickly and reach a fast current zero crossing by actively saturating the injection circuit inductor. Additionally, it can reduce rate of rise of current before and rate of rise of voltage after current zero crossing in the mechanical interrupter to facilitate successful interruption by de-saturating the injection inductor.
The controllable inductor was investigated using experiments and simulations. In a first step, a scaled-down current injection circuit was built and tested. The obtained data was then compared with a
simulation model to evaluate its accuracy. Differences between mea- surement and simulation have been observed, which are attributed to inaccurate material parameters and simplifications in modelling (skin effect, hysteresis of material not modelled, geometry). How- ever, currents and voltages are still in a comparable range and the general trends of simulation and experiment match.
In a second step, to judge the feasibility of using controllable inductors in HVDC systems, a second simulation study was con- ducted. This study suggests that controllable inductors for this purpose require high, but attainable, control current levels. Core vol- ume and insulation requirements are reasonable. While the economic advantage of such a design is difficult to estimate, the technical advantages motivate further research. This includes implementation of more complex models as well as a determination of the optimum core material. Furthermore, an algorithm to predict and circuitry to adjust the control current based on a measurement of the fault current has to be developed. A suitable design also could reduce stresses at interruption for the MI sufficiently to enable the use of a gas interrupter instead of a series connection of vacuum interrupters.
This would further reduce complexity and enable a more economic design.
Acknowledgment
The work presented in this paper was supported by the Swiss Federal Commission for Innovation and Technology within the SCCER-FURIES.
7 References
1 Bordignan, P., Bathurst, G. ‘Delivery of the Nan’ao multi-terminal VSC- HVDC system’. In: 11th IET International Conference on AC and DC Power Transmission. (, 2015.
2 Wandi, Z., Wei, X., Zhang, S., Tang, G., He, Z., Zheng, J., et al.: ‘Development and test of a 200kV full-bridge based hybrid HVDC breaker’,EPE-ECCE Europe, 2015, pp. 1–7
3 Pang, H., Wei, X. ‘Research on Key Technology and Equipment for Zhangbei 500kV DC Grid’. In: 2018 International Power Electronics Conference. (IEEE, 2018. pp. 2343–2351
4 Franck, C.M., Smeets, R., members A3/B4..34. ‘Technical Requirements and Specifications of State-of-the-Art HVDC Switching Equipment’. (Cigré Technical Brochure 683, 2017.
5 Greenwood, A., Lee, T.: ‘Theory and Application of the Commutation Principle for HVDC Circuit Breakers’,IEEE Trans Power App Sys, 1972,PAS-91, (4), pp. 1570–1574
6 Callavik, M., Blomberg, A.: ‘The Hybrid HVDC Breaker an innovation break- through enabling reliable HVDC grids’,ABB Grid Systems, Technical Paper, 2012, 361, pp. 143–152
7 Grieshaber, W., Dupraz, J., Penache, D.L., Violleau, L.: ‘Development and test of a 120 kv direct current circuit breaker’,Proc CIGRÉ Session, Paris, 2014, pp. 1–11 8 Sima, W., Fu, Z., Yang, M., Yuan, T., Sun, P., Han, X., et al.: ‘A Novel Active Mechanical HVDC Breaker With Consecutive Interruption Capability for Fault Clearances in MMC-HVDC Systems’,IEEE Transactions on Industrial Electronics, 2019,66, (9), pp. 6979–6989
9 Arimatsu, K., Yoshioka, Y., Tokuyama, S., Kato, Y., Hirata, K.: ‘Development and Interrupting Tests on 250KV 8KA HVDC Circuit Breaker’,IEEE Transactions on Power Apparatus and Systems, 1985,PAS-104, (9), pp. 2452–2459
10 Lee, A., Slade, P., Yoon, K., Porter, J., Vithayathil, J.: ‘The Development of a HVDC SF6 Breaker’,IEEE Transactions on Power Apparatus and Systems, 1985, PAS-104, (10), pp. 2721–2729
11 Greenwood, A., Barkan, P., Kracht, W.C.: ‘HVDC Vacuum Circuit Break- ers’,IEEE Transactions on Power Apparatus and Systems, 1972,PAS-91, (4), pp. 1575–1588
12 Damsky, B.L., Imam, I., Premerlani, W. ‘A New HVDC Circuit Breaker System Design For -+ 400 kV’. In: IEEE/PES Transmission and Distribution Conference and Exposition. (IEEE, 1979. pp. 230–236
13 Tahata, K., El Oukaili, S., Kamei, K., Yoshida, D., Kono, Y., Yamamoto, R., et al.
‘HVDC circuit breakers for HVDC grid applications’. In: IET Conference on AC and DC Power Transmission. (Birmingham, UK, 2015. pp. 1–9
14 Yanabu, S., Tamagawa, T., Irokawa, S., Horiuchi, T., Tomimuro, S.: ‘Development of HVDC Circuit Breaker and its Interrupting Test’,IEEE Transactions on Power Apparatus and Systems, 1982,PAS-101, (7), pp. 1958–1965
15 Senda, T., Tamagawa, T., Higuchi, K., Horiuchi, T., Yanabu, S.: ‘Development of HVDC Circuit Breaker Based on Hybrid Interruption Scheme’,IEEE Transactions on Power Apparatus and Systems, 1984,PAS-103, (3), pp. 545–552
16 Belda, N.A., Plet, C.A., Smeets, R.P.P.: ‘Full-Power Test of HVDC Circuit- Breakers with AC Short-Circuit Generators Operated at Low Power Frequency’, , 2018,8977, (c), pp. 1–11
17 Jovcic, D., Tang, G., Pang, H.: ‘Adopting Circuit Breakers for High-Voltage dc Networks: Appropriating the Vast Advantages of dc Transmission Grids’,IEEE Power and Energy Magazine, 2019,17, (3), pp. 82–93
18 Leishi, X., Chao, S., Qifu, L. ‘Research on short-circuit test and simulation of csg first mechanical hvdc circuit breaker in vsc-hvdc’. In: International Conference on Power System Technology. (IEEE, 2018. pp. 2764–2769
19 Schultz, T., Hammerich, B., Bort, L., Franck, C.M.: ‘Improving interruption per- formance of mechanical circuit breakers by controlling pre-current-zero wave shape’,High Voltage, 2019,
20 Schultz, T., Herzog, P., Franck, C.M.: ‘Interruption Limits of Mechanical Circuit Breakers and Circuit Upgrades for Current Injection in HVDC Circuit Breakers’, to be published, 2019,
21 Schultz, T., Herzog, P., Franck, C.M. ‘Current Injection Circuit Breakers for HVDC: Overview on Improved Injection Circuits’. In: accepted at: ICEPE-ST.
(, 2019.
22 Lynn, G.E.: ‘Self-saturating magnetic amplifiers’. (New York: McGraw-Hill, 1960)
23 McLyman, C.: ‘Transformer and Inductor Design Handbook, Fourth Edition’. 4th ed. (CRC Press, 2011)
24 Alexanderson, E.F.W.: ‘Transatlantic radio communication’,Proceedings of the American Institute of Electrical Engineers, 1919,38, (10), pp. 1077–1093 25 Schultz, T., Franck, C.M. ‘Interruption Capability Investigations of a Model Gas
Circuit-Breaker for HVDC Switching Applications’. In: International Conference on Gas Discharges and their Applications. (, 2016. pp. 173–176