Earth and Planetary Science Letters 444 (2016) 13–25
Contents lists available atScienceDirect
Earth and Planetary Science Letters
www.elsevier.com/locate/epsl
The composition of mantle plumes and the deep Earth
Alan R. Hastie
a,∗, J. Godfrey Fitton
b, Andrew C. Kerr
c, Iain McDonald
c, Antje Schwindrofska
d,e, Kaj Hoernle
d,eaSchoolofGeography,EarthandEnvironmentalSciences,UniversityofBirmingham,Edgbaston,BirminghamB152TT,UK1 bSchoolofGeoSciences,UniversityofEdinburgh,King’sBuildings,Edinburgh,EH93JW,UK
cSchoolofEarthandOceanSciences,CardiffUniversity,MainBuilding,ParkPlace,Cardiff,CF103AT,UK dGEOMARHelmholtzCentreforOceanResearchKiel,Wischhofstr.1-3,D-24148Kiel,Germany
eInstituteofGeosciences,Christian-Albrechts-UniversityofKiel,Ludewig-Meyn-Strasse10,24118Kiel,Germany
a r t i c l e i n f o a b s t ra c t
Articlehistory:
Received11January2016
Receivedinrevisedform7March2016 Accepted12March2016
Availableonlinexxxx Editor:B.Marty Keywords:
primarymagma mantleplume
Caribbeanoceanicplateau OntongJavaPlateau
non-chondriticBulkSilicateEarth(BSE) normalisingfactor
DeterminingthecompositionandgeochemicaldiversityofEarth’sdeepmantleandsubsequentascending mantle plumesisvitalso thatwecan betterunderstandhowthe Earth’sprimitivemantle reservoirs initially formed and how they have evolved over the last 4.6 billion years. Further data on the compositionofmantleplumes,whichgeneratevoluminouseruptions ontheplanet’ssurface,are also essential tofully understand the evolution ofthe Earth’s hydrosphere and atmosphere with links to surface environmental changes that may have led to mass extinction events. Here we present new majorandtraceelementandSr–Nd–Pb–Hfisotopedata onbasaltsfromCuracao,partoftheCaribbean largeigneousprovince.Fromtheseandliteraturedata,wecalculatecombinedmajorandtraceelement compositions for the mantle plumes that generated the Caribbean and Ontong Java large igneous provincesandusemassbalancetodeterminethecompositionoftheEarth’slowermantle.Incompatible elementandisotoperesultsindicatethatmantleplumeshavebroadlydistinctivedepletedandenriched compositions that, inaddition tothe numerous mantle reservoirs alreadyproposed in the literature, representlargeplanetary-scalegeochemicalheterogeneityintheEarth’sdeepmantlethataresimilarto non-chondriticBulkSilicateEarthcompositions.
©2016TheAuthors.PublishedbyElsevierB.V.ThisisanopenaccessarticleundertheCCBYlicense (http://creativecommons.org/licenses/by/4.0/).
1. Introduction
The composition and geochemical diversity of Earth’s deep mantle and ascending mantle plumes have been studied for
∼60 years and are still intensely debated (e.g., Ringwood, 1962;
Schilling,1973; HofmannandWhite,1982; Sun,1982; Zindlerand Hart,1986; Hart, 1988;SaltersandZindler,1995;Phipps Morgan andMorgan,1999; SaltersandStracke,2004; Sobolevetal.,2005;
WorkmanandHart,2005; BoyetandCarlson,2006; CaroandBour- don,2010; JacksonandJellinek,2013; Cooganetal.,2014; Hoernle etal.,2015; Trelaetal.,2015).Toidentifythegeochemicalmakeup oftheplanet’s lower silicatemantle isvital tobetter understand how Earth’smantle reservoirs andthose of extra-terrestrialbod- ies,initiallyformed,andevolved,over thelast∼4.6billionyears.
Equally, determining the composition of mantle plumes, which
*
Correspondingauthor.E-mailaddresses:a.r.hastie@bham.ac.uk(A.R. Hastie),godfrey.fitton@ed.ac.uk (J.G. Fitton),KerrA@cardiff.ac.uk(A.C. Kerr),McdonaldI1@cardiff.ac.uk (I. McDonald),khoernle@geomar.de(K. Hoernle).
1 Presentaddress.
generate voluminous eruptions on the planet’s surface, is essen- tialforEarthscientiststofullyunderstandtheevolutionofEarth’s hydrosphere and atmosphere and possible mechanisms for mass extinction events (e.g.,Coffin andEldholm, 1994; Wignall, 2001;
WhiteandSaunders,2005; Campbell,2007; Reichowetal., 2009;
Kerr,1998,2014).
The common practiceof normalising mantle-derived basic ig- neous rocks to chondritic primitive mantle (Bulk Silicate Earth) is useful for highlighting characteristic elemental depletions and enrichments that cannot onlyresolve petrogenetic processesbut canalsohelpelucidatethemechanismsresponsibleforgenerating geochemicallydistinct mantlesource reservoirs.Nevertheless, the existence ofa chondritic primitivemantle reservoir(s) within the modernEarthiscontroversialwithmanystudiessuggestingthatit doesnot,andmayneverhave,existed(e.g.,Hofmann andWhite, 1982; Hart, 1988; Boyet and Carlson, 2006; Caro and Bourdon, 2010; Jacksonetal.,2010; JacksonandJellinek,2013).Saltersand Stracke (2004)andWorkmanandHart (2005)provideseveralcom- positions forthe depleted mid-oceanridge basalt (MORB)source reservoir in the upper mantle that have been used by others to geochemicallymodeltheformationofuppermantle-derivedmag- http://dx.doi.org/10.1016/j.epsl.2016.03.023
0012-821X/©2016TheAuthors.PublishedbyElsevierB.V.ThisisanopenaccessarticleundertheCCBYlicense(http://creativecommons.org/licenses/by/4.0/).
mas. Similarly, determininga moreaccurate composition of deep mantleplume sourceregions wouldmakestudies intothepetro- genesis of mantle plume-derived rocks and intraplate volcanism morerobust(e.g.,FittonandGodard,2004; HastieandKerr,2010;
Loewenetal.,2013; Jacksonetal.,2015).
Thispaperpresentsnewmajorandtraceelement andSr–Nd–
Hf–Pb radiogenicisotope data forprimitiveoceanic plateaulavas from the island of Curaçao, Dutch Antilles, southern Caribbean.
ThenewCuraçaodata willbecompared withthecompositionof samples from the Ontong Java Plateau (OJP) in the western Pa- cific (Fitton andGodard, 2004) to determine the composition of Caribbean oceanicplateau (COP) andOJP primary mantle plume magmas. The aim of this study is to use the COP and OJP pri- mary magmas to calculate the composition of the COP and OJP mantleplume sourceregions. These primary magma andmantle plume reservoir compositions can subsequently be used: (1) to assess the composition of the deep Earth and how the lower mantle may have evolved through geological time, (2) in geo- chemical models to investigate the petrogenesis of modern-day deep mantle-derived rocks and(3) as a new series of normalis- ingfactorsformantleplume andintraplatelavas.Theimportance of presenting new mantle plume primary magma and reservoir compositionsishighlightedincurrentgeochemicaldatabases(e.g., GEOROC: http://georoc.mpch-mainz.gwdg.de/georoc and EARTH- REF: http://earthref.org/GERMRD) that contain standard composi- tions for manyof Earth’s mantle andcrustal reservoirs [e.g.,de- pletedMORBsourcemantle(DMM),HIMU,EnrichedMantle(EM), N-MORB,E-MORB],butnotformantleplume headsthatgenerate largeigneousprovinces,andtheirdeepmantlesourceregions.
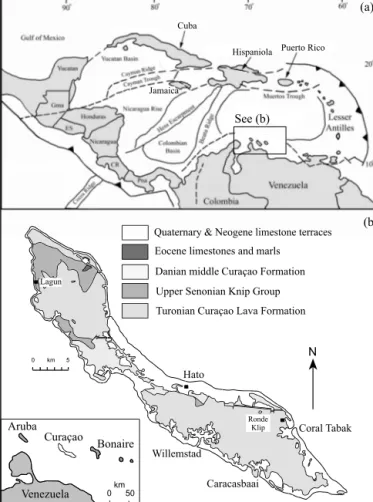
2. Regionalgeologyandsamplecollection
Curaçao is an island in the Netherlands Antilles and is lo- catedinthesouthern CaribbeanSea70kmnorthofthe coastof Venezuela(Fig. 1a). Thegeologyoftheislandwasfirststudiedin detailbyBeets(1972,1977)whoseparatedthestrataintoa≥5 km thick, widespreadlate Cretaceousvolcanic unit (the CuraçaoLava Formation:CLF),whichisoverlainbysedimentaryrocksofthelate Cretaceousandearly Palaeogene(Danian)KnipGroupandMiddle Curaçao Formation respectively (Beets, 1972, 1977; Klaver, 1987;
Kerr et al., 1996) (Fig. 1b). The base of the CLF is not exposed, butthe lower sectionsare madeup of pillowbasaltsand picrite lavaflows(Klaver,1987; Kerretal.,1996).The middleoftheCLF comprisespillowbasaltsanddoleritesillsthatgivewaytobasaltic flows,sills andhyaloclastites intheuppersections (Klaver,1987;
Kerretal.,1996).ThelateCretaceousageandthedetailedstratig- raphy of the CLF are complex in detail andreaders are referred toLoewenetal. (2013)forfurtherinformation.Kerretal. (1996), Hauff etal. (2000a) andLoewen et al. (2013)provide major and traceelementandradiogenicisotopedatatodemonstratethatthe CLFisderivedfromamantleplumesourceregion.
Twentysixpicritesandbasaltswere collectedfromacrossthe CLF asa terrestrial samplingprojectlinked to the2010 research cruise Meteor 81/2AB (IFM-GEOMAR, Germany) (Fig. 1b andAp- pendix A). Major element concentrations of the CLF lavas were determinedusingaJYHoribaUltima2inductivelycoupledplasma optical emission spectrometer (ICP-OES) and the trace elements are analysed by a Thermo X series inductively coupled plasma massspectrometer(ICP-MS)atCardiffUniversity,UnitedKingdom.
Afull description of all theanalytical procedures andequipment atCardiffUniversitycanbefoundinMcDonaldandViljoen (2006).
AllsampledataarepresentedinTablesA1andA2inAppendix A.
Multiple analyses of international reference materials JB-1a and W2wereusedtocorrectinstrumentdriftandensuretheaccuracy andprecisionoftheanalyses (seeTableA3,AppendixA forstan- darddata).Sr–Nd–Hf–Pb radiogenicisotope analyseswerecarried
Fig. 1.(a)MapoftheinterAmericanregionshowingthelocationoftheNetherlands AntillesandtheislandofCuraçao(boxedarea).Gma,Guatemala;ES,ElSalvador;
CR,CostaRica;Pma,Panama.(b)SimplegeologicalmapofCuraçaoshowingthe locationoftheCuraçaoLavaFormation.Exactlocationofsamplescanbefoundin AppendixA.FiguremodifiedfromHastieandKerr (2010).
out on sixsamples [40Ar/39Arages andmajor andtrace element data reportedinLoewen etal. (2013) andTableA1,Appendix A]
atGEOMARHelmholtzCentreforOceanResearchKielbythermal ionisation massspectrometryforSr–Nd–Pband bymulticollector ICP-MSforHf.AllisotopedataarepresentedinTableA4andafull description ofthe analytical procedures andequipment used can befoundinthetablecaption.
3. AssessingelementmobilityintheCuraçaosamples
Previous studies on Caribbean Cretaceous igneous rocks have demonstratedthatmanyofthelargeionlithophileelements(LILE) arevariablymobilisedbylowandhightemperaturealterationpro- cesses (e.g., Hauff et al., 2000a; Hastie et al., 2007, 2008, 2011;
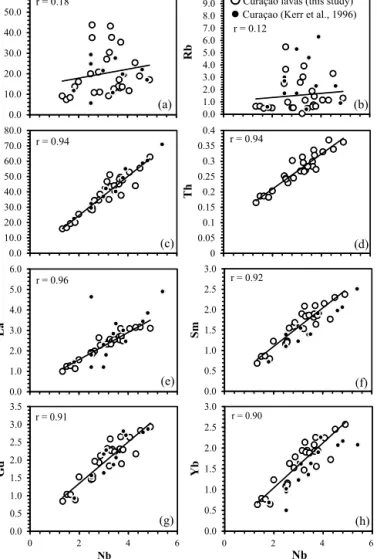
Neill etal., 2010; West etal., 2014). It is thereforeimportant to assesstheinfluenceofelementmobilityonthecompositionofthe Curaçaolavas.Oneofthebestwaysofevaluatingelementmobility uses amethod firstemployed by Cann (1970),wherebya known immobile element is plotted on the abscissa of a variation dia- gram andother elementsareplottedontheordinate.Iftherocks areco-geneticandbothelementsimmobileandmoderately-highly incompatible thedatashouldformalineartrendwithahighcor- relationcoefficient(r).
Figs. 2a and2bshow thatBa andRb displayalarge degreeof scatterwhenplottedagainstNbandhaveverylowrvalues<0.2.
In contrast,dataforZrandThgeneratesingle linear trendswith r=0.94 (Figs. 2cand2d),whicharesimilartoY=0.9,Ta=0.98, Hf=0.94andU=0.94.Additionally,alloftherareearthelements
A.R. Hastie et al. / Earth and Planetary Science Letters 444 (2016) 13–25 15
Fig. 2.(a–h)RepresentativeLILE,HFSEandREEvariationdiagramswithNbonthe abscissashowingthepossiblemobilisationofelementsduringsecondaryalteration oftheCuraçaolavasinthisstudy.PreviousCuraçaosamplesfromKerretal. (1996) arealsoplotted.r=correlation coefficientfornewdataonly.
(REE)form lineartrends withhigh correlation coefficientswhich canbeclearlyseenintheLa,Sm,GdandYbvariationdiagramsin Figs. 2e–h.ThesebivariateplotssuggestthatBaandRb(andother LILE)havebeenmobilisedbylowtemperaturealterationprocesses.
Conversely,Th,U,thehighfieldstrengthelements(HFSE)andthe REEareimmobileandconfirmthepreviousproposalbyKerretal.
(1996)thattheCuraçaolavasareco-genetic.
4. Classificationofnewlycollectedlavas
TheCuraçaolavashavelowSiO2contents≤52wt.%andcanbe broadlyseparated into a subgroup withmoderate MgO contents from7.20–11.31wt.% and a subgroupwithhigh MgO concentra- tionsof22.08–33.59wt.%(TableA1,AppendixA).CombinedNa2O andK2Ocontents are 0.13–3.93 wt.% and0.13–1.39 wt.% for the twosubgroupsrespectively.Ontotalalkalisilica(TAS),Zr/Ti–Nb/Y andTh–Co classification diagramsof Le Bas etal. (1992), Pearce (1996,afterWinchesterandFloyd,1977)andHastieetal. (2007) respectivelythe lavas withmoderate MgOconcentrations plotas tholeiiticbasalts(Fig. 3aandb).ThesubgroupwithhighMgOcon- tentshaveveryhighCoabundances(>75ppm)andplotasbasalts andpicrobasaltsontheTASandZr/Ti–Nb/Ydiagrams(Fig. 3a).The extremelyhighMgOandCosuggeststhattherockshaveaccumu- latedolivine. Rocks that plot in the basalt and picrobasaltfields ontheTAS diagramthathavenospinifextexture, SiO2 <52wt.%,
MgO>12wt.%andlowalkalicontentsareclassifiedaspicrites(Le Bas, 2000; Kerr and Arndt, 2001) while the moderate MgO sub- grouparetholeiiticbasalts(Fig. 3a).
5. Fractionalcrystallisationandolivineaccumulation
Curaçaomajorelementvariationdiagramsshowliquidlinesof descent typicalofbasiclavas. Representative bivariateplotsshow thatasMgOdecreasesSiO2 increasesand,initially,CaOandAl2O3 increase, but decrease at lower MgO contents (Fig. 3c–f). These trendshavebeenexplainedbyolivinefractionalcrystallisationand accumulation at MgO concentrations of >8–10 wt.% andolivine, clinopyroxene and plagioclase fractional crystallisation at lower MgOcontents(Kerretal.,1996; Trelaetal.,2015).Similarly,below
∼8–10wt.% MgO plagioclase and clinopyroxene commonlycrys- tallise together andcause the total Fe content (here reported as Fe2O3) of magmas to increase, which is evident by the negative trendatMgO<10wt.%inFig. 3f.
Problems can occur whencalculating primary magmacompo- sitions for many primitive lavas because it is difficult to accu- ratelycorrectforsubstantialfractionalcrystallisationofclinopyrox- eneand plagioclase(e.g.,Korenaga andKelemen,2000; Herzberg andO’Hara,2002).Therefore,itisadvantageoustodeterminepri- mary magma compositions from primitive lavas that have only crystallised oraccumulatedolivineontheir ascent tothesurface.
PRIMELT3 softwarefromHerzberg andAsimow (2015) isspecifi- cally designedto determine the composition ofprimary magmas from primitive lavas by successive additions or subtractions of equilibriumolivine. We usePRIMELT3 softwarehereon COP and OJPprimitivelavasthathaveonlyfractionatedolivine.Previousre- sults ofusing PRIMELT3are similar to modelling inother recent studies(e.g.,Cooganetal.,2014).
Oceanicplateaulavas,andbasaltsfromother tectonicenviron- ments, commonly fractionally crystallise olivine + plagioclase + clinopyroxeneanditisraretofindprimitivelavasthathavesolely fractionatedolivineonascent(e.g.,Kerretal.,1996; Korenagaand Kelemen, 2000; Fitton andGodard, 2004; Hastie andKerr, 2010;
Loewen et al., 2013). Ofthe 26 lavas fromCuraçao only 4 show compositionalevidence(variationdiagramsinFig. 3andPRIMELT3 computations)forexclusiveolivinefractional crystallisationorac- cumulation. Despite alteration it is still possible to identify the phenocrystphasesinthinsection,evenolivine.Mostsampleslack phenocryst phasesand havean olivine, pyroxene andplagioclase groundmass that has been alteredto severalsecondary minerals (e.g.,clayminerals,chloriteandserpentine).Only25ofthe76OJP samplesin Fitton andGodard (2004) showgeochemical evidence forpredominant olivineremoval during ascent.Thisis confirmed bypetrographicanalysiswherebythe25OJPsamplescontainonly olivinephenocrystsinanaphaniticgroundmassofolivine,clinopy- roxene, plagioclase,Cr-spinel, titanomagnetite andsulphides.Pla- gioclasephenocrystsareoccasionallyseen,butonlycomprise1 modal percent andtherefore do not represent significant plagio- clase fractionation.Fig. 4a is aprimitive mantlenormalised mul- tielement diagramshowingthe composition oftheprimitiveCOP andOJPlavasthathaveonlyfractionatedolivine.
6. DeterminingthecompositionoftheCaribbeanandOntong Javaprimarymagmasandtheirrespectivemantleplumesource regions:methodologiesandresults
6.1. MajorelementcompositionofCOPandOJPprimarymagmas Using primitive lavas from the COP and OJP, the major ele- ment composition of primary magmas from both the Caribbean and Ontong Java large igneous provinces can be calculated us- ing PRIMELT3 software. Full details on the successive develop-
Fig. 3.(a)Totalalkalisilica(TAS)andZr/Ti–Nb/YplotfromLeBasetal.(1992)andPearce (1996)[basedontheoriginaldiagramfromWinchesterandFloyd,1977].(b)Th–Co classificationdiagramofHastieetal. (2007).(c–f)RepresentativemajorelementbivariatediagramsillustratingtheliquidlineofdescentfortheCuraçaolavas.Symbolsasin Fig. 2.
ment ofPRIMELT3 can be found in Herzberg andO’Hara (2002), Herzberg andAsimow (2008) and Herzberg andAsimow (2015).
PRIMELT3 uses inverse and forward models to determine the major element composition ofprimary anhydrous melts. The in- verse model involves calculating the array of possible primary magma compositions from a chosen primitive lava by the suc- cessiveadditionor subtractionofequilibriumolivine in1weight per cent increments. The forward model involves a peridotite sourcewitha knowncomposition andmineralogy beingselected and experimental data and mass balance solutions are used to determinethecompositionsandmeltfractionsofderivative mag- mas at a range of conditions (temperatures, pressures, batch melting, fractional melting, etc.). The “primary magma array” in the inverse model is compared to the results of the forward model in projection (e.g., olivine–anorthite–quartz) and bivari- ate (e.g., FeO–MgO) diagrams. The composition of the soughtaf- terprimarymelt is determined by identifying the composition of the potential primary melt that has the same melt fraction in both bivariate and projection plots. In order to determine the major element composition of the primary magma of a prim- itive lava the software user is required to input (1) the ma- jor element composition of the primitive lava, (2) the estimated Fe2+/Fe ratio and (3) the major element composition of the source peridotite from which the primary magma is to be de- rived.
MajorelementinputparametersintothesoftwareincludeSiO2, TiO2,Al2O3, Cr2O3, FeO(t),MnO, MgO, CaO, Na2O, K2O, NiO and P2O5 inweight percent.With regardsto thenew Curaçaoanaly- ses in thispaper, mostsamples are slightly hydrousdue to sec-
ondary alteration andFe isdetermined asFe2O3(t). Therefore,in orderfortheCuraçao(andOJP)lavastobestudiedusingPRIMELT3 themajorelementshavebeennormalisedtoanhydrousvalues,Ni and Cr trace element contents have been converted to wt.% ox- ideandaddedtothemajorelementsandFe2O3(t)isconvertedto FeO(t).
Modern analyses of both FeO and Fe2O3 in fresh lavas by titration is relatively rare for large igneous provinces, but data in Skovgaard et al. (2001) and models in Herzberg et al. (2007) show andassume respectivelythatoceanicplateaumagmas have Fe2+/Fe of ∼0.9. We therefore use a value of 0.9 in all new COP and OJP computations in this study. The only exception to this is sample 10HK27 (Table A1, Appendix A) which produces a successful PRIMELT3 solution that requires olivine accumula- tion. Because this lava partly comprises cumulateolivine, which would have addedFe2+,we haveallowed PRIMELT3 to calculate theFe2+/Fe contentof10HK27 relativetoaFe2O3/TiO2 ratioof 0.5(seeHerzbergandAsimow,2008formoreinformationonthis methodology).
Previously published major andtrace element and radiogenic isotope concentrationsfortheCOP andOJPlavas(e.g.,Kerretal., 1996; Hauffetal., 1997, 2000a,2000b;Fitton andGodard, 2004;
Hoernle et al., 2004; Hastie et al., 2008; Hastie and Kerr, 2010;
Herzberg etal., 2007; Tejada etal., 2002, 2004) suggest that the mantle plume source regions of the COP and OJP are relatively fertileperidotites. FollowingHerzberg(2004)andHastieandKerr (2010),wetakethemajorelementcomposition ofthefertile(py- rolitic) peridotite KR-4003 (Walter, 1998) to be representative of the COP and OJP mantle plume source regions. The major ele-
A.R.Hastieetal./EarthandPlanetaryScienceLetters444(2016)13–2517
Fig.4.(a)Primitivemantlenormalisedmultielementdiagramsshowingtheimmo-biletraceelementcompositionsof(a)themostprimitive(onlyfractionatedolivine)COPandOJPlavas,(b)COPandOJPprimarymagmaswhenderivedbybatchpartialmeltingand(c)thecompositionoftheCOPandOJPmantleplume(lowermantle)sourceregionsassumingbatchmelting.NormalisingvaluesfromMcDonoughandSun(1995).OJPsamples1183-5and1186-3notincluded.
mentcompositionofKR-4003isusedasapresumedmantleplumesourceanaloguewithwhichtocalculateprimarymagmamajorandtraceelementcompositionsand,subsequently,thetraceel-ementabundancesofmantleplumesources.ThemajorelementcompositionofKR-4003isverysimilartotheestimateforsilicateEarthasproposedbyMcDonoughandSun(1995).Furthermore,bothAllègreetal.(1995)andMcDonough(2001)suggestthatthewholemantlehasarelativelyhomogeneousmajorelementcom-position.COPandOJPprimarymeltcompositionsgeneratedbybothbatchandaccumulatedfractionalmeltingareshowninTable1andTableA4,AppendixA.PRIMELT3computationssuggestthatalloftheprimarymeltsarederivedfromfinalmeltingpressuresaslowas∼0.5–1GPa.Theseshallowdepthsareconsistentwithrela-tivelyhighAl2O3contentsatagivenmeltfractioninthecomputedprimarymagmacompositions(e.g.,HiroseandKushiro,1993;Walter,1998).PRIMELT3alsodetermines(1)theweightper-centolivineaddition/subtractionrequiredtogeneratetheprimarymagmacomposition,(2)theolivineliquidustemperature,(3)themantlepotentialtemperature,(4)theolivinecompositionthatco-
Table 1
StartingoriginalprimitivelavacompositionsandsuccessfulPRIMELT3primarymagmacompositionsfortheCuraçaosamplesrelativetobatchandaccumulatedfractionalmelting(BMandFMrespectively).Ol,wt.%,additionor subtractionofolivinerequiredtogeneratetheprimarymagmacomposition;Tol,olivineliquidustemperature;Tp,mantlepotentialtemperature;Fo,olivinecompositioncoexistingwiththeprimarymagma;F,fractionofpartial meltingrequiredtogeneratetheprimarymagma.
SiO2 TiO2 Al2O3 Cr2O3 Fe2O3 FeO MnO MgO CaO Na2O K2O NiO P2O5 Total Ol wt.%
Tol Tp Kd Fo F
Original primitive lava composition
10HK05 51.997 0.860 13.217 0.070 1.021 8.273 0.163 9.576 11.954 2.726 0.068 0.019 0.056 100 10HK11 49.850 1.007 14.204 0.052 1.131 9.160 0.184 8.240 13.543 2.428 0.126 0.010 0.064 100 10HK18 51.364 0.932 14.167 0.052 1.075 8.709 0.170 8.740 12.262 2.357 0.105 0.011 0.058 100 10HK27 46.309 0.602 9.286 0.289 0.301 9.692 0.173 23.636 8.193 1.321 0.067 0.091 0.039 100 Primary magma composition with BM
10HK05 49.684 0.690 10.550 0.062 0.813 8.571 0.160 17.527 9.579 2.171 0.054 0.092 0.045 100 22.873 1396 1500 0.311 0.921 0.298 10HK11 47.189 0.728 10.190 0.043 0.808 9.500 0.178 19.624 9.768 1.736 0.090 0.099 0.045 100 33.744 1432 1554 0.301 0.924 0.269 10HK18 48.539 0.695 10.489 0.044 0.793 9.065 0.165 19.142 9.123 1.739 0.077 0.085 0.043 100 30.536 1421 1542 0.308 0.924 0.307 10HK27 46.717 0.648 10.005 0.304 0.325 9.941 0.178 21.443 8.823 1.426 0.073 0.075 0.043 100 −7.608 1459 1600 0.299 0.928 0.292 Primary magma composition with FM
10HK05 50.196 0.729 11.157 0.064 0.861 8.597 0.162 15.638 10.123 2.298 0.057 0.070 0.048 100 17.173 1362 1452 0.312 0.912 0.284 10HK11 47.569 0.770 10.802 0.045 0.858 9.603 0.182 17.759 10.349 1.842 0.096 0.078 0.048 100 27.788 1400 1506 0.303 0.916 0.255 10HK18 49.062 0.741 11.201 0.046 0.848 9.146 0.168 17.001 9.735 1.859 0.083 0.064 0.045 100 23.830 1385 1487 0.310 0.914 0.291 10HK27 47.117 0.692 10.692 0.318 0.347 10.117 0.182 19.401 9.424 1.526 0.078 0.060 0.046 100 −14.334 1426 1548 0.302 0.919 0.294
Table 2
PrimarymagmatraceelementcompositionsfortheCOPwithregardstobatchmelting.TheD-valuesusedtocalculatetheprimarymagmasarediscussedinAppendixA.
Traceelementsinppm.Nickelvaluesarecalculatedusingequation(4).
Original composition Primary magma composition with batch melting
Sample 10HK05 10HK11 10HK18 10HK27 10HK05 10HK11 10HK18 10HK27
F(Xfor 10HK27) 0.771 0.663 0.695 0.076
Sc 44.0 49.0 49.5 32.3 35.1 34.3 36.0 34.6
V 241.0 292.2 274.6 173.1 190.6 201.5 197.6 186.0
Co 44.6 47.5 45.1 79.4 64.5 81.1 73.2 77.3
Ni 144 79 84 715 555 686 654 819
Ga 11.503 15.140 14.122 9.586 8.965 10.198 9.954 10.344
Y 15.710 19.080 17.690 10.800 12.120 12.647 12.293 11.689
Zr 34.613 43.265 38.503 28.610 26.697 28.667 26.747 30.966
Nb 2.810 3.349 2.861 2.484 2.168 2.219 1.988 2.688
La 2.641 2.464 2.275 1.914 2.037 1.633 1.580 2.071
Ce 6.609 6.734 6.144 4.825 5.097 4.462 4.268 5.222
Pr 1.033 1.100 1.000 0.782 0.797 0.729 0.695 0.847
Nd 4.891 5.376 4.929 3.635 3.772 3.562 3.424 3.934
Sm 1.591 1.849 1.684 1.160 1.227 1.225 1.170 1.256
Eu 0.614 0.686 0.650 0.444 0.474 0.454 0.452 0.481
Gd 1.929 2.301 2.124 1.458 1.488 1.525 1.476 1.578
Tb 0.369 0.444 0.424 0.266 0.285 0.294 0.295 0.287
Dy 2.500 3.147 2.900 1.840 1.929 2.085 2.015 1.992
Ho 0.494 0.614 0.558 0.356 0.381 0.407 0.388 0.386
Er 1.501 1.906 1.776 1.068 1.158 1.264 1.235 1.155
Tm 0.252 0.302 0.278 0.175 0.194 0.200 0.194 0.190
Yb 1.525 1.942 1.789 1.081 1.179 1.292 1.247 1.169
Lu 0.228 0.287 0.266 0.164 0.176 0.191 0.185 0.177
Hf 0.962 1.230 1.088 0.794 0.745 0.819 0.760 0.859
Ta 0.200 0.231 0.204 0.151 0.154 0.153 0.142 0.163
Th 0.302 0.271 0.246 0.253 0.233 0.179 0.171 0.273
U 0.080 0.074 0.069 0.063 0.062 0.049 0.048 0.068
existswiththeprimarymagmaand(5)thefractionofpartialmelt- ingneededtogeneratetheprimarymelt(Table 1andTable A4 in AppendixA).The29samplesfromtheCOP andOJPgeneratepri- marymagmaswithhighCaOcontentsatagivenMgOabundance andhave internally consistent major element systematicsto rule out a pyroxenite source region (see Herzbergand Asimow, 2008 formoreinformation).Finally,thesuccessfulCOPandOJPprimary meltscomputedwithPRIMELT3have highSiO2 abundances rela- tive to agiven CaOcontent whichrule out the involvementofa volatile-richperidotitesourceregion(again,seeHerzbergandAsi- mow,2008forfurtherinformationonthisfilter).
6.2. CalculatingthetraceelementcompositionoftheCOPandOJP primarymagmas
PRIMELT3onlycalculatesthemajorelementcompositionofthe primaryCOPandOJPmagmas(Table 1andTable A4,Appendix A).
InordertodeterminethetraceelementconcentrationsoftheCOP andOJPprimary magmaswehavetocorrectforolivinefractional crystallisation or accumulation in the primitive lavas. If we take the results assuming that the primitive lavas are derived from batch meltingwe can use the (Rayleigh)fractional crystallisation equation to add the relevant percentageof olivine back intothe primitivelavatoobtaintheprimary magmacompositions.Allbut one of theCOP andOJP primitivelavas has lost olivine via frac- tionalcrystallisationandtheequationusedtocorrectforthisis:
C0
=
ClF(Dol−1) (1)
whereC0istheinitialconcentrationofanelementpriortoolivine fractionation(theprimary magmacomposition),Cl istheconcen- tration ofthe element inthe primitivelavain question, F isthe proportionofmeltremainingandDolisthepartitioncoefficientof fractionatingolivine(seeAppendixAforinformationonthechoice of Dol values). F valuesarederived fromthePRIMELT3 computa- tions. Sample 10HK27 is different as it has accumulated olivine and,assuch,asetmassfractionofolivinehastoberemovedfrom
theprimitivelavatogivetheprimarymagmacomposition.Wecal- culatetheremovalusingthemassbalanceequation:
C0
=
Cl− (
X Col)
1
−
X (2)where definitions are as before except X is the mass fractionof olivine that hasaccumulated in10HK27 (Table 2) andCol is the concentration in the olivine being removed that we estimate by usingtheequation:
Col
=
DolCl (3)CorrectingNiOforolivinefractionationoraccumulationisdifficult because theNi Dol value isextremelysensitiveto melt composi- tion,temperatureandpressurevariations (e.g.,Trela etal., 2015).
Additionally,HerzbergandAsimow (2015)showthatNiOcontents derived fromPRIMELT3canbe toohighifprimitivelavasare de- rived from mixing of primary magmas with olivine-fractionated derivative melts. Therefore,although theNiO contents inTable 1 and Table A4 are the values originally computed by PRIMELT3, we determine the Ni concentrationsinthe primary magmas and mantle plume source regions by treating Ni as a trace element.
Accordingly we calculate the Ni content of the primary magmas usingtheequation:
Ni ppm
=
21.
6MgO−
0.
32MgO2+
0.
051MgO3 (4) Itisanimportantsteptouseequation(4)(seeHerzbergandAsi- mow, 2015forderivation)because it was foundin thecourse of thisstudythat the PRIMELT3NiOvalues aretoo highinthepri- mary magmas and if not corrected can translate into extremely highNiOvaluesinthemantleplumesourceregionsrelativetoel- ementswithsimilarincompatibilities.The resultsof all ofthese calculations are shownin a repre- sentativeprimitivemantle normaliseddiagram inFig. 4bandthe data can be found in Table 2 andTable A5 in Appendix A to il- lustratethefulltraceelementcontentsoftheCOPandOJPmantle plume-derivedprimarymagmas.
A.R. Hastie et al. / Earth and Planetary Science Letters 444 (2016) 13–25 19
Table 3
CompositionofCOPmantleplume(lowermantle)sourceregionwithregardsto batchmelting. The D-values usedto calculatethe source arediscussed inAp- pendix A.Traceelementsinppm.NickelvaluesaredeterminedusingdatainTable 2 thatarederivedfromequation(4).
Composition of COP source prior to batch melting
Sample 10HK05 10HK11 10HK18 10HK27
F 0.298 0.269 0.307 0.292
Sc 16.7 15.6 17.4 16.3
V 73.1 72.1 77.4 70.3
Co 97.0 116.0 104.2 93.1
Ni 1982 2124 2033 2163
Ga 3.300 3.483 3.744 3.747
Y 3.778 3.576 3.940 3.569
Zr 8.059 7.812 8.312 9.147
Nb 0.648 0.598 0.612 0.786
La 0.608 0.439 0.486 0.605
Ce 1.525 1.203 1.315 1.528
Pr 0.239 0.197 0.214 0.248
Nd 1.134 0.966 1.060 1.157
Sm 0.371 0.334 0.364 0.371
Eu 0.143 0.124 0.140 0.142
Gd 0.456 0.423 0.465 0.474
Tb 0.087 0.082 0.093 0.086
Dy 0.591 0.578 0.635 0.598
Ho 0.119 0.115 0.124 0.118
Er 0.362 0.358 0.397 0.354
Tm 0.062 0.058 0.063 0.059
Yb 0.383 0.383 0.416 0.372
Lu 0.058 0.057 0.062 0.057
Hf 0.232 0.231 0.243 0.262
Ta 0.046 0.041 0.044 0.048
Th 0.070 0.048 0.052 0.080
U 0.018 0.013 0.015 0.020
6.3.CalculatingthetraceelementcompositionoftheCOPandOJP mantleplumesourceregions
ThecalculatedCOPandOJPprimarymagmatraceelementcon- centrationshave been used to determinethe composition of the mantleplumesources. PRIMELT3computesmelt fractions(F)for batch and accumulated fractional melting of a fertile peridotite., HereweusethebatchmeltingequationfromShaw (1970)tocal- culate the composition of the mantle plume sources. The actual meltingprocess in a mantle plume will be somewhere between fractionalandbatch melting,butisunlikely tobeclosetoperfect fractionalmeltingatthemeltfractionsestimatedhere.Inanycase, large-degreefractionalmeltingeffectivelystripstheresidualman- tleofallincompatible elements,andsotheirconcentrationinthe un-meltedmantlesourcecaneasilybecalculatedbymassbalance andwill be equal to ClF. Given that the large degrees of melt- ingestimatedherewillresultinaharzburgiteresidueandthatall incompatibleelementswillhaveDol≈Dopx≈0,theoriginalman- tlesourcecompositioncalculatedbyassumingeitherfractionalor batchmeltingwill bevirtually identical.Ifwe knowthevalue of Fandthemodalproportionofphasesintheresidueaftermelting, itisstraightforwardtocalculatetheun-meltedsourcecomposition bymassbalance.
C0
=
ClF+
Cr(
1−
F)
(5)and
Cr
=
DCl (6)whereC0,Cl andCr arethe concentrationsofan elementin,re- spectively, the un-melted mantle source, the liquid produced by partialmelting,andtheresidualmantle.D isthebulkdistribution coefficient for the residual phases. By combining (5)and (6) we obtain:
C0
=
Cl F+
D(
1−
F)
(7)
which is Shaw’s(1970) modal batch melting equation. The mass balance parameterisation of Herzberg and O’Hara (2002), partial melt experimentsonKR-4003byWalter (1998)andseveralother experimentally derived mineralandmelt modesforvarious peri- dotitestarting compositions(e.g.,GudfinnssonandPresnall, 1996;
Kinzler, 1997; Johnson,1998) show that for∼27–31%melting at 1.5–4.0 GPa there will be ∼75 wt.% olivine and ∼25 wt.% or- thopyroxeneintheresidualmantle.Therefore,Dvalueshavebeen calculatedusingmodalfractionsof0.75olivineand0.25orthopy- roxene(seeAppendixAforthechoiceofD values).
There is no need to use the non-modal melting equations and successively remove phases as melting progresses because, at>25% melting, garnet orspinelandclinopyroxene wouldhave beenexhaustedandtheliquidwouldbe inequilibriumwithonly olivine and orthopyroxene and sit on a cotectic between these phases. Consequently,we donot needtoknow theproportionof phases in the un-melted mantle source, the modal melting pro- portions,ortheD valuesforgarnet,spinelandclinopyroxene.Our calculationsrequireonlythat we knowthemelt fractionandthe proportionofphasesintheresidualmantle.AppendixBisasim- pleexcelspreadsheetthatgivesaworkedexampleandshowsthat Shaw’s(1970)modalandnon-modalmeltingequationsgiveiden- tical results when D is calculated from the residual assemblage.
The computedtrace element composition of COP andOJP source regions are shown in Fig. 4c and Table 3 and Table A6 in Ap- pendix A.
7. Discussion
7.1. Compositionallydifferentmantleplumesandcomparisontoother mantleandcrustalreservoirs
ThecalculationsindicatethattheCOPandOJPprimarymagmas haveidenticalM-HREE,Zr,Hf andY abundances (Fig. 4b,Table 2 and Table A5). Conversely, the most incompatible elements (Th, U, Nb, Ta and the LREE) are more enriched in the COP primary magmas than in the OJP melts. The incompatible trace element- enriched natureof theCOP samplesisreplicated whenthe com- positionsofthesourceregionsarecalculated(Figs.4cand5aand Table 3andTable A6 inAppendix A). Whennormalisedtoprimi- tivemantleboththeCOPandOJPsourceregionsagainhavesimilar M-HREE,Zr,HfandY concentrations.Nevertheless,Figs. 4cand5 demonstratethattheCOPmantleplumesourceregionismoreen- richedinTh,U,Nb,TaandtheLREEthantheOJPmantleplume.
Representative
ε
Nd120 Ma–ε
Hf120 Ma and (206Pb/204Pb)120 Ma– (207Pb/204Pb)120 Ma diagrams are shown in Fig. 5c and d. The Curaçao lavas range from 92–62 Ma (Loewen et al., 2013), but we have corrected the initial Curaçao radiogenic isotopes from thisstudy andthe literature to 120Ma using theaverage calcu- lated source parent/daughter ratios (Table A4) so that they can be compared with the OJP isotopic composition. Although there is considerable overlap between the COP and OJP inε
Hf120 Ma andε
Nd120 Ma, the COP extends to more depleted compositions (Fig. 5c).Incontrast,thereisnooverlapinPbisotopiccomposition ontheuranogenicPbisotopediagramat120MaandtheCOPhas moreenrichedPbisotoperatios(Fig. 5d).MoredepletedNdandHf yet moreenriched Pbisotopic compositionsfor theCOP indicate thattheCOPsourcecannotsimplyberelatedtotheOJPsourceby greater time-integrated incompatible element enrichment of the COP source. In summary, the incompatible element and isotope datashowthatthetwooceanicplateausarederivedfromdistinct sourcematerial,despite similarityinthemajorelementcomposi- tionoftheirsources.Fig. 5andTable 4comparetheCOPandOJPsourceregionswith representative crustal and mantle reservoirs commonly used in
Fig. 5.(a)Primitivemantlenormalisedmultielementdiagram comparingtheaverage COPand OJPmantlesourcecompositionswithrepresentativecrustalandmantle reservoirscommonlyusedinpreviousgeochemicalmodelling.ReferenceabbreviationssameasTable 4.(b)Primitivemantlenormaliseddiagramshowingthelowermantle sourcecompositionsinthisstudyrelativetotherecenttraceelementestimatesfornon-chondriticbulksilicateEarth(BSE)fromJacksonandJellinek (2013)(JJ2013).Primitive mantlenormalisingvaluesfromMcDonoughandSun (1995).OJPsamples1183-5and1186-3notincludedinOJPaverage.(c)εNd120 Ma–εHf120 Madiagramshowingthemore radiogenicCOProcksrelativetotheOJPsamplesbasedonNdisotoperatios.OIBandMORBfieldsfromGeldmacheretal. (2003)andTejadaetal. (2004).DMMandNBSE datafromreferencescitedinTable 4.(b) (206Pb/204Pb)120 Ma–(207Pb/204Pb)120 Maplotshowingthat,comparedtotheOJP,samplesfromtheCOPare,again,moreradiogenic.
MORBfieldandNorthernHemisphereReferenceLinefromHauffetal.(2000a,2000b)andTejadaetal. (2004).COPdataarefromthisstudy,Kerretal. (1996),Hauffetal.
(2000a,2000b),Geldmacheretal. (2003),Thompsonetal. (2003)andHastieetal. (2008).OJPdataarefromTejadaetal. (2004).COPandOJPdataareagecorrectedto 120 Masothattheycanbecomparedtooneanother,butitshouldbenotedthattheCOPisconsideredtobe≤90Ma.
geochemicalmodelling. RelativetotheseveralDMM sourcecom- positionsfromSaltersandStracke (2004) andWorkmanandHart (2005), thenew mantleplume sourcecompositions calculatedin this paper are generally more enriched in all the more incom- patibleelements,whichbecomespronouncedwithelementsmore incompatiblethantheMREE.Relativetochondriticprimitiveman- tle values (Hofmann, 1988 and McDonough andSun, 1995), the mantleplumesource compositionsare slightlydepletedinnearly all the trace elements with the OJP source being more depleted comparedwiththeCOPsource.Anotableexceptiontothisisthat theCOPsourcehasslightlyenrichedNbandTaconcentrationsrel- ative to chondritic primitive mantle. This feature also highlights the factthat, similar to the E-DMM, E-MORB andOIB reservoirs,
both theCOPandOJPmantleplume sourceregions havepositive NbandTaanomalies(Fig. 5aandTable 4).
The exact process by which Nb and Ta become enriched in mantlesourcesrelative toothertraceelements withsimilarcom- patibilities is debated. However, previous hypotheses have ex- plained the relative enrichment as a result of minor amounts of rutile-bearing recycled oceanic crust (eclogite) in the man- tle source region or variable trace element partitioning between phasesinthedeepmantle(e.g.,HofmannandWhite,1982; Fitton etal., 1997; Fitton, 2007; Jacksonetal., 2008; Trelaetal., 2015).
RelativetotheOJPsource,alargeramountofarutile-bearingre- cycled oceaniccrust componentin the source of COP wouldnot only explain the higher Th, U, Nb, Ta and LREE abundances in
![Fig. 3. (a) Total alkali silica (TAS) and Zr/Ti–Nb/Y plot from Le Bas et al. (1992) and Pearce (1996) [based on the original diagram from Winchester and Floyd, 1977]](https://thumb-eu.123doks.com/thumbv2/1library_info/5357104.1683258/4.918.213.686.95.607/total-alkali-silica-pearce-original-diagram-winchester-floyd.webp)


