Contents lists available atScienceDirect
Earth and Planetary Science Letters
www.elsevier.com/locate/epsl
Influence of the Amazon River on the Nd isotope composition of deep water in the western equatorial Atlantic during the
Oligocene–Miocene transition
Joseph A. Stewart
a,b,∗, Marcus Gutjahr
c, Rachael H. James
a, Pallavi Anand
d, Paul A. Wilson
aaNationalOceanographyCentreSouthampton,UniversityofSouthampton,EuropeanWay,Southampton,SO143ZH,UK bNationalInstituteofStandardsandTechnology,HollingsMarineLaboratory,331FortJohnsonRd,Charleston,SC,29412,USA cGEOMARHelmholtzCentreforOceanResearchKiel,Wischhofstraße1-3,D-24148Kiel,Germany
dSchoolofEnvironment,EarthandEcosystemSciences,WaltonHall,TheOpenUniversity,MiltonKeynes,MK76AA,UK
a r t i c l e i n f o a b s t ra c t
Articlehistory:
Received26May2016
Receivedinrevisedform25August2016 Accepted26August2016
Availableonlinexxxx Editor:D.Vance
Keywords:
neodymiumisotopes fishteeth
foraminifera Amazon Oligocene–Miocene ODPSite926
Dissolvedandparticulateneodymium(Nd)aremainlysuppliedtotheoceansviarivers,dust,andrelease frommarinesedimentsalongcontinentalmargins.Thisprocess,togetherwiththeshortoceanicresidence timeofNd,givesrisetopronouncedspatialgradientsinoceanic143Nd/144Ndratios(εNd).However,we do not yet have agood understanding of the extent to whichthe influence of riverinepoint-source Nd supplycanbedistinguishedfromchangesinmixingbetweendifferentwatermassesinthemarine geological record.Thisgapinknowledge isimportant tofillbecausethere isgrowingawareness that majorglobalclimatetransitionsmaybeassociatednotonlywithchangesinlarge-scaleoceanwatermass mixing, butalsowithimportantchangesincontinental hydroclimateandweathering.Herewepresent
εNd data for fossilised fish teeth, planktonic foraminifera, and the Fe–Mn oxyhydroxide and detrital fractions ofsediments recoveredfrom Ocean Drilling Project (ODP) Site 926 onCeara Rise, situated approximately800kmfromthemouthoftheRiverAmazon.OurrecordsspantheMi-1glaciationevent during theOligocene–Miocenetransition (OMT;∼23 Ma).We compare ourεNd recordswithdata for ambient deepAtlanticnorthernand southerncomponent waters toassessthe influenceofparticulate input fromtheAmazonRiver onNd inancientdeep watersatthissite.εNdvalues forallofourfish teeth, foraminifera, and Fe–Mnoxyhydroxide samples are extremely unradiogenic(εNd≈ −15); much lower than the εNd for deep waters of modern or Oligocene–Miocene age from the North Atlantic (εNd≈ −10) and South Atlantic(εNd≈ −8).This finding suggests that partial dissolution of detrital particulate materialfromthe Amazon(εNd≈ −18) strongly influencesthe εNd values ofdeep waters atCearaRiseacrosstheOMT.WeconcludethatterrestriallyderivedinputsofNdcanaffectεNd values ofdeepwatermanyhundredsofkilometresfromsource.Ourresultsbothunderscoretheneedforcare inreconstructingchangesinlarge-scaleoceanicwater-massmixingusingsitesproximaltomajorrivers, andhighlightthepotentialofthesemarinearchivesfortracingchangesincontinentalhydroclimateand weathering.
©2016TheAuthors.PublishedbyElsevierB.V.ThisisanopenaccessarticleundertheCCBYlicense (http://creativecommons.org/licenses/by/4.0/).
1. Introduction
The weatheringand transport of continentalrock substrateis a majorsource ofdissolved neodymiumto theoceans(Goldstein andJacobsen,1987).Theneodymiumisotopiccomposition(
ε
Nd= [(143Ndsample/144Ndsample)/(143NdCHUR/144NdCHUR) − 1] × 104;*
Corresponding author at: National Institute of Standards and Technology, HollingsMarineLaboratory,331FortJohnsonRd,Charleston,SC,29412,USA.E-mailaddress:Joseph.Stewart@noaa.gov(J.A. Stewart).
where CHUR is the chondritic uniform reservoir) of continen- tal rocks varies according to both the Sm/Nd ratio and age of the rock, such that ancient continental crust exhibits very low (unradiogenic)
ε
Nd values (down to −40), whereas younger vol- canic sequences generally have much higher (radiogenic) values (upto +12;GoldsteinandHemming, 2003). Becauseneodymium has a residence time on the order of the mixing time of the ocean(500to2000yr;Piepgras andWasserburg,1987; Tachikawa et al., 2003), deep waters formed in the North Atlantic, which is surrounded by Proterozoic and Archean rocks, are charac- http://dx.doi.org/10.1016/j.epsl.2016.08.0370012-821X/©2016TheAuthors.PublishedbyElsevierB.V.ThisisanopenaccessarticleundertheCCBYlicense(http://creativecommons.org/licenses/by/4.0/).
J.A. Stewart et al. / Earth and Planetary Science Letters 454 (2016) 132–141 133
terised by low
ε
Nd (−13.5; Piepgras and Wasserburg, 1987;LacanandJeandel,2005a).Ontheotherhand,deepwatermasses formedintheSouthern Oceanhavehigher
ε
Nd (between−7 and−9; Piepgras andWasserburg, 1987; Jeandel,1993; Stichel etal., 2012) due to the contribution of young mantle-derived material surrounding the Pacific Ocean that mixes with Atlantic waters in this region. Records of seawater
ε
Nd values recorded in ma- rine sediments have therefore been widely used to identify the sourceoftheoverlyingwatermasses(e.g.ScherandMartin,2004;Piotrowskietal.,2005; Bohmetal.,2015; Langetal.,2016).
Inaddition to the influence ofriverine solute inputs, the iso- topiccompositionofdissolvedNdinseawatercanbemodified by exchangeofNdinriver-bornparticulatematerialwithseawatervia
“boundaryexchange” oncontinentalmargins(Jeandeletal.,2007;
Pearceetal.,2013) andalsoincertaindeepseasettings(Lacanand Jeandel,2005b; Carteretal., 2012; Wilsonetal., 2012; Abbottet al.,2015b).Variousmodellingstudiesevensuggest thatreleaseof Ndfromcontinentalmarginsisby farthedominantsourceofNd totheoceans(contributingasmuchas90%; Arsouzeetal.,2009;
Rempferetal.,2011).Dissolveddeepwater
ε
Nd atthesecontinen- talmargin locationsislikelya functionofthree variables:(i) the magnitudeoftheNdfluxfromsedimentporefluids,(ii)thediffer- encebetweentheε
Nd value ofthe overlyingwater andthepore fluid,and(iii)theexposuretimetothisbenthicfluxofNd(Abbott etal.,2015a).The Amazon River is the world’s largest river and each year carries5×108 tonsofsuspended sediment (Gibbs, 1967) that is relativelyenriched inNd(∼40ppm;McDaniel etal.,1997) com- paredto seawater (typically <10ppb; Piepgras and Wasserburg, 1987).TheseNd-richAmazonsedimentshavebeenshowntoinflu- encethedissolved
ε
Ndofnear-shoreseawater(e.g.themid-salinity zone of the Amazon Estuary; Rousseau et al., 2015), and have alsobeensuggestedto affectdeep waterε
Nd asfar afieldasthe CaribbeanSea (Osborneetal., 2014).An improvedunderstanding of the extent to which river-born particulate material can influ- encedeepwaterε
Nd is,therefore,criticaltoourunderstandingof Ndcycling in the oceans(Stichelet al., 2012; Kraft et al., 2013;Pearceetal.,2013).Thisisparticularlytrueformajorclimatetran- sitionswhen rockweatheringand theflux ofriverine particulate materialmayvary(Westetal.,2005), centresofprecipitationcan shiftalteringriverdrainagepatterns(Wangetal.,2004),andocean circulationcanchangetheexposuretime ofwatermassestoben- thicsources ofNd(Abbottetal.,2015a).Recordsofpastseawater andassociatedsediment
ε
Ndinrelativeproximitytomajorriverine sourcesofNdsuchastheAmazonRiverarethereforevitaltoun- derstandingNdexchangebetweenparticulateanddissolvedphases incontinentalmarginsettings.1.1.Archivesofseawater
ε
NdFossilised fish teeth recovered from deep sea sediment cores arean idealsubstrateforreconstructing pastchanges in
ε
Nd val- ues of ancient bottom waters. Fish teeth are found throughout theworld’soceansandincorporatethemajorityoftheir Ndpost- mortem (>100ppm Nd),during early diageneticrecrystallization of the biogenic apatite at the sediment-seawater interface. They arethereforeresistant tolatediageneticoverprinting(Martinand Scher,2004).AnalysisofNdassociatedwithauthigenicFe–Mnoxy- hydroxidesinmarinesedimentscanalsobeusedtoextractbottom waterNdisotopecompositions(Piotrowskietal., 2005), although caremustbetakenduringsampleprocessing(Elmoreetal.,2011).Theonly method by which
ε
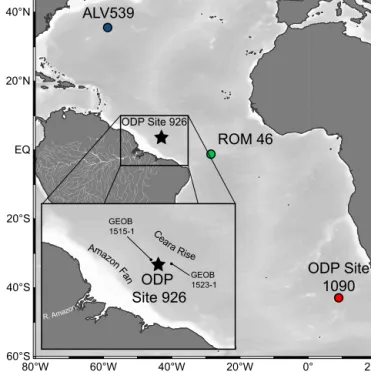
Nd valuesof surface watershave been successfully reconstructed to date is through the analysis of reductively cleaned planktonic foraminifera (Vance and Bur- ton,1999). However, becausediagenetic ferromanganesecoatings formed on the seafloor and in pore waters are extremely en-Fig. 1.LocationofODPLeg154Site926BCearaRiseinrelationtootherdeepwater εNd recordsacrosstheOligocene–Miocene transitiondiscussed inthisstudy.Fe–
MncrustALV539,2,665mwaterdepth(O’Nionsetal.,1998),Fe–MncrustROM46, 3,350mwaterdepth(Frank etal.,2003),FishtoothrecordfromODPSite1090, 3,700mwaterdepth(ScherandMartin,2008).Colourscorrespondtoline/marker coloursinFig. 2.InsetshowslocationofODPSite926BinrelationtotheAma- zonRivermouthandpistoncoresitesonCearaRise,GEOB1515-1(3,129mwater depth)andGEOB1523-1(3,292mwaterdepth)usedinthestudybyLippoldetal.
(2016).
richedinNd(200ppm)comparedwithbiogeniccalcite(0.1ppm), thesecoatings mustbe effectivelyremoved (Pomiès etal., 2002).
ε
Nd recordsofcleanedplanktonicforaminifera thathaveelevated Nd/Ca are likely compromised by incomplete removal (<98%) of ferromanganesecoatingsorreabsorptionofNdreleasedduringthe cleaning process.Forthisreason, evencleanedforaminifera often exhibitε
Nd valuessimilarto bottomwaters(Robertsetal., 2012;Tachikawaetal.,2014).
1.2. Scopeofthisstudy
Hereweassessevidenceforchangesincontinentalinputsfrom theAmazonRiverduringtheOligocene–Miocenetransition(OMT), throughanalysisof
ε
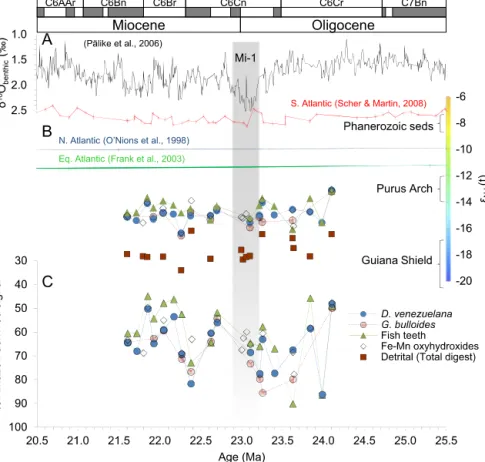
Nd infishteeth,planktonic foraminifera,and the Fe–Mn oxyhydroxide and detrital fractions of sediments re- covered from ODP Site 926 (Fig. 1). The OMT is marked by a positive excursion(>1h) inbenthicforaminiferalδ18O at23Ma (Fig. 2) that represents cooler deep-water temperatures and in- creased Antarctic ice volume associated with the so-called Mi-1 glaciation event(Pälike etal., 2006; Liebrandetal., 2011, 2016).Weuseour
ε
NddatatoassessthecontributionoftheAmazonasa sourceofNdtotheregionalEquatorialAtlanticwatermasssignal atthissiteduring thisintervalofclimatic variability,anddiscuss theimplicationsofthesedataforinterpretationofε
Nd recordsin termsofwatermassmixing.2. Materialsandmethods
2.1. Geologicalsettingandcorechronology
SamplesspanningtheOMTwereselectedfromsediment cores recovered from ODP Leg 154, Site 926, Hole B (3◦43.148N, 42◦54.507W, ∼3600 m water depth; Leg 154 Shipboard Scien- tificParty,1995),situatedapproximately800 km tothenortheast
Fig. 2.εNdrecordsacrosstheOligocene–MiocenetransitionatODPSite926.A.Benthicoxygenisotoperecordforthissite(Pälikeetal.,2006),B.εNdvaluesforfossilised fishteeth(greentriangles),planktonicforaminiferaD.venezuelana(bluecircles)andG.bulloides(redcircles),Fe/Mnoxyhydroxides(blackdiamonds),andthedetritalfraction (squares).DeepwaterεNdvaluesfortheSouthAtlantic(ScherandMartin,2008),EquatorialAtlantic(Franketal.,2003),andNorthAtlantic(O’Nionsetal.,1998) atthe OMTarealsoshownforcomparison.ColourscalecorrespondstothatusedinFig. 3showingpotentialAmazonbasinsourcerockεNdrangesforGuianaShield,PurusArch andPhanerozoicsediments(Allègreetal.,1996).C.EstimatedpercentageofεNdseawatersignalatCearaRisecomingfromAmazonsourcesrelativetonortherncomponent waterduringtheOMT.Errorbarsrepresentthe2standarderrorofeachmeasurement.MagnetostratigraphiccorrelationfromODPSite1090intheSouthAtlantic(Billupset al.,2002; Channelletal.,2003).(Forinterpretationofthereferencestocolourinthisfigurelegend,thereaderisreferredtothewebversionofthisarticle.)
ofthe mouthof the River Amazon(Fig. 1). Thegeographic posi- tion and water-depth of Site 926 have not changed significantly since the Oligocene. Although there is no magnetostratigraphic age control available for ODP Leg 154 cores, a high quality or- bitalchronology isavailable for theOligocene–Miocene sequence atODPSite926(Pälikeetal.,2006) andcanbecorrelatedtoODP Site 1090 on the Agulhas Ridge (Liebrand et al., 2011) where a highquality magnetostratigraphyis available (Fig. 2; Channell et al.,2003).WeapplytheagemodelofPälikeetal. (2006).
2.2. Samplepreparation
Sedimentsampleswere driedinan oven at50◦C,thengently disaggregatedindeionisedwaterusingashakertableandwashed over a 63μm sieve.Tests (∼1 mg) ofthe planktonic foraminifer Dentoglobigerinavenezuelana were picked from the 355–400 μm sizefraction fortraceelement analysis(see Supplementary Infor- mation) following the morphotype description of Stewart et al.
(2012). Larger samplesof D.venezuelana (∼25mg) anda second species,Globigerinabulloides(∼5mg),werepicked forNdisotope analysis from the >355 μm size fraction. Additionally, fossilised fishteeth(andonefishbonesample)weretakenfor
ε
Nd analysis.Thesesamplesconsistedofanaverageofthreeindividualteeth.
2.2.1. DetritalandauthigenicFe–Mnoxyhydroxideextraction
Dried and ground bulk sediment (∼420–610 mg) was trans- ferred into centrifuge tubes for processing. After an initial wash inMQwaterandcentrifuging, 15mlofa reductivecocktail con- taining0.05M hydroxylaminehydrochloride,15%aceticacid, and
0.01MbufferedEDTAwasaddedfollowingmethodsofBlaseretal.
(2016),with reductivecocktail concentrationsas usedin Gutjahr et al. (2007). Sampleswere centrifuged andthe supernatantwas removedforpurificationofNdfromtheFe–Mnoxyhydroxidefrac- tion.Another25 mlofthereductiveleachingsolutionwas added to remove any remaining Fe–Mn oxyhydroxides (Gutjahr et al., 2007) inordertotargetthepureterrigenoussignalwithoutresid- ualauthigenicNdcontributions.Aftershakingfor24 h,thesuper- natant was discarded followingcentrifuging and the sample was dried. Approximately 50mgofthedried re-homogenisedresidue was first treated withconcentrated HNO3 and 30% H2O2 for ef- fective oxidation of organics. Dried samples were subsequently treatedwithaquaregiapriortopressuredigestioninsteelbombs (190◦C overthree days) ina mixture ofconcentrated HNO3 and HF.Drieddigestedsamplesweretreatedthreetimeswithconcen- trated HNO3 beforeconversion to chloride withHCl andcolumn purificationusingproceduresoutlinedinSection2.2.3.
2.2.2. Foraminiferaandfishtoothcleaningprocedure
Allforaminiferaandfishteethsamplesweresubjecttocleaning priortoanalysisusingestablishedmethods(Rosenthaletal.,1999).
Briefly,adheringclayparticleswereremoved throughrepeatedul- trasonication and rinsing withMQ waterand methanol.Samples were then cleanedtoremove ferromanganese oxidecoatingsand organic matter, and finally leached in weak acid to remove any re-adsorbed ions.Foraminiferal calcite andfish teeth samplesfor isotopicanalysiswere dissolvedin0.075 Mand0.15MHNO3 re- spectively.
J.A. Stewart et al. / Earth and Planetary Science Letters 454 (2016) 132–141 135
Table 1
εNdmeasurementsofdetritalsedimentsandFe/MnoxyhydroxidesfromtheOligocene–MiocenetransitionofODPSite926.AgesarecalculatedusingtheagemodelofPälike etal. (2006).εNd(0)denotesmeasuredεNdvalues,andεNd(t)valueshavebeenadjustedforingrowthof143NdsincetheOligocene(assumption:initial147Sm/144Ndratio 0.1412fordetritalandFe–Mnoxyhydroxidesamples).
ODPSampleIdentification Site,Hole,Core,Section, Half,Int.
Depth (mbsf)
Age (Ma)
Detrital (Total digest) 2SE Fe–Mn oxyhydroxides 2SE
143Nd/144Nd (normalised)
εNd(0) εNd(t) 143Nd/144Nd (normalised)
εNd(0) εNd(t)
926 B 46 4 W 40–50 427.8 21.61 0.511710 −18.10 −17.95 0.06 0.511859 −15.20 −15.04 0.05
926 B 46 6 W 70–80 431.1 21.72
926 B 47 1 W 65–67 433.1 21.80 0.511701 −18.27 −18.12 0.05 0.511831 −15.74 −15.59 0.06
926 B 47 2 W 70–80 434.7 21.85 0.511698 −18.33 −18.17 0.05 0.511909 −14.21 −14.06 0.08
926 B 47 4 W 10–20 437.1 21.93
926 B 47 6 W 42–50 440.4 22.05 0.511700 −18.30 −18.15 0.06 0.511887 −14.64 −14.49 0.06
926 B 48 2 W 72–80 444.4 22.17
926 B 48 4 W 52–60 447.2 22.27 0.511647 −19.34 −19.18 0.05 0.511793 −16.49 −16.33 0.05
926 B 48 6 W 91–100 450.6 22.38
926 B 48 6 W 132–134 450.9 22.39 0.511800 −16.34 −16.19 0.05 0.511917 −14.06 −13.90 0.06
926 B 49 4 W 109–120 457.3 22.62 0.511691 −18.47 −18.31 0.05 0.511860 −15.18 −15.02 0.04
926 B 49 6 W 5–15 459.3 22.70
926 B 50 4 W 102–105 466.9 23.00 0.511725 −17.81 −17.64 0.04 0.511852 −15.32 −15.16 0.05
926 B 50 5 W 5.5–7.5 467.5 23.02 0.511688 −18.52 −18.36 0.05 0.511849 −15.39 −15.23 0.05
926 B 50 5 W 111–114 468.5 23.06 0.511698 −18.34 −18.18 0.05 0.511866 −15.07 −14.90 0.04
926 B 50 6 W 82–92 469.8 23.11 0.511702 −18.27 −18.10 0.04 0.511846 −15.45 −15.29 0.05
926 B 51 2 W 35–45 472.9 23.22
926 B 51 2 W 128–133 473.8 23.26 0.511786 −16.61 −16.45 0.05 0.511917 −14.07 −13.91 0.06
926 B 51 5 W 53–60 477.6 23.40
926 B 52 1 W 94–104 481.5 23.63 0.511771 −16.91 −16.75 0.06 0.511880 −14.79 −14.62 0.06
926 B 52 1 W 141–143 481.9 23.64 0.511733 −17.66 −17.49 0.05 0.511818 −16.00 −15.83 0.05
926 B 52 5 W 29–38 486.8 23.84 0.511700 −18.29 −18.12 0.05 0.511874 −14.90 −14.73 0.05
926 B 53 1 W 35–44 490.6 23.99
926 B 53 3 W 105–114 494.3 24.10 0.511786 −16.62 −16.44 0.04 0.511959 −13.24 −13.07 0.05
2.2.3. SeparationofNdfromthesamplematrix
Nd was separated from the sample matrix using a two-stage chromatographyprocedure.Samplesolutions weredrieddownon ahotplate andthen re-dissolvedin 0.2M HCl. Thissolution was thenloadedonto aTefloncolumncontaining 2.4mlofBio-Rad™
AG50W-X12cationexchangeresin.Matrixelementswereremoved byelutingwith4MHCl.Rareearthelements werethencollected in6MHCl.Therecoveredrareearthfractionwasdrieddown,re- dissolvedin0.18MHCl,andloadedontoasecondcationexchange column containing 0.6 ml of Eichron™ Ln spec resin of particle size50 to 100μm.Residual Sr andapproximately 90% ofthe Ce were first eluted with8 ml of 0.18 M HCl, and the Nd fraction wascollectedbyadditionofafurther7mlof0.18MHCl.Theto- talproceduralblankfromthecolumnswas13pgofNd,whichis typically1%ofthesamplesize.
2.3.Analyticaltechniques
DetailsandresultsofanalysisofNd/CaandMn/Cainforamini- feralcalcite areshownintheSupplementaryInformation.TheNd isotopiccompositionofthefishteethandforaminiferawasdeter- mined by multicollector inductively coupled plasma mass spec- trometry (MC-ICP-MS; ThermoFisher Neptune) at the University of Southampton, and the Nd isotopic composition of the sedi- ment leaches and digests was carried out at GEOMAR in Kiel (MC-ICP-MS; ThermoFisher Neptune Plus), using the method of Vance and Thirwall (2002). Measured 143Nd/144Nd ratios were corrected to a 146Nd/144Nd ratio of 0.7219 to remove mass bias effects (Wombacher and Rehkämper, 2003). The external repro- ducibilityofourNdisotopemeasurements,forNdsolutionsof25 to 50 ppb is better than ±0.16 (n=37) and ±0.11 (n=19)
ε
units(2
σ
) in Southampton and Kiel, respectively. Correcteddata were normalised by adjusting the average 143Nd/144Nd ratio of the JNdi-1 Nd isotope standard measured during that analytical session to the accepted value of 0.512115 (Tanaka et al., 2000).143Nd/144Ndratios(
ε
Nd(0))werecorrectedforpost-depositionalin- growthof143Ndfrom147Sm(ε
Nd(t))usingan initial 147Sm/144Nd ratioof0.1286 forfishteeth(Thomasetal.,2003) and0.1412forforaminifera, detrital andFe–Mnoxyhydroxidesamples(Vance et al.,2004).Thisadjustmentissmallforoursamples(lowering
ε
Nd by <0.17units). All subsequentdiscussion refers tothe adjustedε
Nd(t)values.3. Results
In Fig. 2 we compare our records of
ε
Nd in the detrital frac- tion, Fe–Mnoxyhydroxides (Table 1), fish teeth, andforaminifera (D.venezuelana,andG.bulloides;Table 2) fromODPSite926with the benthic foraminiferal oxygen isotope record from the same site (Fig. 2A; Pälike et al., 2006). We further compare theseε
Nd measurementstorecordsofrepresentativecontemporaneousdeep waterε
Nd (Fig. 1; Fig. 2B) fromtheNorth (Fe–Mn crust ALV539;O’Nionsetal.,1998),South(fishteeth fromODPSite1090;Scher and Martin, 2008), and Equatorial Atlantic Ocean (Fe–Mn crust ROM46; Franketal., 2003). With theexception of the North At- lantic Fe–Mncrust siteALV539 (depth2.7km) the waterdepths (andpalaeodepths)ofallofthesesitesaresimilartothatofCeara Rise(Fig. 1). Despiteitsslightlyshallowerdepth,we assumethat the
ε
Nd ofseawateratSite ALV539istypicalofnorthernsourced deepwatertoCearaRise.MostofourdataforthedetritalfractionfromtheOMTatCeara Rise show distinctly unradiogenic
ε
Nd values with a baseline of around −18ε
units.Foursamples show slightlymoreradiogenic values(around−16.5ε
units)at22.4,23.3,23.6,and24.1Mabut theoccurrenceofthesedatapointsshowsnoclearcorrespondence to structureinthe benthicforaminiferaloxygenisotope stratigra- phyfromthesamesite.ε
Nd values for fish teeth are, on average, −14.5 and all data pointsarelowerthan−13.0ε
units.Theforaminiferalε
Nd records for D.venezuelana andG.bulloides are generallywithin analytical uncertaintyofoneanotherandvarybetween−16.5and−13.2ε
units.CompositionsoftheFe–Mnoxyhydroxidefractionarewithin 0.26
ε
unitsoftheforaminiferalε
Nd values.Furthermore,thepat- ternofchangeseenintheFe–Mnoxyhydroxideandforaminiferalε
Nd recordsisremarkablysimilarto thatofthefish teethrecord.Wethereforefindnodiscernibledifferencebetweenthefishteeth,
J.A.Stewartetal./EarthandPlanetaryScienceLetters454(2016)132–141 Table 2
εNdmeasurementsoffossilisedfishteethandplanktonicforaminifera(D.venezuelanaandG.bulloides)fromtheOligocene–MiocenetransitionofODPSite926.AgesarecalculatedusingtheagemodelofPälikeetal. (2006).εNd(0) denotesmeasuredεNdvalues,andεNd(t)valueshavebeenadjustedforingrowthof143NdsincetheOligocene(assumption:initial147Sm/144Ndratio0.1286forfishteethand0.1412forforaminiferasamples).
ODPSampleIdentification Site,Hole,Core,Section, Half,Int.
Depth (mbsf)
Age (Ma)
Fish teeth 2SE D. venezuelana 2SE G. bulloides 2SE
143Nd/144Nd (normalised)
εNd(0) εNd(t) 143Nd/144Nd (normalised)
εNd(0) εNd(t) 143Nd/144Nd (normalised)
εNd(0) εNd(t)
926 B 46 4 W 40–50 427.8 21.61 0.511869 −15.00 −14.81 0.19 0.511854 −15.28 −15.13 0.22 0.511856 −15.26 −15.11 0.39
926 B 46 6 W 70–80 431.1 21.72 0.511869 −15.00 −14.81 0.18 0.511840 −15.56 −15.41 0.20
926 B 47 1 W 65–67 433.1 21.80
926 B 47 2 W 70–80 434.7 21.85 0.511928 −13.86 −13.67 0.17 0.511907 −14.26 −14.11 0.21
926 B 47 4 W 10–20 437.1 21.93 0.511888 −14.63 −14.44 0.19 0.511846 −15.45 −15.30 0.23 0.511855 −15.27 −15.12 0.46
926 B 47 6 W 42–50 440.4 22.05 0.511916 −14.09 −13.90 0.19 0.511871 −14.96 −14.81 0.20 0.511870 −14.99 −14.83 0.31
926 B 48 2 W 72–80 444.4 22.17 0.511898 −14.43 −14.25 0.18 0.511865 −15.07 −14.92 0.27
926 B 48 4 W 52–60 447.2 22.27 0.511868 −15.02 −14.83 0.19 0.511791 −16.52 −16.36 0.17 0.511782 −16.70 −16.55 0.25
926 B 48 6 W 91–100 450.6 22.38 0.511884 −14.70 −14.51 0.18 0.511858 −15.21 −15.06 0.23 0.511874 −14.90 −14.75 0.24
926 B 48 6 W 132–134 450.9 22.39
926 B 49 4 W 109–120 457.3 22.62 0.511841 −15.56 −15.36 0.18 0.511860 −15.18 −15.03 0.16 0.511844 −15.48 −15.32 0.27
926 B 49 6 W 5–15 459.3 22.70 0.511895 −14.50 −14.31 0.20 0.511878 −14.82 −14.66 0.20 0.511886 −14.67 −14.51 0.19
926 B 50 4 W 102–105 466.9 23.00 926 B 50 5 W 5.5–7.5 467.5 23.02 926 B 50 5 W 111–114 468.5 23.06
926 B 50 6 W 82–92 469.8 23.11 0.511847 −15.43 −15.23 0.26 0.511832 −15.72 −15.56 0.20 0.511813 −16.10 −15.94 0.40
926 B 51 2 W 35–45 472.9 23.22 0.511897 −14.46 −14.26 0.36 0.511861 −15.16 −15.00 0.25 0.511854 −15.30 −15.14 0.43
926 B 51 2 W 128–133 473.8 23.26 0.511924 −13.92 −13.72 0.24 0.511909 −14.23 −14.06 0.22 0.511834 −15.68 −15.52 0.50
926 B 51 5 W 53–60 477.6 23.40 0.511894 −14.52 −14.32 0.20 0.511861 −15.15 −14.99 0.24
926 B 52 1 W 94–104 481.5 23.63 0.511803 −16.29 −16.09 0.16 0.511883 −14.72 −14.56 0.18 0.511841 −15.55 −15.39 0.71
926 B 52 1 W 141–143 481.9 23.64
926 B 52 5 W 29–38 486.8 23.84 0.511924 −13.92 −13.72 0.25 0.511873 −14.92 −14.76 0.21
926 B 53 1 W 35–44 490.6 23.99 0.511830 −15.77 −15.57 0.19 0.511832 −15.72 −15.56 0.24
926 B 53 3 W 105–114 494.3 24.10 0.511953 −13.37 −13.16 0.26 0.511958 −13.27 −13.11 0.21 0.511952 −13.38 −13.21 0.45
J.A. Stewart et al. / Earth and Planetary Science Letters 454 (2016) 132–141 137
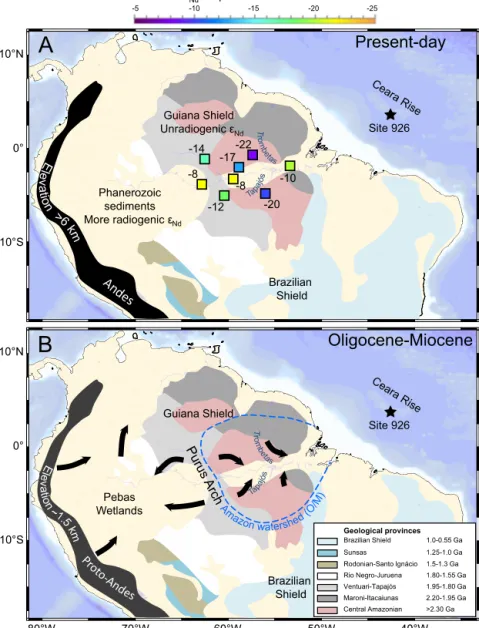
Fig. 3.GeologyoftheAmazonBasin.StarshowsthepositionofODPSite926onCearaRise.PanelA.Colouredsquares(colourscalecorrespondstothatusedinFig. 2) showεNdvaluesofmodernsuspendedsedimentsinAmazontributaries(Allègreetal.,1996).Shadedregionsshowbasementlithology.PanelB.Amazondrainageduring theOligocene–Miocene.Blackarrows andbluedashed lineshow,respectively,the inferreddrainagepattern and catchmentareaat thistime (Figueiredo etal., 2009;
Shephardetal.,2010).(Forinterpretationofthereferencestocolourinthisfigurelegend,thereaderisreferredtothewebversionofthisarticle.)
foraminifera, and Fe–Mn oxyhydroxide
ε
Nd records, even during the large oxygen isotope excursion corresponding to the Mi-1 glaciationevent.4. Discussion
Toassessthepotentialinfluenceofinputofriverineparticulate materialfrom theAmazon to CearaRise, we firstdiscuss theNd isotopecomposition ofthe detrital fractionofthe sediments.We then assess the impact of the Amazon on the Nd isotopic com- positionofseawaterinthe westernequatorialAtlantic acrossthe OMTbycomparingNdisotopecompositionsinthethreedifferent palaeo-seawatersubstrates.
4.1.SourceofdetritalsedimentsatCearaRise
TheNdisotopiccompositionofthedetritalfractionofthesed- iments is used to assess the Nd isotopic signature of terrestrial material from the Amazon River reaching the Ceara Rise during theOMT. SedimentparticlesdeliveredtothemodernAmazonFan fromtheRiverAmazonandits tributariesexhibitawide rangeof
ε
Ndvaluestoday(from−8to−22;Allègreetal.,1996),reflecting thevariableageofthecatchmentbedrock (Fig. 3A). Unradiogenicε
Nd values are observed in the eastern tributaries (Tapajós trib- utaryε
Nd= −20, Trombetas tributaryε
Nd= −22; Allègre et al., 1996),whichdrainancientcratonicsequencesoftheGuianaShield (>2.3 Ga). By contrast, the western tributaries draining younger Phanerozoicsedimentaryrockshavemoreradiogenicsedimentary particulate loads (ε
Nd∼ −8). These eroded sediments from the east and west tributaries combine to give an intermediateε
Ndvalue for the modern Amazon suspended sediment load output tothe AtlanticOcean,whichhas
ε
Nd= −10 (Allègreetal., 1996;McDanieletal.,1997; Rousseau etal., 2015). Theselarge regional distinctionsin
ε
Nd compositionbetweengeological terranesmean that changes in drainage patternshave the potential to give rise todramaticchangesintheε
Nd ofriverinesuspendedsedimentsto theAtlanticOcean.ThedrainageoftheAmazonduringtheOligoceneandMiocene is thought to have been very different from today because of the lower altitude of the Andes (Fig. 3B; Campbell et al., 2006;
Figueiredoetal.,2009; Shephardetal.,2010).Stratigraphicrecords suggest that, prior to the middle-Miocene (Cunha et al., 1994;
Eiras et al., 1994),theAmazonBasinconsistedoftwo catchments dividedby thePurus Arch:theEasternAmazon basinto theeast andthe PebasWetlandstothewest(Figueiredoetal.,2009).Un- derthisconfiguration,theoutflowfromtheAmazontotheAtlantic wouldhaveoriginatedalmostexclusivelyfromtheEasternAmazon Basin, which is underlain by the GuianaShield andtoday yields very unradiogenic
ε
Nd values for suspended loads,between −17 and −22 (Allègre et al., 1996). The lowε
Nd values recorded in thedetrital fraction(−18ε
units) thatwe documentatSite 926, togetherwithcolour,grain-sizeandrareearthelementlogsofsed- iments recovered from other ODP Leg 154 sites (Dobson et al., 2001),allsuggestthattheGuianaShieldwasthedominantsource ofterrigenoussedimenttoCearaRisethroughoutourstudyinter- val.Four samplesin our data set show higher
ε
Nd in the detrital fraction (up to −16.5) and are interpreted to reflect the incor- porationof detrital material frommore radiogenicterranes adja- cent to the ancient Guiana Shield. One possible source of more radiogenic Nd is the westerly Purus Arch (Fig. 3B). Changes in Amazon vegetation cover (e.g. van der Hammen andHooghiem- stra, 2000) anddistribution of precipitation have been linked to globalclimate (Wang etal., 2004), ascentres of tropical precip- itation are often shifted meridionally away fromthe hemisphere ofmaximumcooling(Arbuszewskietal.,2013).Nearlyalldetritalε
Nd values are slightly higher (more radiogenic) before the Mi-1 eventthan they are afterwards,butthere is noobvious relation- shipbetweenourdetritalε
Nd record andthebenthicδ18O record acrosstheOMT(Fig. 2A;Pälikeetal.,2006),evenduringtheMi-1 glaciation. We therefore conclude that changes in the source of Amazonianterrigenoussediment toSite 926during ourstudyin- tervalarenotstronglymodulatedbyprocessescoupledtochanges in highlatitude temperatureand continentalice volume. Onthe other hand, our data indicate that measurement of detritalε
Nd ofmore recent CearaRise sediments(e.g. McDaniel et al., 1997) couldrepresentapowerfultool fordeterminingthedisputedtim- ing ofwestwardenlargementoftheAmazon Basintoits modern configurationduring theMiocene/Pliocene(Campbelletal., 2006;Figueiredoetal.,2009).
4.2. NdinfishteethandfossilisedforaminiferaatCearaRise
Of the data types presented here, those generated using fish teeth are commonly regarded as the most robust archive of changes in oceanic bottom water
ε
Nd because most of the Nd contained in fish tooth fluorapatite is acquired during early di- agenesis on the seafloor (Martin and Haley, 2000; Martin and Scher, 2004). In ourstudy,ε
Nd datafromplanktonic foraminifera are strikingly similar to data fromfish teeth andthe authigenic Fe–Mnoxyhydroxidefraction,despitereductivecleaningthatisex- pectedtoremove authigenicovergrowthsfromtest calcite.While it is possible that theε
Nd value of surface water was identical to theε
Nd value of bottom water during the OMT, high Mn/Ca (>500 μmol/mol) and Nd/Ca (>1 μmol/mol) ratios measured in these foraminifera (see Supplementary Information) imply that the Nd in these samples more likely has an authigenic origin and is not representative of surface water (Pomiès et al., 2002;Tachikawaetal.,2014).
4.3. SourcesofNdtodeepwateratCearaRise
Fishteeth
ε
Nd recordsfromSouthAtlanticODPSites689,Maud Rise(ScherandMartin,2004) and1090,AgulhasRidge(Scherand Martin,2006;Fig. 2B)suggestthat,duringtheOMT,Atlanticdeep waters originating in the Southern Ocean hadε
Nd values close to those of modern southern component water (ε
Nd∼ −8). Un- radiogenicε
Nd valuestypicalofmodernnortherncomponentdeepwater(−13.5;principallyNorthAtlanticDeepWater;Piepgrasand Wasserburg, 1987; Lacan and Jeandel, 2005a) onlyappear in the marine sedimentaryrecord inthelateNeogene,followingclosure of the Central American Seaway (Burton et al., 1997). The
ε
Nd value of northern component deep water in the Miocene is es- timated to have been muchhigher (∼−10; O’Nions et al., 1998;Scher andMartin, 2006) than its present daycomposition. Thus, simple mixing between northern and southern component deep waterscannotexplainthelow
ε
Ndthatwedocumentinfishteeth, planktonicforaminifera,andtheauthigenicFe–Mnfractionofsed- imentsfromSite 926(∼−15ε
Nd units;Fig. 2B).Rather,thedeep watersmustbe affectedbyinput ofveryunradiogenicNdfroma regionalsource,aclearcandidatebeingtheRiverAmazon.Neodymium is exported from rivers to the oceans in three main phases, (i) dissolvedNd (GoldsteinandJacobsen,1987), (ii) pre-formed oxides (Bayonet al., 2004), and (iii)Nd containedin detrital suspended particulate matter (Pearce et al., 2013). Vari- ous lines of evidence point to detrital particulate-bound supply as the major influence on deep water
ε
Nd at Ceara Rise. First, dissolved Ndconcentration inthemodernAmazon Estuaryisob- served to increase in the mid-salinity zone and is accompanied by a shiftinε
Nd fromriverine values (>−9) to valuescloser to the suspended load (<−10) (Rousseau et al., 2015). Therefore, Nd in the dissolved phase of Amazon river waters is extremely susceptible to alteration by Nd released from suspended parti- clesduring estuarinemixing. Second,ifpre-formedFe–Mnoxides were controlling the bottomwater Ndisotope signature atCeara Rise, this should be most clearly identifiable in isotopic differ- ences between fish tooth- and Fe–Mnoxyhydroxide-derivedε
Nd. Insuchascenario,theFe–Mnoxyhydroxideswouldyieldε
Nd val- ues similar to the detrital composition (cf. Bayon et al., 2004;Kraftetal.,2013).Bycontrast,theNdincorporatedintofishteeth is derived frombottom waters or pore fluids (Martin andScher, 2004). Hence, our data indicate that pore fluid andbottom wa- ter
ε
Nd at Ceara Rise differed from that of deep water in the central Atlantic(withε
Nd∼ −10; O’Nions etal.,1998). Themost likely reasonfor thisis partial dissolution ofAmazon particulate material withinCearaRisepore fluids(Lacan andJeandel, 2005a;Carteretal.,2012; Pearceetal.,2013; Abbottetal.,2015a).Once deliveredtoCearaRise,thisparticulate-boundNdistransferredto theoverlying deepwatersthroughdissolutionordesorption, thus shifting the deep water signal regionallytowards lessradiogenic
ε
Nd values. Discovery ofthis signal ata sitemore than 800 km fromtheoutflowsource,in3.6kmwaterdepth,indicatesthatthis processisnotrestrictedtothecontinentalshelvesandcanoperate furtheroffshoreifparticlefluxesarehigh.To assess the percentage contribution of detrital Amazon- derived Ndtodeepwater
ε
Nd atthissitewecomparefish tooth, foraminifera, and Fe–Mn oxyhydroxide data, withε
Nd measure- ments ofthecorresponding detrital fractionandopen oceansea- water. Inthisanalysis, we used the detrital measurementclosest to the sample depth of the fish tooth, foraminifera and leachate datawheredatafromthesamesamplewasnotavailable(wenote that our choice between detrital data from identical or adjacent samplesforcomparisontoestimatesofseawaterε
Nd haslittleim- pact on the main findings of thisstudy). Assuming that theε
Nd value ofnortherncomponentwaterbathingCearaRiseduringthe OMT was −10 (O’Nions et al., 1998), we calculate that the ma- jority of theNd in bottom watersat thissite (average 64%)was derived fromAmazon particulatematerial (Fig. 2C). Although we observe large amplitude variability in ourdown-core record (be- tween45%and90%)thatislikelyrelatedtovariationsinsediment sourcingfromvariousAmazontributaries(Fig. 3),thereisnoclear linkbetweenshort-termincreases/decreasesintheestimatedfrac- tion ofAmazon particulate-derivedNdontheε
Nd signalofCeara Rise bottom water and pronounced changes inhigh latitude cli-J.A. Stewart et al. / Earth and Planetary Science Letters 454 (2016) 132–141 139
mateinferred from benthicforaminiferal δ18O (Fig. 2A; Pälike et al.,2006).
Wenotethat
ε
Nd valuesfordeepwaterofsimilarageandwa- ter depth to our samples derived from a Fe–Mn crust (ROM46) recoveredfromthecentral EquatorialAtlanticOcean arealsorel- ativelyunradiogenic(−11.5;Fig. 2B),andalsocannotthereforebe explainedbysimplemixingbetweennorthernandsouthern com- ponent deepwaters (Frank etal., 2003). Such unradiogenic deep waterε
Nd at the ROM46 site, more than 1,000 km from land, prompted theauthors to invoke additional sources ofNd includ- ingSaharan dust andalsothe AmazonRiver (Franketal., 2003).Our new data from Ceara Rise support a far-reaching Amazon sourcefordeepwaterNdattheROM46siteduringtheOligocene–
Miocene, given that this more distal central Atlantic site yields deepwater
ε
Nd values thatfall betweenthose observedatCeara Riseandcontemporaneousnorthern/southerncomponentwater.4.4.Potentialimpactofregionalterrestrialinputsonseawater
ε
Ndin theNeogeneOceanThe highly unradiogenic
ε
Nd composition of suspended par- ticulate material in the Amazon River during the OMT points to more restricted drainage than in the Amazon Basin today, with the dominant terrestrial input coming from the ancient terrane of the Guiana Shield in the East Amazon Basin. The fingerprint ofthishighlyunradiogenicsediment sourceondeepwaterε
Nd is recognisablefarfromtheAmazon outflowsource,yieldingvalues outsideoftherangedefinedbymixingofnorthern andsouthern componentwatermassesintheAtlantic.Thisresultis consistent withthefindings of Abbottetal. (2015a), who suggestthat sea- waterε
Nd can be strongly affected by inputs ofpore fluid Ndif theε
Nd ofthoseporefluidsissignificantlyoffsetfromthatofthe overlyingwatermass.Inmorerecentgeologicaltimesthefluxand
ε
Ndcompositionof theopendeepEquatorialAtlanticwatermassandAmazonweath- eringsourceshavechanged.First,thesedimentfluxfromtheAma- zonincreasedfromthelateMiocenetothePlioceneinconjunction withAndean uplift (Figueiredo etal., 2009). This uplift has also resultedina larger modernAmazon drainagebasin that nowin- cludes younger Phanerozoic sedimentary rocks (Figueiredo et al., 2009). As theε
Nd ofsuspended sedimentsis strongly influenced bydrainagepattern changesin theheterogeneousAmazon basin, broadeningof the Amazon catchment westwards introduces sus- pendedsedimentswithmoreradiogeniccompositions(ε
Nd∼ −10;Fig. 3A;Allègreetal.,1996; Rousseauetal.,2015).Second,the
ε
Nd compositionofnortherncomponentdeepwaterbecamelessradio- genic,startingatabout4to3 Mainthelate Neogene(Burtonet al.,1997),andisnowapproximately−13.5(Piepgras andWasser- burg,1987). Both ofthese changesare in adirection that makes it more difficult to discern the influence of regional terrestrial sourcesfromchangesinnorthern/southerncomponentwatermass mixingdespitethe higherAmazon sediment fluxes. Forexample, a60% contributionofNdsourced fromthe Amazondetrital sedi- mentstoCearaRisetoday(ε
Nd= −10;Allègreetal.,1996)would beenough toincrease theseawatervalue by 2ε
unitsabovethe modernnortherncomponentwatervalue.Suchachangecouldbe incorrectlyinterpretedtorepresentanincreasedcontributionfrom southernsourceddeepwatersatthissite.Authigenic
ε
Ndrecordsforthelast25thousandyearsfrompis- ton cores GEO B1515-1and GEOB 1523-1 on Ceara Rise (Fig. 1) showamuchmoreradiogenicsignalthanwe measureacrossthe OMT,withvalueschangingfromabout−10atthelastglacialmax- imumtoapproximately−12or−13fortheHolocene(Lippold et al., 2016). ThisPleistocene to Holoceneshift is interpreted to be the result of a change in water mass provenance at Ceara Rise, frompredominantly Atlantic southern component waterto moreunradiogenicnortherncomponentwater(Lippoldetal.,2016).The Holocene Nd isotope compositionsin these cores matchmodern seawater
ε
Nd (Piepgras andWasserburg,1987). Wenote however thatthese(de-)glacialdeepwaterε
Nd valuesare closetomodern Amazonsuspendedsedimentvalues.Therefore,apotentialalterna- tive explanationforthesePleistoceneε
Nd datacould beagreater influence of the benthic sedimentary flux of Nd (∼60% of total Nd)ondeepwateratCearaRiseduringthelastglacialmaximum.Thiscouldbe dueto increasedexposuretime tothebenthicsed- imentary Nd flux (e.g. Abbott et al., 2015a) during this time of more sluggish Atlanticoceanic overturning (Lippold et al., 2016).
Yet because both an increased contribution of southern compo- nentwater,andahigherfluxofbenthic(porefluid)Nd,acttoshift deepwater
ε
Nd towardsmoreradiogenicvalues,theeffectofen- hancedNdreleasefromtheparticulatefractionatthe lastglacial maximumatCearaRisecannot beunambiguouslyresolvedatthis stage.5. Conclusions
We present
ε
Nd records in fossilised fish teeth, planktonic foraminifera andFe–Mnoxyhydroxide substrates fromCearaRise for the Oligocene–Miocene transition. Records from these three substrates are remarkably consistent with one another, implying that allthree archiveshaveacquiredtheε
Nd signatureofbottom waters.Yettheε
Nd datathatwehaveobtainedareextremelyun- radiogenic(downto−15)incomparisontothoseforcontempora- neousbottomwatersintheAtlanticOcean.Theycannottherefore be explained by simplelarge-scale ocean mixing betweennorth- ern andsouthern componentAtlanticdeepwaters,both ofwhich were significantly more radiogenic (ε
Nd of −10 and −8 respec- tively).WesuggestthatbottomwatersatCearaRisewerestrongly influenced by inputs of Nd derived from weathering of ancient cratonic rocks in the eastern Amazon drainage basin. The simi- larity betweenthefishteeth, planktonic foraminifera,andFe–Mn oxyhydroxideNdisotoperecordsprovides evidenceforsignificant releaseofNdfromsedimentaryparticulatematerialfromtheRiver AmazonduringtheOMT.Discoveryofsuchastrongregionalcon- tinental influence on deep waters, manyhundreds of kilometres from source,suggests that boundary exchange processes can op- erate far fromcontinental shelf regions (under highparticle flux conditions). Cautionmust thereforebe exercised insiteselection and when interpreting seawaterε
Nd records in light of the vast distances across which major point sources ofNd may influence deep waterε
Nd.On the other hand,thesetechniques presentan opportunitytoinvestigatechangesinsourcingofriverine-supplied Nd to the ocean associated with major tectonic and/or climatic change.Acknowledgements
This work used samples provided by the (Integrated) Ocean Drilling Program (ODP), which is sponsored by the US National ScienceFoundationandparticipatingcountriesundermanagement of the JointOceanographic Institutions (JOI), Inc. We thank Wal- ter Hale and staff at the Bremen Core Repository for their help in obtaining core material and also Guy Rothwell of BOSCORF for providing core top material for production of our in-house foraminiferalcalcite standards. We thank DieterGarbe-Schönberg (UniversityKiel)andAnaKolevica(GEOMARKiel)fortheirhelpin detritalsampleprocessing.WeareindebtedtoGavinFoster,Carrie Lear,DanMurphy,FredLeMoigne,HelenGriffinandAnyaCrocker fortheir adviceandhelpfuldiscussionofthemanuscript. Wealso thankDerekVanceforassistancewithdeconvolutionofNdisotope dataandMattCooper,DarrylGreenandAndyMiltonfortheirhelp withlaboratorywork. Threeanonymousreviewersandthe editor