Contents lists available atScienceDirect
Earth and Planetary Science Letters
www.elsevier.com/locate/epsl
An intermediate-depth source of hydrothermal 3 He and dissolved iron in the North Pacific
W.J. Jenkins
a,∗, M. Hatta
b, J.N. Fitzsimmons
c, R. Schlitzer
d, N.T. Lanning
c, A. Shiller
e, N.R. Buckley
f, C.R. German
a, D.E. Lott III
a, G. Weiss
b, L. Whitmore
e, K. Casciotti
g, P.J. Lam
h, G.A. Cutter
f, K.L. Cahill
aaWoodsHoleOceanographicInstitution,WoodsHole,MA02543,USA bDepartmentofOceanography,UniversityofHawaiiatManoa,HI96822,USA cDepartmentofOceanography,TexasA&MUniversity,CollegeStation,TX77843,USA dAlfredWegenerInstitute,27568Bremerhaven,Germany
eCenterforTraceAnalysis,UniversityofSouthernMississippi,StennisSpaceCenter,MS39529,USA
fDepartmentofOcean,Earth,andAtmosphericSciences,OldDominionUniversity,Norfolk,VA23529-0276,USA gDepartmentofEarthSystemScience,StanfordUniversity,Stanford,CA94305,USA
hDepartmentofOceanSciences,UniversityofCalifornia,SantaCruz,SantaCruz,CA95064,USA
a r t i c l e i n f o a b s t ra c t
Articlehistory:
Received11December2019
Receivedinrevisedform10March2020 Accepted11March2020
Availableonlinexxxx Editor:L.Robinson
Keywords:
submarinehydrothermalvents seawaterdissolvedironandmanganese heliumisotopes
marineprimaryproductivity NorthPacificcirculation
We observed large water columnanomaliesin heliumisotopes and tracemetalconcentrationsabove the Loihi Seamount. The 3He/4Heofthe addedhelium was 27.3 timesthe atmosphericratio, clearly marking itsorigintoaprimitivemantleplume. Thedissolvedironto3Heratio(dFe:3He)exported to surrounding waters was 9.3±0.3×10⁶. We observed the Loihi 3He and dFe “signal” atadepth of 1100matseveralstationswithin∼100–1000kmofLoihi,whichexhibitedadistaldFe:3Heratioof
∼4×10⁶,abouthalfthe proximalratio.Theseratioswereremarkably similarto thoseobservedover and near the Southern East Pacific Rise (SEPR) despite greatly contrasting geochemicaland volcanic- tectonic origins.In contrast,the proximal and distal dMn:3Heratios wereboth ∼1×10⁶,less than half ofthat observed atthe SEPR. Dissolvedmethanewas minimally enrichedinwaters above Loihi Seamountandwasdistallyabsent.Usinganidealizedregional-scalemodelwereplicatedthehistorically observedregional3Hedistribution,requiringahydrothermal3HesourcefromLoihiof10.4±4.2mol a−1,
∼2%oftheglobal abyssalhydrothermal3Heflux.Fromthiswecomputeacorresponding dFe fluxof
∼40Mmol a−1.GlobalcirculationmodelsimulationssuggestthattheLoihi-influencedwaterseventually upwellalongthewestcoastofNorthAmerica,alsoextendingintotheshallownorthwestPacific,making itapossiblyimportantdeterminantofmarineprimaryproductioninthesubpolarNorthPacific.
©2020ElsevierB.V.Allrightsreserved.
1. Introduction
It has long been recognized that the availability of dissolved iron is a limiting factor for oceanic biological production (Mar- tinand Gordon,1988). Eoliansources of thismicronutrient were regarded asdetermining factors for globalmarine production on glacial-interglacialtimescales (Berger andWefer, 1991). However, theimportance ofhydrothermal iron hasonly recentlybeenrec- ognized(Tagliabueet al., 2010, 2017), and ithas onlynow been
*
Correspondingauthor.E-mailaddress:wjenkins@whoi.edu(W.J. Jenkins).
quantified by the use of hydrothermal 3He as a “flux gauge”
(Resingetal.,2015).AspartoftheInternationalGEOTRACESpro- gram, the U.S. Pacific Meridional Transect along ∼152◦W (GP15) was occupied during the autumn of 2018. We present here re- sultsfromstationsinthevicinityoftheLoihiSeamount(∼18.9◦N, 154.2◦W)showingthe relationshipbetween dissolvediron, man- ganese, methane, and hydrothermal 3He over the seamount and distallyforneighboringstationsnearthe1100minjectiondepth.
We use contemporaneous dissolved Fe, Mn, and 3He measure- ments at nearby stations to unambiguously quantify the helium isotope-metalrelationshipsandfluxes,andtodeterminetheirrole inregionalbiogeochemicalcycles.Thelocationofthestationsthat informthisstudyareshownasredstarsinFig.1,whichisachart https://doi.org/10.1016/j.epsl.2020.116223
0012-821X/©2020ElsevierB.V.Allrightsreserved.
2 W.J. Jenkins et al. / Earth and Planetary Science Letters 539 (2020) 116223
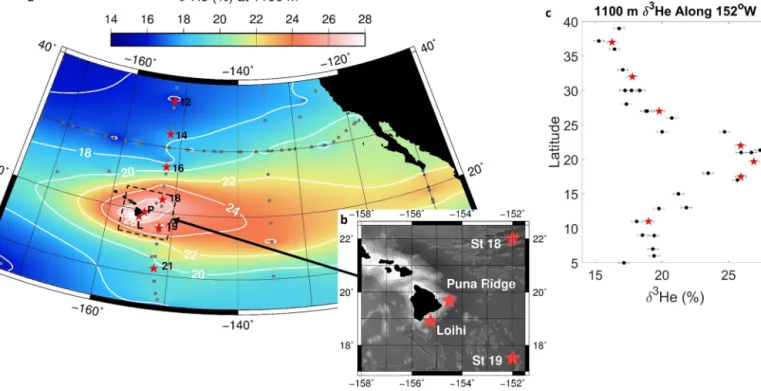
Fig. 1.a,LocationmapoftheGEOTRACESGP15stations(redstars,blacklabels)superimposedonamapofδ3He(in%)interpolatedto1100mdepth.Thisissimilartothat originallypresentedbyLupton(1996).Graydotsindicatehistoricalstationsusedformapping(seeSection1).Otherstationsnearbybutoutsideofthedisplayedareawere alsousedinthemapping.Theδ3Hecontour(whitelines)intervalis2%,orabouttentimessamplemeasurementerrors.b,Insetshowingneighboringstationsclosetothe LoihiSeamount,closetotheIslandofHawaiiwithbottomtopographyingrayscale,contourintervalis1000m,islandsareblackandc,meridionalsectionof1100mdepth δ3He (in%)along∼152◦W.RedstarsarefromtheGP15(2018)sectionandblackdotsarehistoricaldatadatingfrom1985through2015(Jenkinsetal.,2019a).Errorbars represent1standarddeviationuncertaintyduetomeasurementandinterpolationerrors.(Forinterpretationofthecolorsinthefigure(s),thereaderisreferredtotheweb versionofthisarticle.)
of thehelium isotope ratio anomaly (δ3He, defined inEq. (1) in Section 2) interpolated to 1100 m depth in the central to east- ernNorthPacific. Historicaldata(publiclyavailable,Jenkinsetal., 2019a;Lupton, 1998), indicated bygray dots, extendback tothe 1980s and are used to enhance spatial coverage. The contoured δ3He fieldshowsthelargelyeastwardinfluence ofthemid-depth volcanic 3He tongue first described and documented by Lupton (1996).Thelocationofthenearestfourstations,includingthehy- drocast directly over the Loihi Seamount are shown inthe inset (Fig. 1b).The 1100m δ3He signature forstations along ∼152◦W (Fig.1c)showsthatthefeaturehasawell-definedmeridional ex- tentthatithaspersistedformanydecades.
2. Methods
Water samples were taken for helium isotope and noble gas measurements using a 36 place, ∼10 liter Niskin bottle rosette.
The samples were drawn within a few minutes after the bottle was ventedviaTYGONtubing toa 76cmlength of1.6cmouter diameterrefrigerationgradecoppertubingthat wasisolated with pinch clamps and immediately crimp-sealed (Young and Lupton, 1983) for shore-based analysis. The samples were quantitatively gas-extractedandmass-spectrometricallyanalyzedforheliumiso- toperatios andnoblegasabundances referenced toa marine at- mosphericstandard(Jenkinsetal.,2019b).Wereportisotoperatio anomaliesrelativetotheatmosphereaccordingto
δ
3He=
100×
3He
/
4He3 X
He
/
4HeA
−
1% (1)
wherethe subscript X refers to the sample, andA toair. Uncer- tainties depend on a combination of ion-counting statistics and
instrumentstability.Theyrangefrom∼0.15%forsamplescloseto theatmosphericratio,upto∼0.4%forthehighestratiosobserved.
Dissolved helium and neon concentrations were measured us- ing quadrupolemassspectrometricpeak-heightmanometrictech- niques(Jenkinsetal.,2019b;Stanleyetal.,2009)andarereported assaturationanomalies,defined(e.g.,forhelium)as
He
=
100×
C(
He)
CS(
He) −
1% (2)
whereC andCS arethemeasuredandsolubilityconcentrationsof helium (or neon). The solubilityconcentrations are a function of temperature and salinity (Jenkins etal., 2019b). The other noble gases (Ar, Kr,andXe) werealso measuredon thesesamples asa qualitycheck;butarenotreportedhere.Heliumandneonconcen- trations were determined to an accuracy of approximately0.15%.
ForboththeLoihiSeamountandPunaRidgestations,mosthelium isotope and noble gas samples were measured in replicate and average values are reported.In all cases, reproducibilitybetween replicateswasclosetoexpectederrors.Pooledstandarddeviations for δ3He, He,andNe replicateswere 0.22%, 0.29%,and0.28%
respectively,whichrepresentstheconvolutionofallsamplingand analytical errors.It shouldbe mentionedthat the δ3He andHe statistics are impacted (increased) due to the anomalously large hydrothermalsignals.
To determine the isotopic nature of the non-atmospheric he- lium,weaccountforthetwoprimaryatmosphericcomponentsof helium: that portion dissolved during air-sea gas exchange, and thatfractionintroducedbyhydrostaticcompressionofbubblesin- troducedbywaveactionattheseasurface.Theformercanbeac- countedforusingheliumisotopesolubilityfractionationmeasure- ments (Bensonand Krause, 1980) and noble gas solubility func- tions (Jenkins etal.,2019b).The latterisestimatedusingan em-
pirical relationship with near-surface neon saturation anomalies, since neon is similarly affected by air injection processes. The amounts of excess helium isotopes are calculated (Jenkins et al., 2018)using
CX S
4He=
CM 4He−
CS 4He−
0.
22(
CM(
Ne) −
CS(
Ne))
(3) and
CX S
3He=
RA1
+ δ
3He/
100 CM 4He− α
ECS 4He−
0.
22(
CM(
Ne) −
CS(
Ne))
(4)
where the subscripts S and M signify solubility equilibrium andmeasured values respectively, RA is the atmospherichelium (3He/4He)isotope ratio (Clarke etal., 1976), and
α
E is thesolu- bilityhelium isotope effect (Benson andKrause, 1980). They are furthercorrectedfora slight(∼0.2and∼0.3% forHe andNere- spectively) enhancement in saturation anomaly at these depths resultingfromdiapycnalmixingeffects(Jenkinsetal.,2018).FortheLoihi Seamount station,trace metalswere determined shipboardonwaterfromthesameNiskin bottlesusingFIA(Flow InjectionAnalysis) in order to avoidquestions of colocation due toshorttermtimeandspacescalevariabilitybetweenhydrocasts.
Thesampleswerefilteredthrough0.8/0.45 μmPallACROPAK500 capsulesthathadbeenpre-cleanedbysoakingthreedayswith10%
hydrochloricacid(1.2MHCl)andflushedwith3-5LofMilli-Qwa- ter,andstored refrigeratedbetween casts.The capsule filterwas pre-flushedwith0.5-1 Lofunacidifiedseawater.Thefilteredsea- watersamples were acidified to pH 2 using sub-boiling distilled hydrochloric acid. Althoughthe samples were drawn froma non trace-metalcleanNiskin rosette,the Fe andMn valuesare much largerthanmeasuredcontamination levelsforthissystem,asde- duced from contemporaneous comparison with the trace-metal- cleansystemelsewhere.
Due to much lower metal concentrations elsewhere, the U.S.
GEOTRACES trace-metal clean CTD carousel (GTC) was used for trace metal sampling for the other stations. This sampler has a plastic-coated aluminum frame, titanium pressure housings for electronics and sensors, no sacrificial zinc anodes, and 24 ×12 liter General Oceanics GO-FLO bottles modified for trace metal sampling(CutterandBruland, 2012). Before deploymentandim- mediately upon recovery, the tops and bottoms of the GO-FLO bottleswerecoveredwithpolyethyleneshower-caps,andthebot- tleswere removedfromtheframe andcarriedintotheU.S. GEO- TRACESclean container laboratory forsub-sampling. TheGO-FLO bottles were pressurized to 6 psi using 0.2 μm HEPA-filtered compressed air, and samples were passed through 0.2 μm Pall ACROPAK SUPOR filter capsules that had been pre-cleaned by soaking overnight and flushed with 5 L of unacidified seawater.
Samples of the 0.2 μm-filtered seawater were collected follow- ingthreebottlerinsesforshipboardanalyses andforshore-based inductively-coupledplasma massspectrometry (ICP-MS)analyses.
Theshipboardsampleswere drawnintoacidpre-washed125mL polymethylpentene bottlesand immediatelyacidified to 0.006 M hydrochloricacid(HCl)usingsub-boilingdistilledHCl.TheICP-MS samplesweredrawninto250mLlowdensitypolyethylenebottles andacidifiedto0.024MHCl(Optima,Fisher).
Forshipboarddissolvedmetalanalysis,thesamplebottleswere storedinpolyethylenebags inthe darkatroom temperaturebe- foreanalyses, usually within 24 hof collection.Prior to analysis, samplesfordissolved iron (dFe) andmanganese(dMn) were mi- crowavedingroupsof4forthreeminutesat900Wto60±10◦C inanefforttoreleasedFefromcomplexationinthesamples.Sam- pleswere allowed to coolforatleast1 h priorto FIA.Dissolved
Fe andMn were determined subsamples usingmethods of Mea- suresetal.(1995) fordFe andResing andMottl(1992) fordMn.
Sampleswere analyzedingroupsof8,andthesamplescollected ateachstationwere generallyanalyzedtogether during thesame day.Detection limitsandprecisionswere 0.071 nM and1.9% rel- ativestandard deviation at1.4nM for Fe, and0.15nM and9.7%
relative standard deviationat0.51nM forMn. Weconverted FIA results,normallyreportedinnMunits,tonmol kg−1 inthispaper by dividingby the densityofthe seawaterat20◦C andits mea- suredsalinity.
Ironandmanganesewereextractedfromtheseawatersamples forICPMSanalysisandpre-concentrated25xusingaSeaFASTpico- automatedsystem(ElementalScientific),followingisotopespiking with57FeandbufferingtopH∼6.2,usinganoffline-modifiedver- sionofLagerstrometal.(2013),asreportedbyJensenetal.(2020).
ExtractswereanalyzedatmediumresolutiononaThermoElement XRICP-MS.Ironwasquantifiedusingisotopedilution,andMnus- ing matrix-matched standard curves that were set to match the concentrationrangeofthesamples.Allsamplesexceedthedetec- tionlimitsof0.036nmol kg−1 and0.002nmol kg−1 forFeandMn respectively.Externalaccuracywasconfirmedbyreplicateanalyses of the GSC-2 seawater solution, which were found to have con- centrationsof1.631 ± 0.072nmol kg−1 forFe and2.140± 0.129 nmol kg−1 forMn(n=6 each),statisticallyindistinguishablefrom consensus concentrations (1.535± 0.115nmol kg−1 and2.180± 0.075nmol kg−1,respectively).
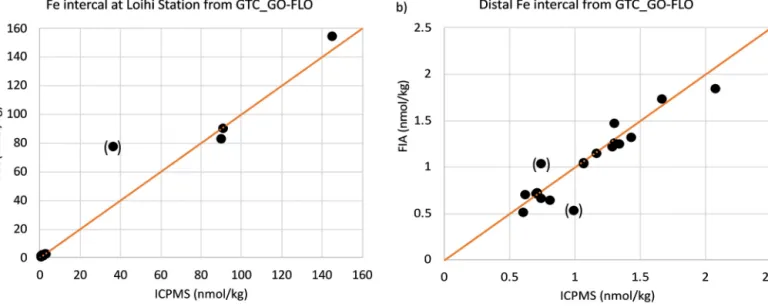
AttheLoihistation,comparisonofFIAandICP-MSresultsshow goodagreement whenboth were sampledfromthe samebottles intheGTCcastandfallona1:1line(Fig.2a)withtheexception of one sample, which may have beencontaminated. Comparison ofFIAandICPMSresultsfortheneighboringstations(Fig.2b)also show goodagreement.However,atLoihi, onlyFIAmetalanalyses were done on the Niskin casts (black symbols/lines) where 3He was also collected. As discussed in Section 3.1, there was a pro- nounced difference in light transmission between the two casts below1200mthatindicatesasignificantdifferenceinhydrother- malinfluenceonthesampledwatersbetweencasts.
Dissolvedmethanewas determinedusingaheadspace equilib- ration-cavityring-down spectroscopymethod(RobertsandShiller, 2015). Samples were collected immediately after the other dis- solved gas samples, equilibrated withmethane-free zero-air, and head-space methane determined using a Picarro G2301 Green- houseGasAnalyzer.Calibration wasperformedusingbothmetha- ne-free zero air and a 5 ppmv CH4 gas standard. Variability of dissolved methaneindeepocean samplesfromthe GP15section suggests a standard deviation of better than 0.06 nmol kg−1 on samplesof ∼0.6 nmol kg−1,similar tothe resultsof Robertsand Shiller(2015).
Wealsocharacterizedhydrothermalinputbydeterminingtotal dissolvedsulfides(TDS)andpH.TDSsampleswerecollectedusing the GTC,filteredthrough thesame 0.2 μmcapsules asthemetal samples,and storedin4 litercubitainers. Filteredwater samples weretransferredtoglassstrippingvessels,acidifiedtoapHof1.6 and analyzed atsea usually within 8 h of collection using cryo- genictrappingandGC/flamephotometricmethod(Radford-Knoery and Cutter, 1993) in duplicate. This method quantifies total dis- solvedsulfideasfreeionsandmetal-sulfidecomplexeswitha0.2 pM detectionlimit.TodeterminepH ateach depth,60mL offil- tered waterwere subsampled fromthe GTC using a syringe and thee-way valve. This water was hermetically transferred into an automated Ocean OpticsUV-VIS spectrophotometric system, pure m-cresol purple added,andabsorbance measured atthree wave- lengths(Carter etal.,2013;ClaytonandByrne,1993).Thesesam- pleswereusuallyanalyzedwithin2hofcollection.
4 W.J. Jenkins et al. / Earth and Planetary Science Letters 539 (2020) 116223
Fig. 2.Inter-calibrationofdissolvedFemeasurementsdrawnfromthesame(GTC)bottlesmadebyshipboardFIA(y-axis)andICPMS(x-axis)forthe(a)theLoihihydrocast andfor(b)neighboring(“distal”)stations(Stations14,16,18,19,21,andPunaRidge).Theorangelineshaveaninterceptofzeroandunitslope.
3. Resultsandmetal-3Heratios 3.1. TheLoihistation
ThestationovertheLoihiSeamountwaslocatedat18◦54’23”N, 155◦15’29”W,withanominaldepthof1300m,directlyabovethe centerofPele’sPit(Clagueetal.,2019),acollapsefeatureresulting froma1996seismic/eruptionsequence(Duennenbieretal.,1997).
The target samplinglocation was within ∼100m ofthree active hydrothermalvents (Tower, Hiolo, andSpillway) to its southeast, and∼300mofashallowervent (Lohiauatabout1150mdepth) tothenorth-northwest(Bennettetal.,2011;Germanetal.,2018).
Measured isotope and element profiles for samples drawn from the Niskin hydrocast are shownin Fig. 3 (a-f), along with prop- erties measured onthe GTC casts(g-j), aswell as thecalculated profilesofexcessheliumisotopes(Fig.3k-l)andtheirisotopicrela- tionship(Fig.3m).Exceptforneonandmethane,allelementsand isotopesfromtheNiskinhydrocastshowthesamestructurebelow 1000m,with maxima∼100m abovethe seafloor andelevated concentrationsextending∼200mabove.TheGTChydrocastmea- surementsexhibitthecontinuedincreaseinsignal totheseafloor (redlines/symbolsinFig.3g-h).Thetrendisalsoseeninthetotal dissolvedsulfide(Fig.3i)andmirroredbythepH(Fig.3j),further reflected inadecrease inlight transmissivitybelow1250 m (not shown).Thedifferencesbetweenthetwohydrocasts,despitepre- cise ship positioning isexpected because a modest5◦ difference inwireanglecanresultina∼100mlateraldisplacementpackage towardoraway fromthethree nearbyactive hydrothermalvents inPele’sPit.
Helium isotope ratio anomalies (Fig. 3a) approaching 400%
were observed, comparable to earlier observations at Loihi (Lup- ton,1996). Correspondingto thismaximumwas a ∼22% peak in heliumsaturation anomalies (Fig. 3b),in contrastto neon,which showedno difference fromother stations. The small Ne excess at1100mislikelyasamplingartifact producingaminisculebias in the helium, further corrected for by the isotope calculations.
Thus,theheliumsupersaturations arenon-atmospheric.LikeLup- ton (1996), we find the isotopic ratio of the Loihi helium to be substantiallyelevatedcomparedtotypicalMidOceanRidge(MOR) sources (27.3 ± 0.3 Ra vs ∼8 Ra where Ra is atmospheric ratio 1.384×10⁻⁶) (Clarke etal., 1976)). Ourresult is slightly higher thanLupton’s(1996) originallyreported23.5Ra.(Wecontendthat Lupton inappropriately includednear-surface watersasendmem- bers,whichflattenstheslopeslightly).Ourratioismoreconsistent
withobservationsofLoihisummitlavas(Kaneokaetal.,1983;Kurz etal.,1983;RisonandCraig,1983),asignatureofprimitiveman- tle volatilesassociatedwiththeleading edgeoftheHawaiianhot spot(Kurzetal.,1982,1983).
The temperature data for this station revealed no detectable thermalsignatureatthedepthsof3Heanomalies,consistentwith the veryhigh3He:heatratiosreportedfortheLoihi seamountby Lupton et al. (1.1 fmol J−1) (1989). This contrasts with ratios at leasttwoordersofmagnitudesmallerformid-oceanridge(MOR) systems (see Elderfield and Schultz, 1996; Lupton et al., 1989).
Thisdifference resultsfromtheprofound geo-tectonicdifferences between amid-plate mantle-plume fueledvolcanoin the shield- buildingstageandMORspreadingcenters.WhileMORhavechar- acteristically shallow magma chambers (∼1 km below seafloor), Loihi’smagmachamberis∼10timesdeeper,providinggreaterop- portunity fordecoupling between primary volatiles like 3He and heat(cf.Hofmannetal.,2011).
High concentrations of dissolved methane are commonly ob- servedinhydrothermalventwatersandappeartobederivedfrom reductionofCO2toCH4underconditionsassociatedwithplutonic rocks andtemperatures of ∼300-400◦C (Wang et al., 2018). For the Loihi profile, the enrichment in CH4 is modest, less than 1 nmol kg−1 relative at similar depths at other stations in the re- gion (∼1 nmol kg−1,Fig. 3f. These values are significantly lower than theroughly 5-15nmol kg−1 reportedbyGamo etal.(1987) priortothe1996seismic/volcaniceventsandthecollapseofPele’s Vents. Incontrast,dissolvedmethanein otherhydrothermalend- membersolutionsareofteninthemicromolartomillimolarrange.
Because theprocesses offormationofhydrothermalmethane are differentfromthegenerationofhydrothermal3HeorFe,wedon’t necessarilyexpectbroadoceaniccorrelationofmethanewiththese other hydrothermal parameters. Nonetheless, the comparison is potentially instructive.Forour two most methane-enriched Loihi samples, we observe xsCH4/CXS(3He) molar ratios of ∼5×10⁴, much smaller than the ∼5×10⁵ ratio reported by Gamo et al.
(1987). Here we define XSCH4 as theamount of methane above values observed at comparable depths away from Loihi. In far greater contrast, Keir (2010) reported xsCH4/3He ratios in mid- ocean ridge hydrothermalsamples thatwere 10-1000-foldhigher than our value. Likewise, the xsCH4/Fe ratios of our two most methane-enriched samples are much lower than xsCH4/Fe ratios observedinmostotherventfluids(e.g.,Charlouetal.,2002).This suggeststhateithertheLoihimethanehadbeenrapidlyconsumed
Fig. 3. Loihiprofilesofa),heliumisotoperatioanomalyδ3Hein%,b),dissolvedheliumsaturationanomalyin%,c),dissolvedneonsaturationanomalyin%,d),dissolved Feinnmol kg−1,e),dissolvedMninnmol kg−1,f),dissolvedCH4innmol kg−1,g)dissolvedFe(ICPMSforGTChdyrocastonly,andFIAforboth),h),dissolvedMn(sameas Fe),i),TDS(pM)fromtheGTCcast,j),pHfromtheGTCcastk),excess3Heinfmol kg−1,l),excess4Heinpmol kg−1,andm),correlationbetweenexcess3Heand4He.The dashedlinerepresentsthebottomdepthatthesamplinglocation.
bymethanotrophsduringtransportanddilutionfromtheventsto our samplinglocation, or that the Loihi systemis nearly devoid ofmethane.Indeed,basalt-hostedventsystemstendtohavelower methaneconcentrationsintheirhydrothermalfluidsthandoultra- mafic hostedsystems (Keir,2010),though their xsCH4/3He ratios stilltendtobe10-100-foldgreaterthanwhatweobserve.
ThemaximumdFe anddMnconcentrationsmeasuredforboth hydrocastsatLoihistation(Fig.3d-eandg-h)wereroughlyhalfof thosereportedearlierby Bennett etal.(2011) forPele’sPit.This couldbeduetospatialvariations(seepreviousdiscussioninmeth- ods), butGerman et al. (2018) have described a gradual, decade time-scaledecreaseinventtemperaturesatLoihi.Nonetheless,the
maximumdFeisabout7timeslargerthanobserveddirectlyover the southern East Pacific Rise (SEPR) (Fitzsimmons et al., 2017;
Resingetal.,2015),whilethedMnisroughlytwofoldsmaller.
The overallslope ofthe“proximal”Fe:3He relationshipwithin Pele’sPitwas 7.4±0.5×10⁶ (Fig.4a),surprisinglysimilarto the SEPR. Since the published SEPR relationship (Resing etal., 2015) was based on preliminary shipboard dFe measurements, we use the average of shore-based ICP-MS measurements within 50 m of the coreof the 3He maximum for the station over the SEPR (Schlitzer et al., 2018) to obtain a revised proximal SEPR Fe:3He ratio of7.6×106, virtually identical to Loihi.This is remarkable since theoveralldFe and3Heconcentrationsatthe twositesare
6 W.J. Jenkins et al. / Earth and Planetary Science Letters 539 (2020) 116223
Fig. 4. TheobservedcorrelationsattheLoihistationbetweenexcess3Heinfmol kg−1anda,dissolvedFeandb,Mn,bothinnmol kg−1,andc-d,molarratioprofilesof dissolvedFe,Mn,andemethaneto3He.Notetheshallowestplumevalues(redstar)whichlikelyrepresentratios“exported”fromthesite.
sodifferent, andtheprocesses leading totheir creationare com- pletely decoupled.Thatis,thedFe enrichmentatLoihi isderived from low-temperature leaching of basalt by hotspot-derived vol- canic carbon dioxide, which drives down the pH of Loihi fluids (Sedwick et al., 1992). In contrast, the dFe enrichment at mid- oceanridge systemssuch asSEPR isdependentonhot (>300◦C) reactions ofacidic fluidswithFe silicates inbasalts (Von Damm, 1985).
The overall Mn:3He relationship (Fig. 4b) is 0.8±0.1×10⁶, morethan twofold smallerthan observed atthe SEPR (Resinget al.,2015).ThedepthprofilesoftheFe:3Heratio,showninFig.4c, ishighest∼100mabovetheplume’score.Incontrast,theMn:3He ratioprofile,showninFig.4d,showsanincrease belowthecore, resemblingmore the CH4:3He ratio profile shown inFig. 4e. Al- thoughdivergenceoftheFe:3Heprofilebelowthecoreofthe3He maximumcouldresultfrominsituscavenging,considerationofthe detailedbathymetry and nearbyvent locationsin relationto the samplingsite(e.g.,seeFig. 1bofBennettetal.,and4bofClagueet al.Bennettetal.,2011;Clagueetal.,2019),suggeststhatthepro- filesarethecompositesignatureofmultiplehydrothermalsources at different locales anddepths in and near Pele’s Pit. Moreover, sincethesilldepthofPele’sPitis∼1100m,themetal:3Heratios thatareexportedtoinfluencesurroundingopenoceanwatersare likelythevaluesatornearthe1100mdepth.Thus,weadoptthe somewhathighervaluesof9.3±0.3×10⁶ and0.93±0.04×10⁶ forthe molar Fe:3He and Mn:3He ratios that escape to feedthe regional-scale“hydrothermaltongue”.
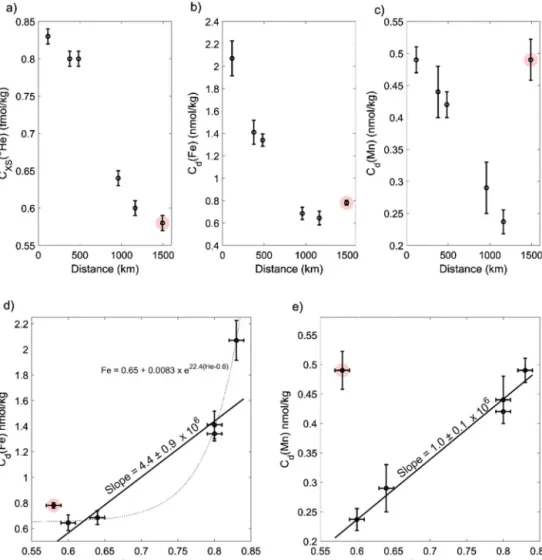
3.2. The“distal”stations
The GEOTRACES GP15 δ3He and dFe profiles (Fig. 5) showed distinctmaximaat1100mdepth forthe stationswithin 500km ofLoihi(18,PunaRidge,and19),whilemoreremote“background”
stations(14, 16,and21),falling outsideof themainLoihi plume
(Fig.1aand1c)donotexhibitdiscernible features.Concentrations of excess3He, dFe,anddMnat allsixstations were interpolated to the 1100m depth, and decrease monotonically with distance fromLoihi(Fig.6a-c),withtheexceptionofstation14wheredFe and dMn appear elevated (and dissolved oxygen more depleted) due tothe influence ofthe NorthPacific oxygen minimum zone.
There, a secondary subsurface maximum ofreduced metalssuch asMn(II)ispresentduetotheirredoxstabilityundersuboxiccon- ditions(Johnsonetal.,1996).
The dissolvedmetal relationshipsto3HeareplottedinFig.6d and 6e. We invoked a linear dFe:3He relation because the data at the critical intermediate concentrations were insufficient in number to distinguish from a non-linear relationship. Included in the plot is an exponential regression (dashed line) that fits the data well, but has only one degree of freedom in the fit.
The linear dFe:3He regressionslope for the fivedistal stations is 4.4±0.9×10⁶, about a factor of two lower than the proximal ratio of 9.3±0.3×10⁶.This decrease in slope iscomparable to that observed over the SEPR (Fitzsimmonsetal., 2017). At Loihi, the proximalrelationship arisesfromnon-conservativedFe losses during plumetransport,whichcouldincludeabioticscavengingof Fe(II) butalsomayincludemicrobialFeutilization, giventherich Fe-oxidizing microbial communities known to exist in Loihi mi- crobial mats (Emerson and Moyer, 2002; Emerson et al., 2007).
The distal dMn:3He relationship (Fig. 6e) of0.9±0.1×10⁶ (ex- cluding Station 14,which is largely unaffected by Loihi)appears equaltotheproximalratio,whichisconsistentwithSEPR(Fitzsim- monsetal.,2017)andearlierstudies(JamesandElderfield,1996) thatdMnbehavesconservativelyinthenon-buoyanthydrothermal plume.
The similarity ofboth proximal and distal dFe:3He ratios be- tweentheLoihiandSEPRisremarkablefortworeasons.First,3He is a primary volatile that is strongly partitioned out of the par- entmagmawhiledFeisaffectedbywater-rockexchange,chemical
Fig. 5. Compositedepthprofilesatthedistalstationsofa,δ3Hein%,b,dissolvedFeinnmol kg−1,c,dissolvedMninnmol kg−1,andd,dissolvedoxygenin μmol kg−1for themoredistantstationsshowninFig.1(notincludingtheLoihistation).Fromnorthtosouththeyarestation14(cyan),16(blue),18(magenta),PunaRidge(red),19 (green),and21(yellow).Notethepronouncedmaximainδ3He,dFe,anddMnat1100mdepthidentifiedinδ3HebyLupton(1996) astheLoihiplumeforthe“nearby”
stations(PunaRidge,18,and19).Also,notetheaberrantbehaviorforthedMn(andtoalesserextentdFe)forstation14.
Fig. 6. Thedistalexcess3He,dissolvediron,andmanganeseconcentrationvariationvs.distancefromLoihifora.excess3Heinfmol kg−1,b.dissolvedFeinnmol kg−1,and c.dissolvedMninnmol kg−1.Correlationwithexcess3Heford.dissolvedFeandfore.dissolvedMn.Errorbars,whichcombineanalyticalandinterpolationuncertainties, are1σforbothvariables.Thesolidlinesarefromtype-IIweightedlinearregressions(excludingstation14,highlightedinpinkforFeandMn).Thedashedlineindisan exponentialfitforcomparison.
8 W.J. Jenkins et al. / Earth and Planetary Science Letters 539 (2020) 116223
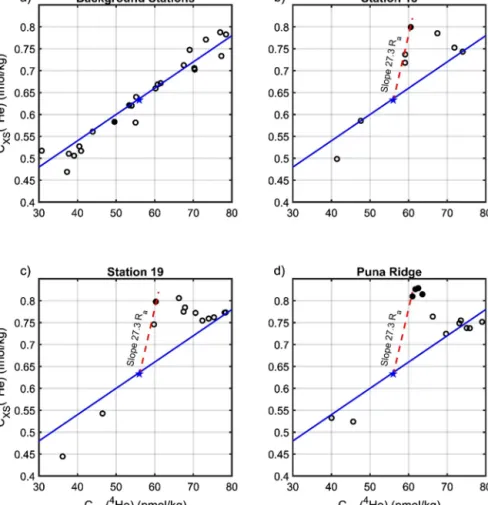
Fig. 7. Themid-depthexcessheliumisotopesrelationshipsforthebackgroundandthreeneareststations.Thefilledcirclescorrespondtosamplescloseto1100mdepth.
aStations14,16,and21areconsidered“background”andtheblueline,whichfallsthroughthesepointsisforreferenceonly.b-dareforthethreecloseststations(18,19, andPunaRidge,seeFig.1a).Thebluestaristheestimatedunperturbed1100mvalueandthereddashedline’sslopecorrespondstotheisotopiccompositionofLoihiplume helium(seeFig.2i).
precipitation,microbial transformation, andthe presence/absence of binding ligands. Thus, given these very different geochemical supply mechanisms to hydrothermal fluids, it is remarkable that Fe and 3He wouldproduce similar ratios in different vents. Sec- ond, Loihi and the SEPR have vastly different geochemical, geo- logical,hydrothermal, andtectoniccharacteristics,making iteven more unlikely that Fe and 3He would have similar ratios. The SEPR is a mid-ocean ridge spreading center with a shallow (∼1 km depth) magma chamber, tholeiitic basalts, andhigh temper- ature hydrothermalvent fluids, while Loihi is a mid-plate, man- tle plume-driven shield-buildingvolcanowitha deeper(∼10km depth)magmachamber,andlowertemperaturehydrothermalvent fluids(Germanetal.,2018;Rouxeletal.,2018).Furthermore,SEPR vents have millimolar concentrations of H2S (Von Damm et al., 2003), which should minimize dFe concentrations dueto precip- itationofironsulfides(Feelyetal.,1996,1987).Weobservedless thannanomolarTDSconcentrationsatLoihiandonlymodestacid- ification,minimizingdFeremoval.
Incontrast toboth Loihi andtheSEPR, recentobservationsin theNorth AtlanticTAGhydrothermalplume showdFe concentra- tions (Fitzsimmons et al., 2015) of ∼60 nmol kg−1 with a cor- responding 3He excess (Jenkins et al., 2015) of ∼0.6 fmol kg−1, leadingtoamolarFe:3Heratiocloseto100×106.Thisisaboutten tofifteentimeshigherthanobservedhereandattheSEPR.Obser- vationsoverthesouthernMid-AtlanticRidgeataround13◦Syield asimilarlyhighvalue of∼70±30×106 accordingto Saitoetal.
(2013).Thus,thereappearstobeagreaterAtlantic-Pacificdispar- ityindFe:3Heratiosthanbetweenmid-oceanridgeandmid-plate
mantle plumeswithin the Pacific.Thisverifies thatthere arenu- merous factors fixing the persistent Fe:3He ratiosupplied to the ocean by any single hydrothermal vent, including tectonic con- text, depth of themagma chamber (and subsequenttemperature atventing),hostrockcomposition,microbialcomposition,andbot- tomwaterconditions(especiallyoxygenation).Thenumericalpre- diction of3He and persistentdFe fluxesfromhydrothermal vent fluidsisacomplextask.Weattempttoquantifythosefluxeshere forLoihiSeamount.
4. Estimatingthehydrothermal3Heflux
Loihi’suniquelyhigh3He/4Hesignatureprovidesanunambigu- ous and quantitative measure of the amount of excess 3He at- tributable to Loihi at each station, as distinct from the regional
“background” ofvolcanicandradiogenichelium emittedby more distant ventsand sediments.InFig. 7 we show therelationships between excess 3He and4He for the more distant “background”
stations (14, 16, and 21 in Fig. 7a) and the three stations near Loihi(18,19,andPunaRidgeinFig.7b-d).Intheneighboringsta- tions,thereisacleardeviationfromthebackgroundslopedefined bythemoredistantstationsthatallowsustoquantitativelysepa- rateouttheLoihicontribution.Inallpanels,theshallowestpoints areontheleft anddeepestpointsontherightofthegraphs.The blue linereferences thebackground trendandthe bluestar rep- resents a “best guess unperturbed” 3HeXS-4HeXS composition for the1100mdepth.Intheotherpanels,thereddashedlinecorre- spondstotheunique3He/4HetrendlineassociatedwiththeLoihi
Fig. 8. Profilesofa)excess4Heinnmol m−3,b)excess3Heinpmol m−3,andc)Loihi-linkedexcess3Heinpmol m−3forsixGP15stations.Thesolidlinesinc)aresmoothing splinefitstoalldataineachprofile.Weonlyintegratedoverthedepthrangeofintegration(900to1300 m).d)Computed3Heinventoriesinpmol m−2forstationsalong
∼152◦Wvs.distancefromLoihi,includingbothGP15andtherecent2015occupationofP16N.
mantleplume signature(27.3Ra),whichdemonstratesconvincing evidence that the 1100 m features (filledcircles) arise from the Loihisource.Thisgivesusaquantitative methodfordefining and integratingthe watercolumnexcess 3Heattributableto theLoihi source.
Fig.8a and8b show theexcessheliumisotopeprofilesforthe GP15stations, calculatedusingequations (3) and(4), andFig. 8c showsthe Loihi-sourced 3He profile as estimatedby subtracting theaverageof“background” stationprofilesbetween5and10◦N (station21) andbetween30 and35◦N(stations 14and16). The heliumisotopeprofilesnearestLoihiexhibit asignificant3Hesig- nature between 900 and 1300 m depth with a maximum near 1100 m.Thelargeverticalspreadmaybedueinparttothetopo- graphicdistributionofthemanyhydrothermalventsites(Bennett etal.,2011;Clagueetal.,2019;Rouxeletal.,2018)atLoihi.Inad- dition,althoughdiapycnalmixingintheopenoceanisweak(Led- well etal., 1998, 1993), seamounts are known sitesof enhanced vertical mixing(Lueck andMudge, 1997; Toole et al., 1997). We thusarguethattheverticalspreadlikelyoccursasaresultofboth verticallydistributedsourcesandenhancedverticalmixinginthe vicinityoftheinjectionsites.
Wemodeltheregionaldistributionoftheverticallyintegrated 3Heanomaly(theinventory)between900and1300mdepthsus- ing the observations reportedhere along withselected historical profiles. Uncertainties are assigned as a combination of analyti- cal precisions and interpolation errors. The latter, estimated by
assuming aprofile shapeintermediate betweena box-car(acon- stantvalueovertherange)andatriangulardistributiondominates.
The inventories, which include results from a recent occupation along thismeridian (P16Nin2015)showa smoothtrendvs.dis- tance(seeFig.8d),supporting theideathatthefeaturedescribed is persistent.Usinghistorical data,we can furtherdevelop a pic- ture of the distribution ofthe vertically integratedLoihi-sourced 3Heanomaly.Forthoseprofileswithcontemporaneousneoncon- centrationmeasurements,similarcalculationscanbedone,butfor those without neondata (notably the more distant WOCE P17N section at135◦W)a much moreapproximate scheme(Jenkins et al.,2018)mustbeused,withsignificantlylessaccuracy.
This model rests on the assumption that the existence of a persistent regional 3He feature emanating from Loihi requires a sustainedhydrothermalfluxofthisisotope.Themagnitudeofthe required flux depends on the regional scale velocity and turbu- lent diffusionresponsible forits dispersion. We usean idealized advection-diffusion model to set approximate constraints on this flux. We constructed a two-dimensional rectangular slab-channel modelforthisdepthrange,spanningfromthedatelineto120◦W and between 10◦ and 30◦N. We impose a uniform zonal veloc- ityanda spatially variablebut isotropichorizontalturbulent dif- fusivity. Horizontal resolution is 25 km, and a standard, mass- conserving,upwind-differencing algorithm(Glover etal., 2011) is usedtointegratethemodeltosteady-state.Choiceofthezonalve- locityiscriticalinthattheresultswillscalealmostlinearlywithit.
10 W.J. Jenkins et al. / Earth and Planetary Science Letters 539 (2020) 116223
Weuseavelocityof0.0040±0.0016m s−1obtainedforthisloca- tionanddepthfromaglobalmulti-tracerdataassimilationmodel calibratedby radiocarbon andCFCs(Schlitzer, 2004, 2007) which hasbeen used successfullyto model regional/globaldistributions of radiocarbon and 3He (Schlitzer, 2007, 2016). This velocity is consistent witha recent analysis ofcirculation at 1000m depth fromfloatdatabyOllitraultandDeVerdiere(2014,their Fig. 12), andweconservativelyestimateanuncertaintyof40%tothisvalue.
ThepresenceoftheHawaiianIslandchaininthepathofthiszonal currentmaylead tospatialenhancement oflateraldiffusion(e.g., Chenetal., 2015). Thus,we imposea simplespatial structureon thelateral diffusivityasthesumof aconstant backgrounddiffu- sivityplus a halfsine function centered on 20◦N,150◦W whose valueiszeroat10◦ and30◦N,andat180◦ and120◦W.Themag- nitudesofthebackgroundandamplitudediffusivitiesweretreated asvariablestobeoptimizedagainstobservations.
Toconstrain themodel,we compute integrated watercolumn inventories between 800 and 1300 meters depth of the Loihi- attributed3He(based onthe3He/4He anomaliesandcalculations described above) using only the more recentlyoccupied stations (2015and2018)thathavenoblegasmeasurementsalongthe152
◦W section. Forthe 135◦W section,due tothe lack ofnoblegas data,weusealessprecisecalculation (Jenkinsetal.,2018) using thehistoricalheliumisotopemeasurements largelymadebyLup- ton (1996,1998).Forweightingpurposes,weestimateduncertain- tiesintheseinventoriesdueto thecombinationofmeasurement andinterpolation/integrationerrors.
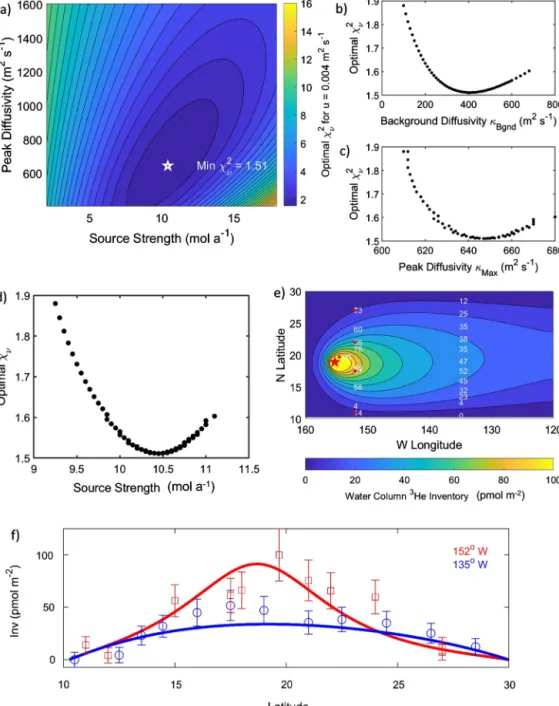
We embedded the advection-diffusion model within a non- linearoptimizationalgorithmthatvariedtheLoihisourcestrength (released at thecell nearest theseamount’s location) along with boththebackgroundandpeakhorizontalturbulentdiffusivitiesto minimize the model mismatch to the observed distribution. We characterizethemodel-datamisfitbycomputingthereducedchi- squared
χ
ν2=
1 N−
3i
(
Mi−
Oi)
2σ
i2 (5)whichisthesumofthesquareddifferencesbetweenmodel(Mi) andobservation(Oi)points normalizedbytheuncertainty(
σ
i) of the observationsdivided by the numberof constraining observa- tionsminusthenumberofadjustableparameters(e.g.see(Glover et al., 2011)). Since it is difficult to present the distribution of thispropertyinthree-dimensionalparameterspace,wepresentin Fig. 9 various “slices” in2D (Fig. 9a)and 1D (Fig. 9b-d) formats along with the optimal modelLoihi 3He inventory spatial struc- turewiththeconstrainingdata(Fig.9e).The
χ
ν2 distributionasafunction ofsourcestrengthandmax- imum (peak) diffusivity is shown in Fig. 9a for a globally opti- mal background diffusivity of 405 m2s−1 (see Fig. 9b). Theχ
ν2contours in Fig.9a show a sloping ellipticalminimum indicating a broad correlation betweensource flux anddiffusivity: increas- inglateraldiffusivitynecessary to“spread”theeastward oriented tonguemeridionallyrequiresanincreaseinsourcefluxrequiredto support the overall inventory. The global minimum
χ
ν2 was 1.5, indicating good agreement with observations, especially consid- ering the simplicity of the model. The optimal case peak diffu- sivity was 645 m2s−1 (see Fig. 9c) and the optimal source flux (Fig.9d)was 10.43mol a−1.Theoptimalsourcestrengthdepends mostontheaggregatehorizontaldiffusivity:inspectionofFigs.9b and 9d reveals that required source strength is relatively insen- sitive tothe value ofbackgrounddiffusivity, changingonly about±6%fora±50%changeinbackgroundmixingrate.Asonereduces thebackgroundmixingrate,theamplitudeoftheislandwakeen- hancement(characterizedbythesinusoidamplitude)increasesto compensate,maintainingaroughly constantaverage diffusivityin
theplume.Infact,choosingaspatiallyconstanthorizontalmixing ratehasonlyamodestinfluenceontheoverallresult.
Fig. 9e shows model 3He inventory distribution for the op- timal case, along with the constraining observations. The model parameters, 3Hesource strength (10.4 mol a−1) alongwith back- ground(405m2s−1)andpeak(645m2s−1)horizontaldiffusivities scale linearlywiththehorizontalvelocity, soassuming anuncer- tainty ±40%inthevelocitytranslatestoacorresponding±40%in thoseparameters.Thusweestimatethe3Hefluxtobe10.4±4.2 mol a−1,apeakhorizontaldiffusivityof645±258m2s−1,anda backgrounddiffusivityof405 ± 162m2s−1. Therangeofproba- blehorizontaldiffusivities agreeswell withmanyother estimates of intermediate depth open-ocean values on regional scales (for example,Jenkins,1991; Ledwelletal.,1998;Robbinsetal.,2000;
SundermeyerandPrice, 1998).Moreover, elevated isopycnalmix- ing should result from the expected enhancement ofdeep eddy energetics around the Hawaiian Island and seamountwakes. We thereforeregard the predictedfluxesandhorizontaldiffusivityas consistentwithcurrentunderstandingofthoseprocesses.
As a slab model, these calculations are relatively immune to the effects of vertical (diapycnal)mixing becausethe inventories used toconstrainthe modelarevertically integratedoverseveral hundred meters. In thisway itcompensates forthe initial verti- cal dispersion caused either by enhanced vertical mixing in the vicinity of rough topography (e.g.,Ledwell et al., 2000; Polzin et al., 1997) orby multiplehydrothermalinjectionsites atdifferent depths. We can, nonetheless,place an upperlimit on the poten- tial impact of diapycnal mixing by combining our knowledge of the verticaldistributionofthe Loihi3He withareasonablerange ofdiffusivities.Estimatesforopenoceandeepwatersaretypically oftheorderof1×10−4 m2s−1 (Munk,1966),whiletracer-based estimates in the main pycnocline are of order 2×10⁻⁵ m2s−1 (Ledwell etal.,1998,1993;Rooth andOstlund, 1972). Weexpect anactualdiffusivitysomewhereinbetweenthesetwoatinterme- diate depths.Using anaveragevertical 3Hegradient of2×10−16 mol m−4 inthe “core” ofthe horizontal Loihi heliumplume and anapproximatearealextentof1×1012m2,wearriveatafluxof 3−15×10−9 mol s−1 or 0.1– 0.5 mol a−1. This corresponds to lessthan5%oftheestimatedflux,smallcomparedtootheruncer- tainties.
The mostprobable3He sourceflux of10.4mol a−1 isremark- able, beingof order of2% ofthe 548 ± 31 mol a−1 globaldeep hydrothermal 3He flux (Bianchi et al., 2010; DeVries andHolzer, 2019;Schlitzer,2016).Whileseeminglylarge,netplumebuoyancy fluxes indicate that the Hawaiian hot spot contributes ∼15% of theglobalmantleplumebuoyancyflux(Sleep,1990) andsinceat somelevelinthemantleheatand3Heshouldbecorrelated,asim- ilarly large fractionof themantle plume 3He flux. Becausesome portion ofthe Hawaiian plume volatile release will be subaerial (e.g.,throughKilauea, whichhasa3He/4Heratiointermediatebe- tweenLoihiandasthenosphericvalues),ourresultsuggestsalower boundglobalplume3Hefluxof70mol a−1,about13%ofthemid- ocean ridge flux (Bianchi et al., 2010; DeVriesand Holzer,2019;
Schlitzer, 2016). Givenan estimate ofthe currentmagma supply rateof2.5×107 m3a−1 forLoihi(Garciaetal.,2006)andassum- ing virtually completevolatile loss,we estimate the un-degassed magmatic 3He concentration of4×10−7 mol m−3 (which corre- spondsto∼3.5×10⁻⁹cc-STPg−1).Thisisapproximately100-fold more thanthe largestreportedconcentrations observedinglassy rims of extruded flows on Loihi (e.g., Kurz et al., 1983), but it is consistent withthe magmaticdegassing concepts (e.g.,Chavrit et al., 2012). Such a disparity can be expected, both due to ev- idence atLoihi ofextensivedegassing prior toeruption (Byers et al.,1985),andduetotheverylarge3He:heatratioobservedforthe Loihi hydrothermalsystems(Elderfield andSchultz, 1996;Lupton etal.,1989).Inthelattercase,theroughly100-foldenhancement