Contents lists available atScienceDirect
Earth and Planetary Science Letters
www.elsevier.com/locate/epsl
Segment-scale volcanic episodicity: Evidence from the North Kolbeinsey Ridge, Atlantic
I.A. Yeo
a,∗, C.W, Devey
a, T.P. LeBas
b, N. Augustin
a, A. Steinführer
aaGEOMARHelmholtzInstituteforOceanResearchKiel,D-24148Kiel,Germany bNationalOceanographyCentre,Southampton,UK
a r t i c l e i n f o a b s t ra c t
Articlehistory:
Received24August2015
Receivedinrevisedform20January2016 Accepted24January2016
Availableonlinexxxx Editor:C.Sotin
Keywords:
Mid-AtlanticRidge slow-spreadingridge
autonomousunderwatervehicle sidescansonar
sea-floorspreading volcanism
The upper oceanic crust is produced by magmatism at mid-ocean ridges, a process thought to be characterized by cyclic bouts of intense magmatic activity, separated by periods when faulting accommodates most or even all of the plate motion. It is not known whether there is a distinct periodicitytosuchmagmatic–tectoniccycles.Herewepresenthigh-resolutionsidescansonardatafrom theneovolcaniczoneoftheNorthKolbeinseyRidge,ashallowslow-spreadingridgewherehighglacial andsteadypost-glacialsedimentationratesallowrelativeflowagestobedeterminedwitharesolutionof around2kyr usingbackscatteramplitudeasaproxyforsedimentthicknessandhenceage.Weidentify 18lavaflowfieldscovering40%oftheareasurveyed.Agroupof7flow fieldsshowingthehighest(and similar)backscatterintensityarescatteredalong75kmofaxialvalleysurveyed,suggestingthatatleast thislengthofthesegmentwasmagmaticallyactivewithina1.2kyr timewindow.Basedonconservative age estimatesfor alldatable flows and estimated eruptionvolumes, the post-glacial volcanicactivity imagedisinsufficienttomaintaincrustalthickness,implyingthatepisode(s)ofenhancedactivitymust haveprecededthevolcanismweimage.
©2016TheAuthors.PublishedbyElsevierB.V.ThisisanopenaccessarticleundertheCCBY-NC-ND license(http://creativecommons.org/licenses/by-nc-nd/4.0/).
1. Introduction
1.1.Volcanicperiodicityonslow-spreadingmid-oceanridges
At slow-spreading ridges, episodes of volcanism are likely to be separated by periods of relative magmatic quiescence, when faultmovementaccommodatesplateseparation.Thisinterplaybe- tweenvolcanismandtectonismcontrolsLayer2Agrowth(Escartín etal.,2007) andpossiblythefractionationstateandheterogeneity shownbymid-oceanridgelavas(RubinandSinton,2007).Thepe- riodicityof magmaticperiods maybe controlleddirectly by melt supplytotheridge(Parsonetal.,1993),orbeinfluencedbyexter- nalfactorslikesealevelandorbitaleccentricity(Tolstoy,accepted;
Crowleyet al., 2015), although climatic forcing is unlikely to in- creasevolcanicactivitybymorethanaround50%.Estimatesofcy- clelengthsvaryfromtensofthousandsofyears(BryanandMoore, 1977; Sinhaetal.,1998; BallardandVanAndel,1977) tohundreds ofthousandsofyears(Searleetal.,1998; Mendeletal.,2003) with variable estimates for periods at intermediate-spreading ridges (6 kyr, Clague etal., 2014), fast spreading ridges (tensof kyr to tenof years,Bowles etal., 2006 andSinton et al., 2002) andthe
*
Correspondingauthor.E-mailaddress:iyeo@geomar.de(I.A. Yeo).
GalapagosSpreadingCentre,whichisunderlainbyahotspot(hun- dredsofyears,Bowles etal., 2014). Scatteris duetodifficulty in accurately dating young volcanic events and detecting individual flows, and becauseprocess ratesare a function ofthe measured timeinterval(Gardneretal., 1987).Thereareveryfewmid-ocean ridgesfor whichwe have anyknowledge ofthe eruption history overarelevantperiodoftime.Individuallavaflowfieldshavebeen successfullymappedandmeasured usingrepeat bathymetricsur- veying(Caressetal.,2012; Foxetal.,1992) butradiometricdating ofthese flows(e.g. Duncan andHogan,1994) andreconstruction of geological histories is commonly limited by the sample den- sity.Othershaveusedsedimentdrapethicknessasaproxyforage (Mitchell, 1993, 1995a) using data from both sub-bottom profil- ersandsidescansonar to differentiaterelatively large differences indrapethickness. Paleomagneticstudieshavealsoprovideduse- ful age information(e.g. Schouten et al., 1999), butrequire near bottom magnetometer surveys, while some successful work has beendoneusinggeomagneticpaleointensityofsubmarinebasaltic glasses(Bowlesetal.,2005).
Deep submergence, high-frequency sidescan sonar has,in re- gions with well constrained sedimentation rates, the potential to simultaneously yield information on both flow field ages and their areal extents and distribution. Beam penetration into sed- iment at frequencies of 120 kHz is physically limited to <2 m http://dx.doi.org/10.1016/j.epsl.2016.01.029
0012-821X/©2016TheAuthors.PublishedbyElsevierB.V.ThisisanopenaccessarticleundertheCCBY-NC-NDlicense(http://creativecommons.org/licenses/by-nc-nd/4.0/).
82 I.A. Yeo et al. / Earth and Planetary Science Letters 439 (2016) 81–87
(Mitchell, 1993) and in practice is probably only a few tens of centimeters,socentimeterscaledifferencesinsediment thickness shouldbedetectableinthesonarreflectivityoflavaflows.
1.2. Geologicalsetting
TheKolbeinseyRidge(KR)isaregionoftheMid-AtlanticRidge between66.5◦Nand71.7◦N,bounded tothe northandsouth by theJanMayenandTjörnesFractureZones,respectively.Ithasbeen anactiveslow-spreadingcentresinceatleast26Ma(Brandsdóttir et al., accepted; Bott, 1985) with a rate of <20 mm/yr since 9.5 Ma (Vogt et al., 1980; Kodaira et al., 1998). The ridge is divided by non-transform offsets into three segments (“North”,
“Central” and “South”), all of which are unusually shallow and have abnormally thick crust, perhaps asa resultof higher man- tle temperatures closeto the Iceland hotspot (Vogt et al., 1980;
Kodaira et al., 1998) and/or the effects of mantle compositions (Haase etal., 2003).The relatively steadypost-glacial sedimenta- tionrates(∼2cm/kyrNowaczykandFrederichs,1999)andthick- enedcrust (implying excessmagmatism)make theNorthernKol- beinseyRidge(NKR)an idealplaceforapplicationofthesidescan datingmethod.
1.3. SedimentaryhistoryoftheKolbeinseyRidge
Knowledge of the sediment type and sedimentation rates is necessary to estimate sediment thicknesses and derive lava flow ages.No sediment coredata directlyfrom theNorthern Kolbein- seyRidgeareavailablebutnumerouscoreshavebeentakeninthe surrounding region.Cores takenfrom furthersouth on the ridge (between67.04◦Nand67.22◦N,100 kmfromtheIcelandic coast) contain a combination of volcaniclastic material and sands, silts, mudsandclays,predominantlyderivedfromIceland(Lackschewitz and Wallrabe-Adams, 1991). As the NKR lies 180 km from Jan Mayanandalmost600kmfromIcelandsedimentationontheNKR isprobablydominated bythe finergrainedmudsandsilts found incoresfurthernorth(ThiedeandHempel,1991).Thelast glacia- tion, ending approximately 10–15 ka (Ruddiman and McIntyre, 1981)hasresultedinvariablesedimentationratesoverthelastfew tensofthousandsofyears.Paleointensitymeasurementsoncores within200kmofthestudyarea(69.5◦Nto70.25◦N)byNowaczyk andFrederichs (1999)show sedimentationratesof2 cm/kyr from 1to11ka,5cm/kyr from11to13ka,3.7cm/kyr from13to30 ka and2cm/kyr priorto30 ka.
2. Materialsandmethods
Datawere collected oncruise POS436ofthe Germanresearch vesselF.S.PoseidoninJune/July2012.Shipmultibeambathymetry wasacquiredusingtheonboardSeabeamSB3050echosounder.Ini- tial collection and processing were done using the Hypack and Hysweep software packages. Final cleaning andgriding (at 35m cellsize)ofthemapswasconductedinFledermaus.Alatencyis- sueinthesystem(causedbya non-constanttime offsetbetween the echo-sounder andGPS) that was only discovered late in the cruiseandcouldnotbeeliminatedwhileatsealedtosomeoffset intheabsolutepositioningofindividualmultibeampings.Weused theNavAdjust featureofMB-System(Caress,1999)to re-alignall surveylinesandtoproduceafinal,integratedgrid.
AUVside-scandatawereacquiredusingGEOMAR’sREMUS6000 vehicle“ABYSS”anditsEdgetech2200-MPs120kHzCHIRP(Com- pressed High-Intensity Radar Pulse) sidescan sonar running at 120 kHz.TheCHIRPpulsehasabandwidthof12kHzandabeam widthof0.2◦ resultinginhorizontalresolutionsacross-track(per- pendicularto vehicleheading)of0.625 mandalong trackofbe- tween 0.17and1.7 m. Thesidescanmosaics wereproduced with
2m pixelsandwith100%coverage. Thesidescansonarmeasures onlysonarreflectivityandnosub-bottominformationiscollected.
Mosaics of the data were produced using Chesapeake SonarWiz software. Additional mosaics and all beam amplitude measure- mentsusedfortheacousticageassessmentswereextractedusing PRISM(LeBasandHuvenne,2009) inareasofflatseafloorwithin theboundariesofindividualmappedflows.
3. Resultsanddiscussion 3.1. Axialmorphology
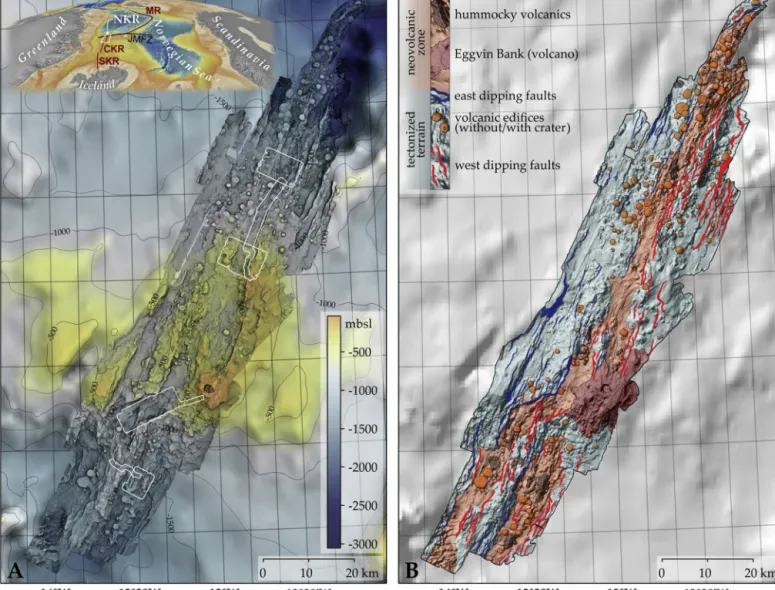
Ourbathymetric map(Fig. 1A) allowsthe locationofthe NKR spreading axis to be determined in detail for the first time. It hasarelativelysimpleaxialstructurenorthof71◦15N,character- ized by anormal-fault-bounded axialvalley containing numerous flat-topped seamounts (Fig. 1B). The central section as far south as70◦55´N,withtheexception ofEggvinBankvolcano, ismostly smooth, withca.70%ofthe seafloorhavingarugosity value(the ratio of the actual 3D area divided by the area if flat) of <1.05.
Thisdistribution ofvolcanicterrainsisatypical ofslow-spreading ridges,whichgenerallycompriseahighpercentageofrugosehum- mockyvolcanics(SmithandCann,1990).Thesouthernendofthe NKRshowstwoparallelvolcaniczonesseparatedbya10kmwide ridgeoftectonized seafloor.Anobliquevalley,boundedbynormal faults andcontaining lavaflows,appears toconnect the western- most of the valleys with the main ridge to the north. It is not possible to say definitively whetherthis area is an overlap with theCentralKolbeinseyRidge,anevolvingpartial-segmentjumpor a doubleaxial valley.However, thereisnoevidenceforthefaults curving towardseach other, asmightbe expected inan overlap- ping spreading centre (e.g. Klein et al., 2013) and there appear to be more volcanic features in the eastern valley, which aligns with the main ridge trend to the north, suggesting an evolving ridge jump of this small section westwards towards the Central Kolbeinsey Ridge is probablythe most likely explanation. Eggvin Bank Volcano is locatedon theintersection ofthe obliquevalley withthemain ridgetrend tothenorth. It alsoliesontop ofthe majoreasternaxialvalleywallboundingfaultalongthissectionof theridge.
The 145 flat-topped seamounts imaged have an average di- ameter of 1100 mand an average height above the surrounding seafloor of114m, andso conform to thetypical 1:10 height:di- ameterratioobserved elsewhere(Smithetal.,1995a,1995b)and for seamountsover 50m in height display a similar exponential size-frequencydistributiontothatobservedbothontheReykjanes Ridge(MagdeandSmith, 1995) and theregions oftheGalapagos spreadingcentrewhichpossessariftvalley(Behnetal.,2004).The hummockyvolcanics(Fig. 1B)haveanaverageflow-unitthickness of 30 m based on their relief in the bathymetric maps (ranging from ≤10 to 85 m), thinner than hummocky seamounts on the ReykjanesRidge(MagdeandSmith,1995).
3.2. Sidescanlavaflowmappingandrelativeages
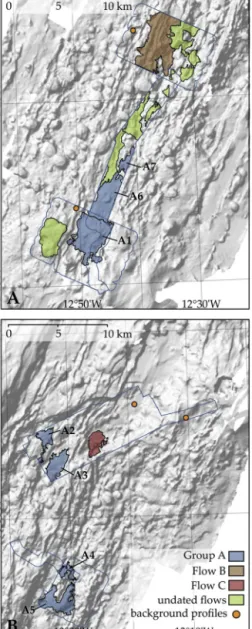
Sixareas (covering20% oftheneovolcanic zone)were chosen forsidescansurveyingbyAUV(Fig. 1A).Intheseareas,60%ofthe seafloorshowslowacousticbackscatter,withnoevidenceofrecent volcanic activity. The remaining 40% consists of lava flow fields withhigherbackscatter,indicatingthepresence ofhardsubstrate that,inamid-oceanridgeenvironment,islava.Wedistinguish18 lava-covered regions with areas between 0.3km2 and15.8 km2 (Fig. 2).Asitisnotpossibletodeterminewhethertheseindividual regions representsingle lavaflows orare each comprisedofsev- eralflowunits,weusetheterm“flowfield”heretodescribethem.
Informationaboutthelavasurface morphologiesisalsovisiblein
Fig. 1.(A)SB3050multibeamTedainTextureShaderr bathymetryoftheNorthernsegmentoftheKolbeinseyRidgegriddedat 50 m(B)geologicalmap basedonthe bathymetryandsidescansonardata.TerrainTextureShader(TTS)mapsuseanalgorithmtoproducemapswithahierarchicalframeworkthatemphasizesdetailswithno dependenceonlightingdirection.ThewhiteboxesmarktheareascoveredbyAUVsidescansonarsurveysandcorrespondtothesurveysshowninFig. 2(whichshowsall 6)andFig. 3(whichshowsonlythesurveyintheobliquevalley).Inset:TectonicsettingoftheNorthKolbeinseyRidge(NKR)TheCentralKolbeinseyRidge(CKR)South Kolbeinsey Ridge(SKR),MohnsRidge(MR)andtheJanMayanFractureZone(JMFZ)arelabeled.EggvinBankVolcanoliesontheboundarybetweentheCentral Kolbeinsey andNorthernKolbeinsey Ridges.
thesidescanimagery(e.g.Fig. 3).Unlike25◦NontheMid-Atlantic Ridge,wheresmooth seafloorispillowed (CannandSmith,2005) we concludethe majorityof the flow fieldsmapped by sidescan sonar arelikely tobe massivesheet or lobateflows, asthesere- gions also display both tumuli andcollapsed lava surface crusts, characteristicfeaturesofsheetorlobateflows.
Theflowfieldsshowdifferentbackscatterintensities.Whilethis couldbeduetovariationsinthethicknessoftheirsedimentcover (and hence age), we must first remove variations resulting from differencesinanyorallofthefollowingfactors:(A)absorptionof the signal in water,(B) the overlying sediment type, (C) the an- gles(“grazingangles”)atwhichthebeamsmeettheseafloor,and (D)surface roughnessesofthedifferentflowfields.Operationally, we minimized (A) by ensuring that all surveys were performed ataconstant (low) vehiclealtitude (50±10 m)keepingacoustic range small.In this deep-sea setting, variation in sediment type shouldbelimitedandthisissupportedbythelackofvariationin theamplitudesmeasuredinbackgroundareas,sograin-sizeeffects (B) can be discounted.By using onlydata from flat seafloor(i.e.
seafloorwithaslope<5◦basedonourmultibeammaps)thegraz- ing anglebecomes a simple function ofdistancefrom thesound
source,makingiteasytocomparedatawiththesamegrazingan- gles(C). Theeffects ofsurface roughnessvariations (D) are more difficulttodealwith,especiallythesmallerscaleroughness,which mayleadtolavaoutcroppingthroughthinsedimentblankets.The effectoflargerscalesurfaceroughnessvariationscan beobviated by usingthesidescanimageryto comparesimilarflow types(i.e.
chooseonlythesmoothcentreofsheetflows),but,intheabsence ofvisual observationsoftheseafloor,weneed toassume that,at the length scalesampled byour backscatteranalysis(see below) allsheetflowshaveasimilarformofsurfacemicrostructure.
Becausesedimentthicknessonflowsurfacesnaturallyvariesto some extent we average data from 50 consecutive pings along- track (equivalent to 15–20 m on the seafloor), fitting a 5-point movingcurve tothisaverage(smoothingthedataoveran across- trackdistance of approximately3.1 m) andthen pooling average datafrom atleast4different areasonany oneflow. We assume thatsedimentationrateisuniformacrosstheareastudied.
Fig. 4showstheresultingbackscatteramplitude profiles.Mea- suredamplitudesareconsistentlyhigherandlessnoisyontheport sideduetoinherentsensitivitydifferencesinthehardware,sowe compareonlyport-sideprofilesinthefollowingdiscussion.“Back-
84 I.A. Yeo et al. / Earth and Planetary Science Letters 439 (2016) 81–87
Fig. 2.Enlargedmultibeambathymetry illuminatedfromthe northwestshowing AUVsidescansonarcoverage(blueoutlines)withthelavaflowfieldsmappedfrom thesedatasetsshownincolor.GroupAlavasareshowninblue,FlowBinbrown andFlowCinred.NotethelargealongaxisdistributionofGroupAflowfields.(For interpretationofthereferencestocolorinthisfigurelegend,thereaderisreferred tothewebversionofthisarticle.)
ground”backscatteramplitudewasdeterminedatseveralflat,fea- turelessoff-axisareas(locationsshowninFig. 2)wheresediment coveristoothick forthesonar to seethroughandshouldthere- foreresultonlyfromsoundbeingreflected atthesediment/water interfacewithvariationduetotheotherfactorslistedand/orfad- ing (Mitchell, 1995b).The highestmeasured value is usedasthe referencevalueforallsedimentthicknesscalculations.
Wewereabletoextractbackscatterprofilesfittingourselection criteriafrom9ofthe18flowfieldsmapped(Figs. 2 and4D).Those flow fieldsfor which profiles could not be extractedwere either (a)narrowerthantheAUVsidescanswath,resultinginincomplete profiles,(b)toosmallformultipleprofiles tobe measured,or(c) hadnosmooth areaslargeenough toextract full profiles.Ampli- tudecurveswerecomparedbetween50and200mawayfromthe vehicle,where thegrazing anglesare steepest andso differences in sediment cover should be most clearly visible. Using the ra- tiosoftheamplitudesoftheflowfieldstoourlowestbackground value (equivalent to total attenuation ofthe beam excluding the firstreflection),alongsideattenuationvaluesformuddysediments
fromHamilton (1980),weareabletocalculatethesedimentthick- nessdifferencesbetweentheflowfieldsandthehighestmeasured valueforGroupA(Appendix 1)as:6.4cmforFlowFieldC,3.6 cm forFlowField B,2.3 cmfortheminimumGroupA,and16.0cmfor thebackground.Usingasedimentationrateof2cm/kyr (assuming ratesfromNowaczyk andFrederichs,1999are accurate)thetotal rangeimagedis16cm,equivalentto8kyr.The differenceinage betweenFlow FieldC andFlow FieldB isaround 1.4ka,andbe- tweenFlowFieldBandthelowestvaluesforGroupAis0.7ka.The entireGroupAwaseruptedinaperiod<1.2kyr.AssumingGroup Aarezeroage,supportedbythefacttheseflowsareunfaultedand flow around and over older tectonic features (e.g. flow field A2, whichflows aroundfaults atitsnorthernendandcrossesseveral smallfissures(Fig. 3))weimagednoflowsolderthan3.2kyr and themaximumageresolved withthismethodis8kyr.Thiswould belargeriftheGroupAlavasarenotrecent.Thesecalculationsare heavily dependenton anumberofassumptions includingassum- ing thatthe sedimentdrape andthe surfacestructure ofthelava flow fields are homogeneous,that sedimentation rateis constant throughtimeandthattheeffectsofacousticrefractionwithinthe sedimentarenegligible.Sedimentthicknessmaybeoverestimated ifthesedimentsaresandierthanassumed,thoughnotgreatly,for example using values fora sandy silt (Hamilton, 1980) the total thicknessfromlowestbackgroundtomaximumGroupAis11 cm (Appendix 1).
Estimatingaverticalresolutionforthismethodisdifficultwith- out a calibrated referencevalue. The vertical resolution ofa sub bottomprofilerwitha12kHzbandwidthwouldbearound7cm, howeverourresolutionisbetterthanthisasweareclearlyableto distinguishFlowFieldsA2andA3fromFlowFieldC,andtheyare different welloutside ofthetypical scatter ofa single curve, de- spiteourcalculatedsediment thicknessbetweenthembeingonly 4.2cm.The scatterinthebackgroundvaluesshouldrepresenter- rorsresultingfromallvariablesexceptsedimentthicknessandlava flow surface roughness (because there is no lavaflow beingim- aged). Inthiscasethesevariations areequivalent toaround4 cm of sediment thickness(Appendix 1), althougheven thisseems to be an overestimationofwhat weare ableto distinguish.Regard- less, a 4 cm resolution (equivalentto ±1 kyr ata sedimentation rateof2 cm/kyr)wouldallowustoclassFlow CandGroupAas differentfromeach otherandthebackground,butisgreater than thesedimentcoverdifferencesbetweenFlowBandeitherGroup A orFlowC.
3.3. MagmaticepisodicityatNorthKolbeinsey
Group A lavas are found along 75 km of axis surveyed, sug- gestingthatthislength oftheaxiswasactiveinthesame1.2kyr period.TheshallowNKRsegmentcentreanditsalmostcompletely unfaultedneovolcaniczone(seeFig. 1)aresimilartofeaturesseen at fast-spreadingridgeshosting a melt body (e.g.Phipps Morgan andChen,1993)andsuchameltbodymayhavefedflowfieldsin amannersimilartothatpredictedbysomecyclicmodels(Parson etal.,1993).Inthesemodels,thesupplyofabatch ofmelttothe ridgeaxisresultsinlarge,longrun-outeruptions,whichfocusand decreaseinvolumeasthemeltbodysolidifies
AUV survey areaswere chosen to be representative of bathy- metricfeaturesalongtheentireaxis.Althoughthishaslimitations, itshouldyieldthemostrepresentativeinformationintheabsence oftotalaxialcoverage.Ifweextrapolatethe20%volcaniccoverage observedinourAUVsurveystotheentireridgeaxis,thetotalvol- umeof all volcanicproducts inthe NKRneovolcanic zone (sheet flowfields,hummocksandflat-toppedvolcanoes,seeFig. 1)isin- sufficient to account for crustal production in post-glacial times.
To produce seismiclayer 2A (the section ofthe crust thought to becomposedofextrusivevolcanics)with0.65kmthickness(vary-
Fig. 3.(A)MosaicofoneoftheAUVsidescansonardatasetsinwhichlavaflowfieldswithdifferingbackscatterstrengths(correspondingtoFig. 4C)canclearlybeseen.
ImagerywasprocessedandmosaickedusingPRISM(LeBasandHuvenne,2009) andtheSonarWizprocessingpackage.Ensonificationfromthenorthwest.(B)geological interpretationofthesidescanbathymetry.Theclusterofhummockyvolcanicsaround1318’W70◦55Wmaybeanolderlavafield,nowtoocoveredbysedimenttoaccurately picktheboundaries.Locationsofmajortumuliareshownwithaletter“T”.
ingfrom0.5–0.8alongaxisKodairaetal.,1997)atafullspreading rateof1.8 cm/yrwithinthelast8kyr requiresapproximately13.1 km3 of lavato be erupted along the140 km-longsegment. This is slightly higher than the range of rates required to maintain typical 2A thicknesses of0.1–0.5 km (Peirce et al., 2007) on the southernReykjanesRidge(forthesamesegmentlengthandafull spreadingrateof21.5 mm/yrthislayer2Athicknesswouldrequire between2.4 and 12.0 km3 of lava to be erupted over the same
period). The total area of the flow fields we mapped (Fig. 2) is 78.4 km2.Astheseflowfieldsshownopositivebathymetricsigna- ture,their thicknessislikelytobesimilartoorlessthanthever- ticalresolutionofour multibeammapping system,conservatively estimated at 10 m. This is in accordance with observations on slow-spreadingridgeselsewhere e.g.Karsonetal. (2002)although thickerflowsare observedonIcelandandthefastspreading East Pacific Rise. Using this thicknessestimate, the flow fields havea
86 I.A. Yeo et al. / Earth and Planetary Science Letters 439 (2016) 81–87
Fig. 4.Amplitudeprofiles(nounitsgivenasamplitudeisnotcalibratedontheAUV) for(A)fourbackgroundareasandtheiraverage,(B)thelavaflowfieldsshownin Fig. 3,and(C)allthelavaflowfieldsonthesegmentforwhichsmoothprofiles couldbeextracted.
volume of 0.78 km3. Extrapolated to the entire axis, sheet flow fields contribute 3.9 km3. Hummocks are observed on less than 10%(57 km2) oftheneovolcaniczone witha volumeof2.7 km3. Wehavenoageconstraintsfromsedimentthicknessforthehum- mocksandso usethevalley widthof3.5 kmcombined withthe spreadingratetodefinetheirageas≤200 ka,equatingtoanerup- tion rateof0.14 km3/10 ka(0.01 km3 in the last 8 kyr).Similar assumptions are applied to the 145 flat-top seamounts mapped, ofwhich40(totalvolumeof6.1 km3) liewithin theinnervalley, yielding a production rate of. 0.31 km3/10 ka (0.25 km3/8 kyr).
Additional volcanic input from Eggvin Bank Volcano is excluded asthere isno evidencethat large volume flows arereaching the main axial valley (Fig. 1, Fig. 3). The exception to this are pos- sible Eggvin Bank flows filling the graben directly to the north ofthe volcano. Additionally, the volcano extents are picked from thebreakinslope,butmayextenddeeperthanshown. However, anyadditional Eggvin flow volume would be small compared to thevolumesrequiredtonoticeably change theestimatedvolcanic imputfromthesegmentandthetraceofthevolcanooffaxissug- geststhe crust here islocally thickened compared to the restof thesegmentmeaningthatthisregionmayalsohaveathickerex-
trusive volcanic section not accountedfor inthe average seismic 2Acrustalthickness.
Summingtheseestimates,only4.16km3 oraround32%ofthe volumerequiredtomaintaincrustalthicknessforthelast8kyr is accountedfor.Thisisequivalentto0.5 km3perkyr,around10%of that observedduringthelast10 kaintheWesternVolcanicZone of Iceland (Sinton et al., 2005). The 8 kyr numberis takenfrom thecalculationsinsection3.2asthemaximumpenetrationofour methodandisthereforesubjecttothesameassumptions,however, inorderfortheretonotbeadeficit in eruptedmaterialitwould needtobelessthan2.5kyr,welloutsideerrorslikelyduetosedi- menttypeorsedimentratevariations.If8kyr underestimatesthe time span over whichwe can detect lava,eruption ratesmay be even lower. Additionally, if our estimate of sheet flow thickness wereanunderestimate,toaccountforthe13.1 km3 ofmagmare- quiredtogeneratethecrustoverthistimeperiodaflowthickness of around 40 m would be required. Such flows would be much thickerthanthoseonIceland(e.g.McDougalletal.,1977)andthe fast-spreading East-Pacific Rise (e.g. Macdonald etal., 1989) and shouldbevisibleonbathymetricmaps.
4. Conclusions
TheNKRaxisappearstohaveexperiencedbelow-averagepost- glacial extrusivevolcanic activity, inagreement withrecent sug- gestions thathighHolocenesealevel andlow-orbital eccentricity suppress mid-oceanridgevolcanism(Tolstoy,accepted; Crowleyet al., 2015).Tomaintain the thicknessoflayer2A longterm, more intensemagmaticepisodes,andhenceaepisodicityofmagmatism, are required.Whetherthisepisodicity ismagmatically orclimati- callydrivenwillonlybecomeclearfromexaminingsegment-scale eruptive records spanning longer time periods, although climatic forcingisunlikelytoaccountsoleyforthedisparity.
At theNKRepisodicmagmaticepisodes,comprisingnumerous volcanic eruptionsalong theridgesegmentappearto occuronat least a tensof thousandsof yearstimescale, similar to estimates for magmachamber volume attheRAMASSES area onthe Reyk- janesRidge(Sinhaetal.,1998) whichsuggested30kyr episodicity.
Suchhigh-volume,episodicmagmaticevents,ratherthanconstant lowlevelextrusivevolcanism,arelikelytooccurgloballyonslow- spreadingmid-oceanridges.
Acknowledgements
The authors thank the scientific party, officers and crew of cruise POS436 for their professionalism anddedication. The AUV Abyss engineers, particularly MarcelRothenbeck, provided expert support duringdeploymentsandmethoddevelopment. Wethank Dean Wilson for his expertise in geophysical methods. We are grateful for careful and detailed comments from Neil Mitchell, DeborahSmithandthreeanonymousreviewers,whichgreatlyim- proved themanuscript.IAYgratefullyacknowledgesthereceiptof aHumboldtFoundationpostdoctoralfellowship.
Appendix A. Supplementarymaterial
Supplementarymaterialrelatedtothisarticlecanbefoundon- lineathttp://dx.doi.org/10.1016/j.epsl.2016.01.029.
References
Ballard,R.D.,VanAndel,T.H.,1977.Morphologyandtectonicsoftheinnerriftval- leyatlat36◦50’NontheMid-AtlanticRidge.Geol.Soc.Am.Bull. 4,507–530.
http://dx.doi.org/10.1130/0016-7606.
Behn, M.D., Sinton, J.M., Detrick, R.S., 2004. Effect of the Galápagos hotspot on seafloor volcanism along the GalápagosSpreading Center (90.9–97.6◦W).
Earth Planet. Sci. Lett. 217 (3–4), 331–347. http://dx.doi.org/10.1016/S0012- 821X(03)00611-3.
Bott,M.H.P.,1985. Platetectonicevolutionofthe IcelandicTransverseRidgeand adjacent regions. J. Geophys. Res. 90 (B12), 9953. http://dx.doi.org/10.1029/
JB090iB12p09953.
Bowles,J.A.,Colman,A.,Mcclinton,J.T.,Sinton,J.M.,White,S.M.,Rubin,K.H.,2014.
Eruptivetimingand200yearepisodicityat92◦Wonthehotspot-influenced GalapagosSpreadingCenterderivedfromgeomagneticpaleointensity.Geochem.
Geophys. Geosyst. 15, 2211–2224. http://dx.doi.org/10.1002/2014GC005315.
Received.
Bowles,J.,Gee,J.S.,Kent,D.V.,Bergmanis,E.,Sinton,J.,2005.Coolingrateeffectson paleointensityestimatesinsubmarinebasalticglassandimplicationsfordat- ingyoungflows.Geochem. Geophys.Geosyst. 6(7).http://dx.doi.org/10.1029/
2004GC000900.
Bowles, J., Gee, J.S., Kent,D.V., Perfit, M.R., Soule, S.A., Fornari,D.J., 2006. Pa- leointensityapplications totiming and extent of eruptive activity, 9◦–10◦N EastPacificRise.Geochem. Geophys.Geosyst. 7(6).http://dx.doi.org/10.1029/
2005GC001141.
Brandsdóttir,B.,Hooft,E.E.E.,Mjelde,R.,Murai,Y.,accepted.Originandevolution oftheKolbeinseyRidgeandIcelandPlateau.N-Atlantic.Geochemis.Geophys.
Geosyst.http://dx.doi.org/10.1002/2014GC005540.
Bryan,W.B.,Moore,J.G., 1977. Compositionalvariations ofyoung basalts inthe Mid-AtlanticRidgeriftvalleyCompositionalvariationsofyoungbasaltsinthe Mid-AtlanticRidgeriftvalleynearlat36◦49’N.Geol.Soc.Am.Bull. 4,556–570.
http://dx.doi.org/10.1130/0016-7606(1977)88<556.
Cann,J.R.,Smith,D.K.,2005.Evolutionofvolcanismandfaultinginasegmentofthe Mid-AtlanticRidgeat25◦N.Geochem.Geophys.Geosyst. 6(9).http://dx.doi.org/
10.1029/2005GC000954.
Caress,D.W.,1999.MB-System–publicdomainsoftwareforprocessingswathmap- pingsonardata.UnderseaExplorations.
Caress,D.W.,Clague,D.A.,Paduan,J.B.,Martin,J.F.,Dreyer,B.M.,Chadwick,W.W., Denny,A., Kelley,D.S.,2012.Repeat bathymetric surveysat 1-metreresolu- tionoflavaflowseruptedatAxialSeamountinApril2011.Nat.Geosci. 5(7), 483–488.http://dx.doi.org/10.1038/ngeo1496.
Clague,D.A., Dreyer,B.M.,Paduan,J.B., Martin,J.F.,Caress, D.W.,Guilderson,T.P., Mcgann,M.L.,2014.Geochemistry,Geophysics,Geosystems.Geochem.Geophys.
Geosyst. 15(8),3364–3391.http://dx.doi.org/10.1002/2014GC005415.
Crowley,J.W.,Katz,R.F.,Huybers,P.,2015.Glacialcyclesdrivevariationsinthepro- ductionofoceaniccrust.Sciencexpress,1–7.http://dx.doi.org/10.1126/science.
1261508,February.
Duncan,R.A., Hogan,L.G., 1994. Radiometric dating of young MORB using the 40Ar–39Arincrementalheatingmethod.Geophys.Res.Lett. 21(18),1927–1930.
http://dx.doi.org/10.1029/94GL01375.
Escartín,J., Soule, S.A., Fornari,D.J.,Tivey,M.A., Schouten,H.,Perfit,M.R.,2007.
Interplaybetweenfaultsandlava flowsinconstructionoftheupperoceanic crust:TheEastPacificRisecrest9◦25–9◦58N.Geochem.Geophys.Geosyst. 8 (6).http://dx.doi.org/10.1029/2006GC001399.
Fox,C.G.,Chadwick,W.W.,Embley,R.W.,1992.Detectionofchangesinridge-crest morphologyusingrepeatedmultibeamsonarsurveys.J.Geophys.Res. 97(B7), 11149–11162.http://dx.doi.org/10.1029/92JB00601.
Gardner,T.W.,Jorgensen,D.W.,Shuman,C.,Lemieux,C.R.,1987. Geomorphicand tectonic process rates: effects of measured time interval. Geology 15 (3), 259–261.
Haase,K.M.,Devey,C.W.,Wieneke,M.,2003.Magmaticprocessesandmantlehet- erogeneitybeneath the slow-spreading northern Kolbeinsey Ridge segment, NorthAtlantic.Contrib.Mineral.Petrol. 144,428–448.http://dx.doi.org/10.1007/
s00410-002-0408-z.
Hamilton,E.L.,1980.Geoacousticmodelingoftheseafloor.J.Acoust.Soc.Am. 65 (5),1313–1340.http://dx.doi.org/10.1121/1.385100.
Karson,J.A.,Tivey,M.A.,Delaney,J.R.,2002.Internalstructureofuppermostoceanic crustalongtheWesternBlancoTransformScarp:implicationsforsubaxialac- cretionanddeformationattheJuandeFucaRidge.J.Geophys.Res. 107(B9), 1–23.http://dx.doi.org/10.1029/2000JB000051.
Klein,E.M.,White,S.M.,Nunnery,J.A.,Mason-Stack,J.L.,Wanless,V.D.,Perfit,M.R., Waters,C.L.,Sims,K.W.W.,Fornari,D.J.,Zaino,A.J.,Ridley,W.I.,2013.Seafloor photo-geologyand sonar terrain modeling at the 9◦N overlapping spread- ingcenter,EastPacificRise.Geochem.Geophys.Geosyst. 14(12),5146–5170.
http://dx.doi.org/10.1002/2013GC004858.
Kodaira,S.,Mjelde,R., Gunnarsson,K.,1997. CrustalstructureoftheKolbeinsey NorthAtlantic, obtained byuse of oceanbottom seismographs. J. Geophys.
Res. 102(B2),3131–3151.
Kodaira,S.,Mjelde,R.,Gunnarsson,K.,Shiobara,H.,Shimamura,H.,1998.Evolution ofoceaniccrustontheKolbeinseyRidge,northofIceland,overthepast22Myr.
TerraNova 10,27–31.http://dx.doi.org/10.1046/j.1365-3121.1998.00166.x.
Lackschewitz, K.S.,Wallrabe-Adams, H.-J.,1991. Composition and originofsedi- mentsonthe mid-oceanicKolbeinseyRidge,northofIceland.Mar.Geol. 101 (1–4),71–82.http://dx.doi.org/10.1016/0025-3227(91)90063-A.
LeBas,T.P.,Huvenne,V.A.I.,2009.Acquisitionandprocessingofbackscatterdata forhabitatmapping–comparisonofmultibeamandsidescansystems.Appl.
Acoust. 70(10),1248–1257.http://dx.doi.org/10.1016/j.apacoust.2008.07.010.
Macdonald,K.C.,Haymon,R.,Shor,A.,1989.A220 km2recentlyeruptedlavafield ontheEastPacificRisenearlat8◦S.Geology 17(3),212–216.
Magde,L.S.,Smith,D.K.,1995.SeamountvolcanismattheReykjanesRidge:relation- shiptotheIcelandhotspot.J.Geophys.Res.,SolidEarth 100(B5),8449–8468.
http://dx.doi.org/10.1029/95JB00048.
McDougall, I., Saemundsson,K.,Johannesson,H.,Watckins,N.D.,Kristjansson, L., 1977.Extensionofthegeomagneticpolaritytimescaleto6.5 my:K–Ardat- ing,geologicalandpaleomagneticstudyofa3500-m lavasuccessioninwestern Iceland.Geol.Soc.Am.Bull. 88,1–15.
Mendel,V.,Sauter,D.,Rommevaux-Jestin,C.,Patriat,P.,Lefebvre,F.,Parson,L.M., 2003. Magmato-tectonic cyclicity at the ultra-slow spreading Southwest In- dianRidge:evidencefromvariations ofaxialvolcanicridge morphologyand abyssalhillspattern.Geochem.Geophys.Geosyst. 4.http://dx.doi.org/10.1029/
2002GC000417.
Mitchell,N.C.,1993.Amodelforattenuationofbackscatterduetosedimentaccu- mulationsanditsapplicationtodeterminesedimentthicknesseswithGLORIA sidescansonar.J.Geophys.Res. 98(B12),22477–22493.
Mitchell, N.C., 1995a. Characterising the extent of volcanism at the Galapagos SpreadingCentreusingDeepTowsedimentprofilerrecords.EarthPlanet.Sci.
Lett. 134(3–4),459–472.http://dx.doi.org/10.1016/0012-821X(95)00132-V.
Mitchell,N.C.,1995b.RepresentingbackscatterfluctuationswithaPDFconvolution equationanditsapplicationtostudybackscattervariabilityinside-scansonar images.IEEETrans.Geosci.RemoteSens. 33(6),1328–1331.http://dx.doi.org/
10.1109/36.477190.
Nowaczyk,N.R.,Frederichs,T.W.,1999.Geomagneticeventsandrelativepalaeoin- tensityvariationsduringthepast300kaasrecordedinKolbeinseyRidgesed- iments,IcelandSea:indicationforastronglyvariablegeomagneticfield.Int.J.
EarthSci. 88(1),116–131.http://dx.doi.org/10.1007/s005310050250.
Parson,L.M.,Murton,B.J.,Searle,R.C.,Booth,D.,Keeton,J.,Laughton,A.,Mcallister, E.,Millard,N.,Redbourne,L.,Rouse,I.,Shor,A.,Smith,D.,Spencer,S.,Summer- hayes,C.,Walker,C.,1993.Enechelonaxialvolcanicridgesat theReykjanes Ridge:alifecycleofvolcanismandtectonics.EarthPlanet.Sci.Lett. 117,73–87.
http://dx.doi.org/10.1016/0012-821X(93)90118-S.
Peirce,C.,Sinha,M.,Topping,S., Gill,C.,2007. Morphologyand genesisofslow- spreading ridges-seabed scattering and seismic imaging within the oceanic crust. Geophys. J. Int. 168 (1), 59–89. http://dx.doi.org/10.1111/j.1365-246X.
2006.03223.x.
PhippsMorgan,J.,Chen,Y.J.,1993.Dependenceofridge-axismorphologyonmagma supply and spreading rate. Nature 364, 706–708. http://dx.doi.org/10.1038/
364706a0.
Rubin,K.H.,Sinton,J.M.,2007.Inferencesonmid-oceanridgethermalandmagmatic structurefromMORBcompositions.EarthPlanet.Sci.Lett. 260(1–2),257–276.
http://dx.doi.org/10.1016/j.epsl.2007.05.035.
Ruddiman, F.W., McIntyre, A., 1981. The North Atlantic Ocean during the last deglaciation.Palaeogeogr.Palaeoclimatol. Palaeoecol. 35 (0),145–214.http://
dx.doiorg/10.1016/0031-0182(81)90097-3.
Schouten,H.,Tivey,M.A.,Fornari,D.J.,Cochran,J.R.,1999. Centralanomalymag- netization high:constraintson thevolcanic constructionand architectureof seismiclayer2Aatafast-spreadingmid-oceanridge,theEPRat9◦30–50N.
Earth Planet. Sci. Lett. 169 (1–2), 37–50. http://dx.doi.org/10.1016/S0012- 821X(99)00063-1.
Searle,R.C.,Cowie,P.A.,Mitchell,N.C.,Allerton,S.,Macleod,C.J.,Escartin,J.,Russell, S.M.,Slootweg,P.A.,Tanaka,T.,1998.Faultstructureanddetailedevolutionof aslowspreadingridgesegment:theMid-AtlanticRidgeat298N.EarthPlanet.
Sci.Lett. 154,167–183.
Sinha, M.C., Constable, S.C., Peirce, C., White, A., Heinson, G., MacGregor, L.M., Navin,D.A.,1998. Magmaticprocessesat slowspreadingridges:implications oftheRAMESSESexperimentat57◦45NontheMid-AtlanticRidge.Geophys.J.
Int. 135(3),731–745.http://dx.doi.org/10.1046/j.1365-246X.1998.00704.x.
Sinton,J.,Grönvold,K.,Saemundsson,K.,2005.Postglacialeruptivehistoryofthe WesternVolcanicZone,Iceland.Geochem.Geophys.Geosyst. 6(12).http://dx.
doi.org/10.1029/2005GC001021.
Sinton,J.,Bergmanis,E.,Rubin,K.,Batiza,R.,Gregg,T.K.P.,Macdonald,K.C.,White, S.M.,2002.Volcaniceruptionsonmid-oceanridges:newevidencefromthesu- perfastspreadingEastPacificRise,17◦–19◦S.J.Geophys.Res. 107(B6).http://
dx.doi.org/10.1029/2000JB000090.
Smith,D.K.,Cann, J.R.,1990.Hundredsofsmallvolcanoesonthe medianvalley flooroftheMid-AtlanticRidge.Nature 348,152–155.http://dx.doi.org/10.1038/
348152a0.
Smith,D.K.,Cann,J.R.,Dougherty,M.E.,Lin,J.,Spencer,S.,Macleod,C.,Keeton,J., Mcallister,E.,Brooks,B.,Pascoe,R.,Robertson,W.,1995a.Mid-AtlanticRidge volcanism from deep-towed side-scan sonar images, 25◦–29◦N. J. Volcanol.
Geotherm.Res. 67,233–262.
Smith,D.K.,Humphris,S.E.,Bryan,W.B.,1995b.Acomparisonofvolcanicedifices at theReykjanesRidge andthe Mid-AtlanticRidge at 24◦–30◦N.J. Geophys.
Res. 100(B11),22485–22498.
Thiede,J.,Hempel,G.,1991.DieExpeditionARKTIS-VII/1mitFS“Polarstern”.Rep.
PolarRes. 80,1–137.
Tolstoy,M.,accepted.Mid-oceanridgeeruptionsasaclimatevalve.Geophys.Res.
Lett.http://dx.doi.org/10.1002/2014GL063015.
Vogt,P.R.,Johnson,G.L.,Kristjansson,L.,1980.Morphologyandmagnetic-anomalies northofIceland.J.Geophys. 47(1–3),67–80.