Withold and Reinauer: Immunoblotting for detection of Bence Jones proteinuria 135
Eur J Clin Chem Clin Biochem 1995; 33:135-138
© 1995 Walter de Gruyter & Co.
Berlin · New York
An Immunoblotting Procedure Following Agarose Gel Electrophoresis for Detection of Bence Jones Proteinuria Compared with Immunofixation and Quantitative Light Chain Determination
By Wolfgang Withold and Hans Reinauer
Institut f r Klinische Chemie und Laboratoriumsdiagnostik, Medizinische Einrichtungen der Heinrich-Heine-Universit t D sseldorf, Germany
(Received November 14, 1994/January 2, 1995)
Dedicated to the memory of Professor Dr. Ahmad Fateh-Moghadam
Summary: An immunoblotting procedure for the sensitive detection of Bence Jones proteinuria following agarose gel electrophoresis was developed.
After immunonephelometric determination of urinary κ and λ light chains [employing antisera to human κ and λ light chains (free + bound)], urine samples (diluted to 2.5 mg/1 κ and λ light chains, respectively) were electropho- retically separated using the Paragon® system and blotted by capillary diffusion onto nitrocellulose. Rabbit anti- human κ and λ light chains reacted to κ and λ light chains attached to the membrane. Goat anti-rabbit IgG alkaline phosphatase conjugate was employed as detection system.
The detection limit of the immunoblotting procedure (monoclonal component, as determined by serial dilutions) was 0.3 mg/1 urine. Among 65 urine specimens received for routine testing for Bence Jones proteinuria, 32 monoclonal components (in 20 urine samples) were found by immunoblotting compared with 10 monoclonal components (in 9 urine samples) detected by immunofixation. In only 5 out of these 65 urine samples a κ/λ ratio (as determined immunonephelometrically) < 1 or > 5.2 (decision limits for discriminating between monoclonal and polyclonal urinary light chains; Boege F, Koehler B, Liebermann F. Eur J Clin Chem Clin Biochem 1990; 28:37—42) was ob- served.
In conclusion, the immunoblotting method is superior to both immunofixation and immunonephelometry with respect to the diagnostic sensitivity for detection of Bence Jones proteinuria.
Introduction . Another method (yielding quantitative results) is the im-
^ . j . ~ ι ι Λ. i- i.* u · /D munochemical determination of κ and λ light chain con- Hie detection of monoclonal free light chains (Bence . . . * ,~
T
. . . . ι -j · .* «. centrations m urine samples (2).
Jones proteins) in unne samples provides important ^
v'
diagnostic and prognostic information of B-cell malig-
Immunoblotting has beenproposed as an alternative nancies with a monoclonal proliferation of plasma and
method for qualitative detection as well as heavy andlymphoplasmacytoid cells, respectively.
light chain typing of human paraproteins (3) By ΛίδThe usual approach for qualitative detection of Bence method the protein pattern generated in a gel is transfer- Jones proteins in urine samples by immunofixation red to a porous membrane (e. g. nitrocellulose) to pro- following agarose gel electrophoresis is more sensitive duce a replica; the purpose of this transfer is to facilitate than immunoelectrophoresis (for review see I.e. (1)). the binding of antibodies to their corresponding antigens
Eur J Clin Chem Clin Biochem 1995; 33 (No 3)
136
Withold and Reinauer: Immunoblotting for detection of Bence Jones proteinuriaon the membrane yielding a higher analytical sensitivity compared with immunofixation (for review see 1. c. (4)).
The present communication describes an immunoblot- ting procedure (following agarose gel electrophoresis) for detection of Bence Jones proteinuria in comparison with immunofixation (following agarose gel electropho- resis) and immunonephelometric determination of light chain concentrations.
Materials and Methods Samples
We examined aliquots from 24-h collections of 65 urine samples.
These were all urine samples sent to our laboratory for routine screening for Bence Jones proteinuria over a 2-month period.
Immunoblotting following agarose gel electrophoresis Urine samples were diluted to 2.5 mg/l κ and λ light chains, respectively (as determined immunonephelometrically; see below) with Έ-2 barbit l buffer' (component of the Paragon® electropho- resis kit; see below). In case of urine samples showing light chain concentrations below the detection limit (as determined immuno- nephelometrically; see below) native urines were employed. Five μΐ of diluted urine samples were electrophoretically separated in agarose gels for 30 min using the Paragon® system according to the manufacturer's recommendations.
Immunoblotting was performed by capillary diffusion as described earlier (3) employing
(a) an Immun-Blot® Assay Kit (Βίο-Rad Laboratories GmbH, Mu- nich, Germany; no. 170-6460),
(b) nitrocellulose strips as blotting membranes (Bio-Rad Laborato- ries GmbH; no. 162-0114) and
(c) rabbit antisera (DAKO GmbH, Hamburg, Germany) against hu- man κ and λ light chains (bound + free) (no. A 191 and A 193).
The occurrence of at least one homogeneous band reacting with only one of these two antisera was considered to represent the presence of a monoclonal immunoglobulin. In order to differentiate between Bence Jones proteins and an urinary excretion of intact monoclonal immunoglobulins, antisera against κ free light chains and λ free light chains (no. A 100 and A 101) as well as antisera against γ, α and μ chains (no. A 423, A 262 and A 425) were used.
All antisera were diluted 1 + 100 with Tris · HC1 buffer (20 mmol/1, pH 7.5, with 500 mmol/1 NaCl) containing 0.5 ml/1 Tween® 20 and 10 g/1 gelatine. Goat anti-rabbit IgG alkaline phos- phatase conjugate was employed as second antibody. Colour devel- opment took place with nitroblue tetrazolium and an indolyl phos- phate derivative.
Immunofixation following agarose gel electrophoresis Immunofixation was performed employing the Paragon® Immu- nofixation electrophoresis kit (Beckman Instruments GmbH; no.
444930) according to the manufacturer's recommendations. The urine samples were concentrated up to a total protein concentration of 10 g/1 with Amicon Έ15' concentrators. For a definition of monoclonality of the urinary immunoglobulins see under 'immu- noblotting following agarose gel electrophoresis'.
Quantitative determination of light chains ·"*- in urine samples
Quantitative light chain determinations in urine samples were per- formed with the help of a Behring Nephelometer Analyzer (Beh- ringwerke AG, Marburg) employing *N protein standard serum' (lot no. 067650) and CNA antisera' to human immunoglobuIins/L- chains (κ and λ) (lot. no. 101439 and no. 101453). The assay proto- col was according to the manufacturer's recommendations. The de-
1
4 L
5 2 . > < *
1 ···'·'··' -"'
3 " U±
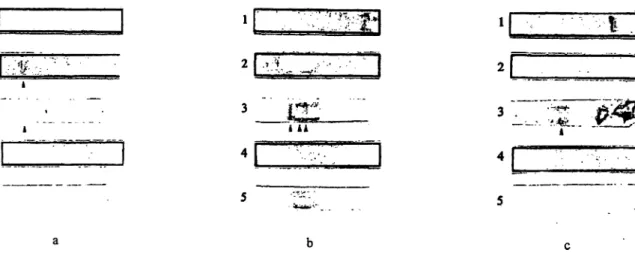
Fig. 1 Comparison between immunoblotting and immunofixation for detection of monoclonal immunoglobulins in urine samples.
The cathode is on the left, the anode on the right.
Lane 1: Urine protein electrophoresis (employing 'blue stain' [component of the Paragon® electrophoresis kit])
Lane 2: Immunofixation (employing antisera against κ light chains [bound + free])
Lane 3: Immunoblotting (employing antisera against κ light chains [bound + free])
Lane 4: Immunofixation (employing antisera against λ light chains [bound + free])
Lane 5: Immunoblotting (employing antisera against λ light chains [bound + free])
Fig. la Detection of an intact IgGic paraprotein by both methods (heavy chain typing not shown).
Fig. Ib Polyclonal κ pattern by immunofixation but monoclonal pattern by immunoblotting.
Fig. Ic A monoclonal band (Bence Jones κ) detected only by immunoblotting whereas immunofixation shows neither a poly- clonal nor a monoclonal pattern.
The monoclonal κ bands detected by immunoblotting (as shown in figs. Ib and Ic) were proved to be Bence Jones proteins by sepa- rately employing antisera against heavy and free light chains.
Eur J Clin Chem Clin Biochem 1995; 33 (No 3)
Withold and Reinauer: Immunoblotting for detection of Bence Jones proteinuria
137tection limit was 3 mg/1 for λ chains and 5 mg/1 for κ chains. An optimal discrimination between monoclonal and polyclonal urinary light chains was assumed to be given using decision limit values of the κ/λ ratio of 5.2 and 1.0, respectively (2).
For comparison between quantitative values and immu- noblotting see table 2.
Results
Immunoblotting — detection limit and frequency of monoclonal bands observed Serial dilutions with several urine samples containing monoclonal free κ and free λ light chains were done.
The detection limit (monoclonal component concentra- tion) was 0.3 ing/1 urine.
In 65 urine samples, a total of 32 monoclonal compo- nents was found in 20 urines by immunoblotting (24 free κ light chains, 4 free λ light chains, 2 monoclonal IgGK and 2 monoclonal IgGX). The number of monoclo- nal bands observed by immunoblotting ranged from 1 to 4 per urine sample (figs, la to Ic).
Comparison between immunoblotting and immunofixation
Out of 65 urine samples, a total of 10 monoclonal com- ponents was found in 9 urines by immunofixation (8 free κ light chains, 1 free λ light chain and 1 monoclonal IgGK). The number of monoclonal bands observed by immunofixation ranged from 1 to 2 per urine sample.
For comparison between immunofixation and immu- noblotting see table 1.
Comparison between immunoblotting and quantitative light chain determination
Range of κ light chain concentrations was < 5 to 160 mg/1 (median ± SEM: 21 ± 4 mg/1) whereas the range of λ light chain concentrations was < 3 to 117 mg/1 (median ± SEM: 13 ± 3 rng/1). In 5 out of 65 urine samples a κ/λ ratio < 1 or > 5.2 (decision limits for discriminating between monoclonal and polyclonal uri- nary light chains as suggested by 1. c. (2)) was observed.
Discussion
Immunoblotting is superior to immunofixation as well as immunonephelometric determination of light chains with respect to the detection of Bence Jones proteinuria.
This applies not only to the number of urine samples being positive for monoclonal components but also to the number of monoclonal bands detected per urine sam- ple. Multiple bands appearing in urine samples are most probably due to the association of monomeric light chains to multimers (5) or due to a proteolytic degrada- tion of the Bence Jones proteins yielding charge as well as size isoforms (6).
The increased diagnostic sensitivity of the immunoblot- ting method (7, 8) as compared with immunofixation is due to several factors:
(a) No concentration step is required thus avoiding loss of Bence Jones proteins during ultrafiltration.
(b) Immunoblotting is characterized by higher analytical sensitivity because the transfer of the proteins to the blotting membrane facilitates diffusion of the antibodies to their corresponding antigens (4). The typical detection limit of an immunofixation procedure is only 20-30 mg/1 (9) compared with 0.3 mg/1 as found for our immu- noblotting method.
(c) Repeated analyses of different antigen concentrations have to be performed for immunofixation procedures because a precipitation of immune complexes is re- quired.
By application of immunoblotting, however, monoclonal bands can be seen using only one combination of sample concentration and antibody dilution.
For the quantitative determination of urinary immuno- globulin light chains the following has to be taken into account:
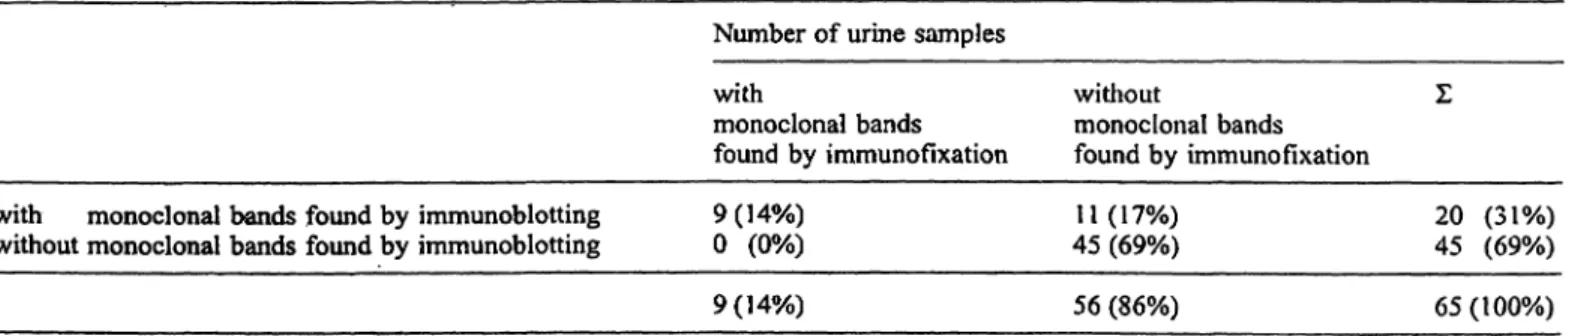
Tab. 1 Comparison between immunoblotting and immunofixation.
Number of urine samples monoclonal bands with found by immunofixation
without
monoclonal bands found by immunofixation with monoclonal bands found by immunoblotting
without monoclonal bands found by immunoblotting 9(14%)
0(0%) 9(14%)
11
(17%)
45(69%)
56(86%)
20
(31%)
45(69%) 65(100%)
Eur J Clin Chem CliaBiochem 1995; 33 (No 3)
138
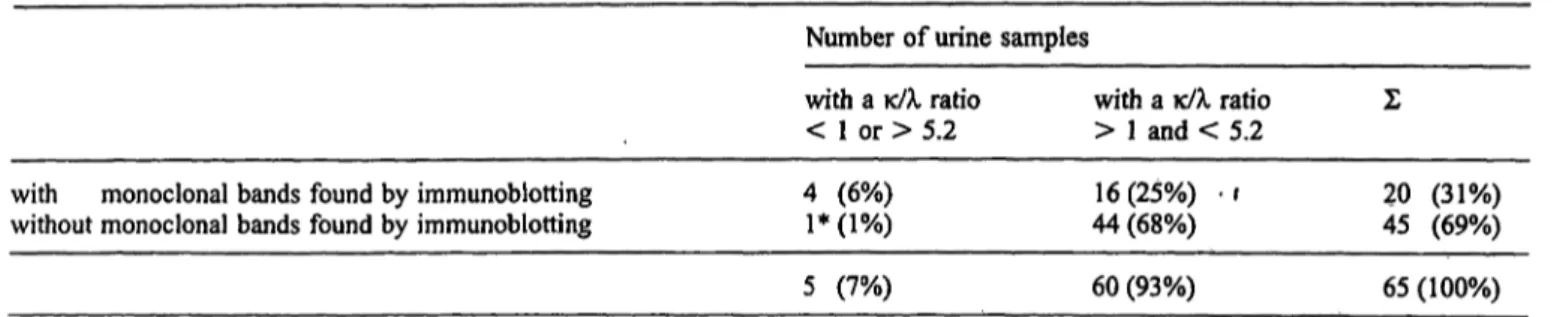
Withold and Reinauer: Immunoblotting for detection ofBence Jones proteinuriaTab. 2 Comparison between immunoblotting and quantitative light chain concentrations.
Number of urine samples
with monoclonal bands found by immunoblotting without monoclonal bands found by immunoblotting
with a κ/λ ratio
< 1 or > 5.2 4 (6%)
!*(!%)
with a κ/λ ratio
> 1 and < 5.2 16(25%) Ί 44 (68%)
Σ
20 (31%) 45 (69%)
60 (93%) 65 (100%)
* Re-analysis of this sample (λ concentration = 40 mg/1; κ/λ ratio clonal pattern of free κ and λ light chains.
= 0.25) by immunoblotting and immunofixation confirmed a poly-
(a) the antisera employed for immunonephelometry re- act both with immunoglobulin-bound as well as with free light chains;
(b) the reactivity of the antibodies in these antisera may differ with respect to whether the light chains are immu- noglobulin-bound or free;
(c) the 'standard serum' used for calibration contains light chains only in the immunoglobulin-bound form.
One of our samples showed a κ/λ ratio (as determined immunonephelometrically) < 1 in spite of a polyclonal pattern as revealed by electrophoretic techniques. This corresponds to previous findings in urine (2) as well as serum (10) samples showing κ/λ ratios below/above the decision limits without presence of monoclonal compo- nents by immunofixation. Only 4 out of our 9 samples with monoclonal components (as detected by immunofi- xation) were characterized by κ/λ ratios < 1 or > 5.2 whereas Boege et al. (2) found that all of 40 urine sam-
ples examined by them with monoclonal bands (as de- tected by immunofixation) were characterized by altered κ/λ ratios. A possible explanation for this discrepancy are the higher concentrations of the immunoglobulin light chains in the urine samples examined by Boege et al. (2) (13-30000 mg/1). Moreover, the tendency of free light chains in urine samples to form reversible poly- mers may cause inaccuracies of the immunonephelomet- ric determination (2).
The high sensitivity of the immunoblotting method pre- sented in this communication may be used e. g. for*"the detection of residual tumour mass in patients with B cell malignancies following chemotherapy.
Acknowledgement
The technical help of cand. med. M. Aivado for performing the immunoblotting procedure is gratefully acknowledged. We thank the technical assistants of the department of immunology for col- lection of urine samples.
References
1. The Association of Clinical Pathologists, Laboratory investiga- tion of paraproteinaemia. J Clin Pathol 1988; 41:776-85.
2. Boege F, Koehler B, Liebermann F. Identification and quantifi- cation of Bence-Jones proteinuria by automated nephelometric screening. Eur J Clin Chem Clin Biochem 1990; 28:37-42.
3. Withold W, Rick W. An immunoblotting procedure following agarose gel electrophoresis for subclass typing of IgG parapro- teins in human sera. Eur J Clin Chem Clin Biochem 1993- 31:17-21.
4. Towbin H, Staehelin T, Gordon J. Immunoblotting in the clin- ical laboratory. J Clin Chem Clin Biochem 1989; 27:495-501.
5. Dear Dr. [Bence] Jones [editorial]. Clin Chem 1991;
j /: iDD/ o.
6. Norden AGW, Fulcher LM, Flynn FV. Immunoglobulin light- chain immunoblots of urine proteins from patients with tubular and Bence-Jones proteinuria. Clin Chim Acta 1987·
166:307-15.
7. Graziani MS, Righetti G. Immunoblotting for detecting Bence Jones proteinuria [letter]. Clin Chem 1987; 33· 1079-80 8. Heys A, Norden AGW, Fulcher LM, Flynn FV. Bence Jones
protein detection: a rapid immunoblotting technique for rou-
tine use on unconcentrated urine. Ann Clin Biochem 1986*
23:571-6.
9. Fateh-Moghadam A, Thomas L. Monoklonaie Immunglobu- line. In: Thomas L, editor. Labor and Diagnose. Marburg: Med- izinische Verlagsgesellschaft, 1992:880-907.
10. Boege F, Koehler B, Schwab M. Die diagnostische Wertigkeit des Kappa/Lambda-Leichtketten-Quotienten bei Nachweis, Identifizierung und Quantifizierung monoklonaler Immunglo- buline im Vergleich zu Imm nfixation, M-Gfadient und quan- titativer Immunglobulinbestimmung. Untersuchungen an 101 Patientenseren. Lab. Med. 1989; 13:369-74.
Dr. med. Wolfgang Withold Institut f r Klinische Chemie und Laboratoriumsdiagnostik Medizinische Einrichtungen der Heinrich-Heine-Universit t D sseldorf Moorenstra e 5
D-40225 D sseldorf Germany
Eur J Clin Chem Clin Biochem 1995; 33 (No 3)