Hofmann and Guder: Quantitative analysis of proteinuria 589 J. Cltn. Chem. Clin. Biochem.
Vol. 27, 1989, pp. 589-600
© 1989 Walter de Gruyter & Co.
Berlin · New York
A Diagnostic Programme for Quantitative Analysis of Proteinuria
By W. Hofmann and W. G. Guder
Institut für Klinische Chemie, Städtisches Krankenhaus München Bogenhausen (Received December 31, 1988/May 18, 1989)
Summary: A spectrum of quantitative methods was adapted to the Kone Specific Analyser for the purpose
of recognizing, quantifying and differentiating various forms of proteinuria. Total protein, IgG, albumin and oci-microglobulin (measured by turbidimetry), N-acetyl-ß-.D-glucosaminidase activity and creatinine (measured photometrically), were measured in undiluted urine; in addition a
rmicroglobulin was measured in serum.
Within and between run predsion, accuracy and linearity of the turbidimetric methods were in good agreement with nephelometric procedures. All turbidimetric methods exhibited a correlation coefficient r > 0.98 when compared with the radial immunodiffusion procedure äs reference method. Total protein measured turbidi- metrically with the Kone Specific Analyser was in good agreement with the manual biuret procedure.
The low detection limits and linearities allowed quantification of urine analytes from the lower ränge of normals up to ten times the upper limit of normals.
The measured analytes exhibited stability in urine at pH 4—8 over at least seven days at 4 —6 °C and — 20 °C.
Only IgG showed a significant loss (up to 30 percent), when measured after storage at —20 °C.
Quantities per mol creatinine showed significantly lower intra-individual and inter-individual variability than quantities per liter. In 31 normal persons, the intraindividual Variation was lowest for N-acetyl-ß-Z>-glucosa- minidase activity (13%) and highest for total protein (33%), when measured in the second morning urine on 5 consecutive days.
When related to creatinine, resülts obtäined in the second morning urine showed no significant differences from those in 24 h urine, except for aj-microglobulin which gave lower values in 24 h urines.
The upper normal limits, calculated äs the 95% ranges, were determined from 154 urines of 31 individuals.
Nearly all analytes showed an asymmetric distribution. Because of a wide tailing of the upper limit, preliminary üpper normal limits were set aböve this ränge:
Total protein: 7.9 g/mol creatinine (70 mg/g creatinine) IgG: 1.13 g/mol creatinine (10 mg/g creatinine) Albumin: 2.26 g/mol creatinine (20 mg/g creatinine) ocrMicroglobulin: „ 1.58 g/mol creatinine (14 mg/g creatinine) N^Acetyl-ß-jD-glücosaminidäse: 0.56 kU/mol creatinine (5 U/g creatinine).
Application of the newly adapted programme to unselected urines sent for urine analysis revealed a threefold incfease in the propörtion of resülts outside the normal ranges, compared with the routinely used protein test strip procedure. All additional positive urines exhibited either signs of glomerular or tubular proteinuria.
Determination of albumin or N-acetyl-ß-jD-glucosaminidase excretion was sufficient to detect these additional cases.
J. Clin. Chem. Cün. Biochem. / Vol. 27,1989 / No. 9
590
Hofmann and Guder: Quantitative analysis of proteinuria IntroductionProteinuria is usually detected by qualitative tests based either on acid precipitation or on the test strip procedure, using the protein-error-of-indicator prin- ciple (l, 2). These tests, however, seem not to fulfil the medical requirements, since neither the detection limit nor the analytical specificity allow the recogni- tion of all clinically relevant forms of proteinuria (3, 4). This is especially true of all kinds of prerenal proteinurias (i.e. Bence-Jones-, myoglobin-, haemo- globin-) and tubular proteinurias, s well s so-called microalbuminuria, all of which escape detection by the test strip procedure (2—4). SDS-polyacrylamide gel electrophoresis (PAGE) was proposed to over- come this problem (5 — 7). In fact many more tubular proteinurias were detected when this technique was applied s a screening procedure (3,7). In spite of its Performance, this method has not found wide appli- cation s a routine procedure, because of its cost and time effectiveness. We therefore tried to find an alter- native solution to this problem by combining quan- titative techniques for the measurement of single uri- nary proteins of different molecular weights with es- tablished procedures for a tubular enzyme, creatinine and total protein (8, 9). The aim of the present di- agnostic programme was to exclude, quantify and differentiate various forms of proteinuria in a single automated programme, which can be applied to un- diluted urine samples. The present methodology has already been partially presented in a preliminary form
(10).
and JO a.m. by 31 persons aged 18-60 years (12 men, 19 woraen) who had no anamnestic or clinical Symptoms, and no signs of renal or other diseases. Twenty four-hour urines were also coliected from 13 normals. The blood pressure of this reference population was below 140/90 mmHg.
In addition 67 urines were taken from the single daiiy routine of all surgical and medical departments of the Bogenhausen City Hospital.
AU urines were tested with an automaieii test strip procedure (Rapimat II, Behringwerke AG, Marburg, FRG) and found to be negative in the reference population. The test strip pro- gramme incl ded protein, nitrite, glucose, leukocytes, blood and pH. All subsequent procedures were performed with su- pernatant urines after centrifugation for 10 min at 800 g on the same day. For stability studies urine supernatants were stored at 4—6°C in the cool room and/or at — 20 °C in the deep freezer.
Analytical procedures
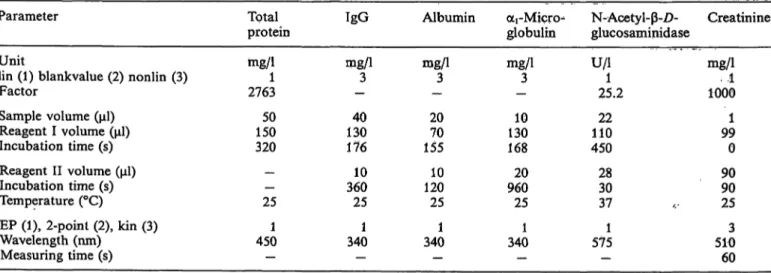
Table l summarizes the parameters for adaptation of the fol- lowing procedures to the Kone Specific Analyser (KONE, Turku, Finnland).
Total protein
Protein was determined by the turbidimetric endpoint proce- dure of Cheung et al. (9), using 0.18 mol/1 trichloroacetic acid and 0.34 mol/1 hydrochloric acid (Merck, Darmstadt, FRG).
Undiluted urine (50 μΐ) was added to 150 μΐ of trichloroacetic acid (reagent 1) and the turbidity signal compared with that of parallel sample using HC1 s reagent 1. The difference was compared with that for the Standard dflution of a control serum (Kontrollogen®-L, Product No. 623118, Behringwerke AG, Marburg, FRG), diluted l: 100 with 155 mmol/1 NaCl. The Standard protein concentration (biuret proced re) was 540 mg/1, resulting in a factor of 2763.
The biuret reaction aftef precipitation with trichloroacetic acid (11) was used s the comparison method.
Materials and Methods Urine samples
Urine samples (10 ml) were coliected in closed polystyrene vials (Greiner, N rtingen, FRG). Preliminary reference ranges were established from 154 second morning urines, voided between 8
Immunoglobulin G
IgG was determined turbidimetrically using the polyethylene- glycol buffer (Product No. D-365, OA1) (reagent I) and anti human IgG serum (reagent II) of Orion Diagnostica, Helsinki, Finland (Product No. 67412/OB2). Calibrator LC-V (Behring- werke AG* Marburg, FRG) was used s Standard. A calibration
Tab. 1. Instrumental settings for determination of the urine analytes on the Kone Specific Analyser.
Parameter
Unitlin (1) blankvalue (2) nonlin (3) Factor
Sample volume (μΐ) Reagent I volume (μΐ) Incubation time (s) Reagent II volume (μΐ) Incubation time (s) Temperature (°C)
EP (1), 2-poinl (2), kin (3) Wavelength (nm)
Measuring time (s)
Total protein mg/11 2763
15050 320
—— 25 4501
—
IgG mg/13
— 13040 176 36010 25 3401
—
Albumin njg/1
-3 2070 155 12010 25 3401
—
oti-Micn>
globulin mg/13
- 13010 168 96020 25 3401
—
N-Acetyl- -Z)- glucosaminidase U/l1
25.2 11022 450 2830 37 5751 -
Creatinine rng/1 1ΌΟΘ..1 991 0 9090 25 5103 60 J. Clin. Chem. Clin. Biochem. / Vol. 27,1989 / No. 9
Hofmann and Guder: Quantitative analysis of proteinuria
591
curve was constructed using concentrations of l, 3, 10, 30 and 100 mg/l respectively by dilution of the Standard with 155 mmol/1 NaCl. Radial immunodiffusion (IgG LC, Behringwerke AG, Marburg, FRG) was used äs the comparison mcthod.
Albumin
Albumin was measured turbidimetrically äs described earlier (12) using polyethyleneglycol (reagent 1) and anti human al- bumin (reagent 2) from Orion Diagnostica (Helsinki, Finnland, Product No. D748/ND1). The instrumental settings taken from the previous publication are summarized for comparison in table 1. Radial immunodiffusion served äs the comparison method (albumin VLC, Behringwerke AG, Marburg, FRG).
OLi-Microglobulin
The procedure for quantifying oti-microglobulin was also adapted by using polyethylene glycol (reagent 1) from Orion Diagnostica (Helsinki, Finland) and anti human ai-micro- globulin (reagent 2) from DaKoPatts, Kopenhagen, Denmark (Product No. A256/013). For preparation of the Standard curve, a protein Standard urine concentrate (Product No. DUUM 02/
03/049802M, Behringwerke AG, Marburg, FRG), calibrated by radial immunodifTusion, was diluted to concentrations of 7, 14,28, 57, 114 mg/1.
Radial immunodiffusion (Behringwerke AG, Marburg, FRG) was used äs the comparison method. ocrMicroglobulin in serum was measured with the same analytical Programme by diluting sera l: 10 with 155 mmol/1 NaCl.
N-acetyl-ß-D-glucosaminidasel)
The tubular enzyme activity was measured with 3-cresolsulpho- nephthaleinyl-N-acetyl-ß-D-glucosaminide (13), using a test kit purchased by Boehringer, Mannheim, FRG. Urine (22 ) was mixed with 110 reagent l consisting of 2.75 mmol/1 Substrate and 3.07 mmol/1 boräx in 50 mmol/1 potassium citrate buffer, pH 4.75. After 450s incubation at 37 °C the reactipn was stopped with 28 Na2CO3 (1.5 mol/1) and the absorbance read at 575 nm after an additional 30 s. A reagent blank was run in each series using H2O äs sample. This blank value was sub- stracted from all samples. The factor was calculated using the molar lineic absorbance of 4070 m2 - mol"1 for the reaction product under the chosen conditions. This method was com- pared with the manual procedure and with the method em- ploying sample preparation äs described by Maruhn et al.
(8,14). The manual procedure was also compared with the Epos Analyser (Eppendorf, Hamburg, FRG) adaptation pub- lished previously (8).
Creatinine in urine
Creatinine was measured with the kinetic Jaffe reaction adapted to the Kone Specific Analyser with undiluted urine, using the reagents prepared for the mechanised version on Hitachi 705 (Boehringer, Mannheim, FRG). Urine (l ) was mixed with 99 picric acid reagent (reagent 1) and 90 NaOH (reagent 2) and the absorbance at 510 nm was read after 90 s of incu- bation at 25 °C using the kinetic mode over 60 s. This method was compared with the automated procedure adapted to the Hitachi 705 using l: 20 diluted urine samples.
Control materials
Intra-assay atid inter-assay precision were detennined with Pre- cipath U (Boehringer, Mannheim, FRG) diluted with 155 mmol/1 NaCl (total protein, IgG, albumin), protein Standard urine concentrate (Behringwerke AG, Marburg, FRG) (armi-
croglobulin), N-acetyl-glucosaminidase Standard (Boehringer, Mannheim, FRG) (N-acetyl-ß-£>-glucosaminidase) and Uri- chem (Urine Chemistry Control, Human Level II) (Fisher Sci- entific, Orangenburg, NY, USA). Accuracy was measured with Spinal Fluid Control, Pool 150 (Fisher Scientific, Orangenburg, NY, USA), Precipath U (Boehringer, Mannheim, FRG) and Hitachi-calibrator (Boehringer, Mannheim, FRG), diluted l: 100 with 155 mmol/1 NaCl (total protein), Seroquant (Beh- ringwerke AG, Marburg, FRG) and Precipath U (Boehringer, Mannheim, FRG), diluted l :200 with 155 mmol/l NaCl (IgG), Spinal Fluid Control, diluted l: 2 and Kontrollogen LP (Beh- ringwerke AG, Marburg, FRG), diluted l: 200 with 155 mmol/1 NaCl (albumin). No materials with target values were available for Qti-microglobulin and N-acetyl-ß-£>-glucosaminidase.
Statistical evaluation
Analytical intra-assay and inter-assay precision were calculated äs described by Keller (l 5).
The procedure to quantify intra- and inter-individual variability described by Keller (15) for normal distributed values was modified for non-normal distributed results. For the calculation of the intra-individual variability, samples voided on 5 consec- utive days from each of 31 normal persons were used. Individual variability was calculated from the equation:
(x - x) intraindividual variability x 100, where
!) Enzyme: N-acetyl-ß-JP-glucosanainidase (EC 3.2.1.30) J. Clin. Chem. Clin. Biochem. / Vol. 27,1989 / No. 9
x = measured individual value, n = number of independent samples, x = median of results of one individual.
For the calculation of inter-individual variability one day of 5 was selected at random and the results for that day analysed äs described above. Preliminary reference ranges were inde- pendently derived from the results of 154 urines of 31 individ- uals by determination of the 95 percentile.
Statistical significance was tested by the paired signed rank test of Wilcoxon, Mann & Whitney (16). Linear regression analysis was performed using the least square analysis method (16). In addition, the general regression procedure described by Bablok et al. was applied using the MS-DOS program version provided by these authors (17).
Results
Adaptation of methods
The aim of the present study was to adapt a combi- nation of türbidimetric and kinetic photometric pro- cedures at 25 °C, and an enzyme activity determina- tion at 37 °C to a single analyser. Using the settings summarized in table l this was realised on a Kone Specific Analyser. Twenty five undiluted urine samples can be performed in l hour. As shown in table 2 the detection limits were in the lower normal ränge for IgG (l mg/1) and albumin (4 mg/1), while the detection limits for total protein and N-acetyl-ß-£>-glucosamin- idase were 10 mg/1 and l U/l respectively. Linearity was obtained up to a concentration ten times the upper normal limit. To exclude antigen excess äs a possible source of error, test strip positive samples
592
Hofmann and Guder: Quantitative analysis of proteinuria Tab.2. Detection and linearity limits of the methods used to measure urine analytes.Analyte Unit
Detection limit Linearity limit
Total Protein mg/1 450010
IgG mg/1 1001.0
Albumin mg/1 3504.0
oti-Mücro- globulin mg/1 1141.0
N-Acetyl-ß-Z)- glucosaminidase U/l
601.0
Creatinine mmol/1 44.90.09
.· f
with a total protein concentration above 300 mg/1 were also measured in a l: 10 dilution with 155 mmol/1 NaCl. At protein concentrations above 4500 mg/1 a dilution of l: 20 had to be applied. The recovery of Standards diluted in this way was between 95 — 105%
for all proteins measured.
Analytical precision and accuracy
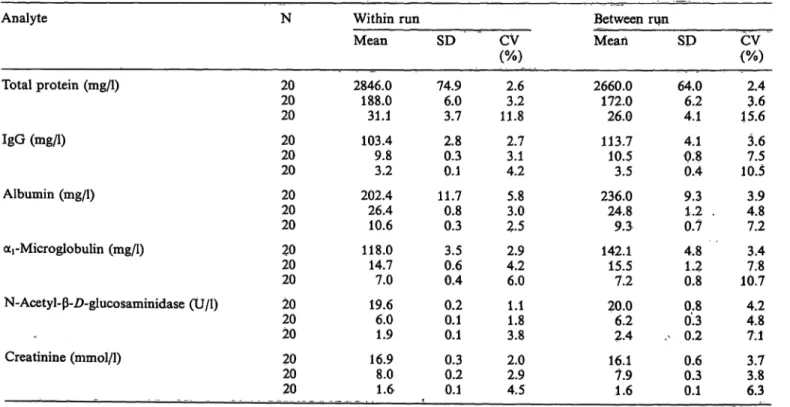
The intra-assay and inter-assay precisions are sum- marized in table 3.
Intra- and inter-assay precision for the proteins were in the usual ränge for automated nephelometric pro- cedures, i.e. between 2.5 and 11.8%. Intra-assay Var- iation for N-acetyl-ß-Z>-glucosaminidase was less than 4%, and inter-assay precision slightly higher. CV's at the upper normal level were about twice äs high äs those in the pathological ränge.
Accuracies measured with various control materials are summarized in table 4. The deviation was between l and 13% for total protein, IgG and albumin, i.e.
no higher than the two-fold Standard deviation of day
to day precision, although the methods used for de- termination of the target values were not the same.
No materials with target values were available for oti- microglobulin and N-acetyl-ß-D-glucosaminidase ae- tivity.
Correlation with comparison methods
Figure l compares the results for the analysis of unselected urines, using established Standard methods and using the present method. In general, the linearity of the present method exceeded that of the compari- son method with no significant deviation öf the re*
sults. Conversion fäctors were between 0.92 and 1.11, independent of the regression forimila applied (17), with correlation coefficients between 0.980 and 0.994.
The N-acetyl-ß-Z)-glucosaminidase method of Nato et al. (13), where gel filtration öf urine to remove inhibitors is not necessary, showed a good correlation with the method of Maruhn (14) (r = 0.994). The activities measured with the Kone Specific Analyser (or Epos Analyser), however, were almost only half of those obtained by the method of Maruhn.
Tab. 3. Analytical precision of automated procedures for urine analytes.
Analyte
Total protein (mg/1)
IgG (mg/1)
Albumin (mg/1)
ocrMicroglobulin (mg/1)
N-Acetyl-ß-D-glucosaminidase (Ü/l) -
Creatinine (mmol/1) . ._
N
2020 20 2020 20 2020 20 2020 20 2020 20 2020 20
Within run Mean 2846.0
188.0 31.1 103.4 9.83.2 202.4 26.410.6 118.0 14.77.0 19.66.0 1.9 16.98.0 1.6
SD 74.96.0
3.7 2.80.3 0.1 11.70.8 0.3 3.50.6 0.4 0.20.1 0.1 0.30.2 0.1
CV (%)
2.63.2 11.8 2.73.1 4.2 5.83.0 2.5 2.94.2 6.0 1.11.8 3.8 2.02.9 4.5
Between run Mean 2660.0
172.0 26.0 113.7 10.53.5 236,0 24.89.3 142.1 15.57.2 20.06.2 2.4 16.17.9 1.6
SD 64.06.2
4.1 4.10.8 0.4 9.31,2 . 0.7 4.81.2 0.8 0.80.3 . 0.2 0.60.3 0.1
CV (%)
2.43.6 15.6 3.67.5 10.5 4.83.9 7.2 3.47.8 10.7 4.24.8 7.1 3.83.7 6.3
J. Clin. Chem. Clin. Biochem. / Vol. 27,1989 / No. 9
Hofmann and Guder: Quantitative analysis of protcinuria 593 Tab. 4. Accuracy of automated procedures for urine analytes.
Analyte
Total protein
IgG Albumin
Material
Spinal Fluid Control Precipath U (1 : 100) Hitachi Cal. (1 : 100) Seroquant (1 : 200) Precipath U (1 : 200) Spinal Fluid Control (1 : 2) Kontrollogen LP (1:200) Beckman Cal. (1 : 200)
Method used for target value
Trichloroacetic acid 30; 125 g/l Biuret
Biuret RIDturbidimetric electrophoretic*
Bromocresylgreen nephelometric
Target value mg/1 570575 520 6145 197200 210
Result mg/1 588571 532 6351 206205 211
Difference mg/1 184 12 26 95 1
Deviation
% + 3.2 - 0.7 + 2.3 + 3.3 4-13.3 + 4.6 + 2.5 + 0.5 electrophoretic analysis (agarose gel), calculation based upon a total protein of 580 mg/1
Stability of urine analytes
The stability of the urine analytes was measured at 4 °C and —20 °C over 20 days. No significant changes were found for albumin and ocrmicroglobulin (18) over 7 days at 4 °C and 20 days at -20 °C. In ac- cordance with previous reports of others (19), N- acetyl-ß-D-glucosaminidase activity was stable over more than 7 days at both temperatures. Only IgG showed a decrease (up to 30%), when measured in samples stored frozen, whereas no change was found at 4 °C (18). Samples were therefore stored at 4-6 °C for up to 7 days, if determinations were not performed on the same day.
Biological variability and reference ranges The biological variability calculated from second morning urines on 5 consecutive days was studied in 31 normal persons. The intra- and inter-individual biological variabilities obtained are summarized in table 5. It can be seen that the biological inter- and intra-individual variability were much lower if the
values were related to creatinine. Inter-individual var- iability was between 1.8 and 2.2 times higher than intra-individual variability. N-Acetyl-ß-£>-glucosa- minidase exhibited the lowest biological variability, followed by aj-microglobulin, albumin, IgG and total protein.
The preliminary 95% limits were:
second morning urine
total protein:
6.3 g/mol creatinine (55.7 mg/g creatinine) IgG:
0.77 g/mol creatinine (6.8 mg/g creatinine) albumin:
1.34 g/mol creatinine (11.8 mg/g creatinine) -microglobülin:
1.49 g/mol creatinine (13.2 mg/g creatinine) N-acetyl-ß-Z>-glucosaminidase:
0.47 kU/mol creatinine (4.2 U/g creatinine)
Tab. 5. Biological variability pf analytes in urine.Intra-individual Inter-individual
Total ,protein IgGAlbumin oci-Microglobulin N-Acetyl-ß-/)-
glucosamimdase Creatinine
per 1 3629 2926 16 20
per mol per 1 creatinine
3325 2220 13
7169 7171 36 50
per mol creatinine 7244 4344 29
Intra- und intei>individual variabilities were calculated äs de- scribed in the methods seetion. The results given represent the raeans of deviatiön äs percent of the median of all determina- tions.
serum
oti-microglobulin:
25-100 mg/1.
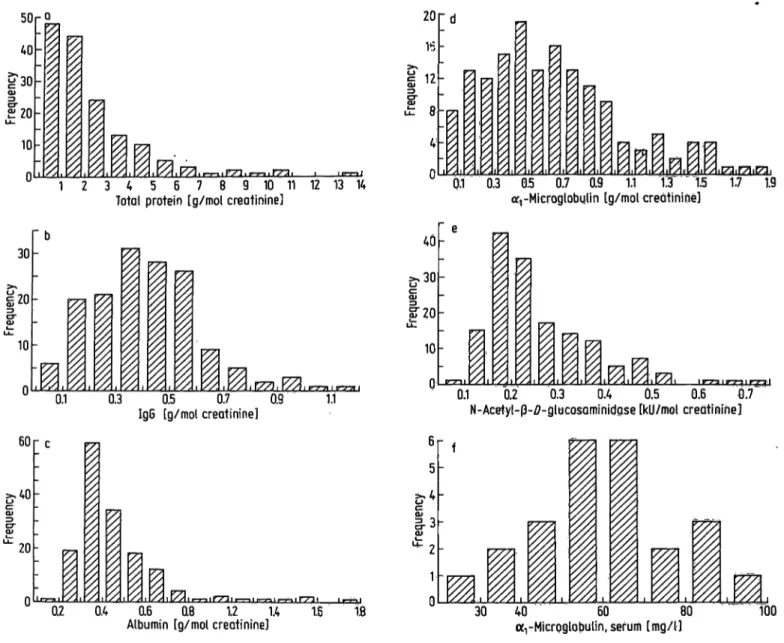
Because nearly all analytes showed an asymmetric distribution pattein with a tailing (fig. 2), a somewhat higher "normal" limit is suggested
total protein:
7.9 g/mol creatinine (70 mg/g creatinine) IgG: 1.13 g/mol creatinine (10 mg/g creatinine) albumin:
2.26 g/mol creatinine (20 mg/g creatinine)
J. Clin. Chem. Clin. Biochem. / Vol. 27,1989 / No. 9594
Hofmann and Glider: Quantitative analysis of proteinuria5000p 150
0 1000 2000 3000 4000 5000 Total protein (manual biuret procedure) [mg/1]
100
g1 50
0 50 100 150 a-j-Microglobulin (radial immunodiffusion) [mg/U 150 r
,100
50
50 100
IgG (radial immunodiffusion) [mg/l] 150
- 30
§' 20
CLJ. 10
KONE
10 20 30 40 N-Acetyl-ß-ö-glucosaminidase [U/l]
350 300
| 250
*>^
1Ü 200 TDJO
P 150
l 100
50
30
50 100 150 200 250 300 Albumin (radial immunodiffusion) [mg/l] 350
20
10
10 20
Creatinine (HITACHI) [mmol/l] 30
Fig. \. Comparison of resiüts from the present analytical procedures with those from established comparison methods.
20-74 unselected urines were analysed with the present programme and with the comparison methods (in brackets).
Linear regression was calculated by the method of least squares (16) and by the method of Bablok et al. (17). The arrows indicate the concentration at which samples were diluted.
J. Clin. Chem. Clin. Bioehem. / Vol. 27,1989 / No. 9
Hofmann and Guder: Quantitative analysis of proteinuria 595
ai-microglobulin:
1.58 g/mol creatinine (14 mg/g creatinine) N-acetyl-ß-D-glucosaminidase:
0.56 kU/mol creatinine (5 U/g creatinine).
No significant differences were observed between males and females.
Comparison between second morning urine and 24 hour urine
In view of the large variability of urine composition, the present parameters were measured in normal per- sons in spontaneous urine samples (second morning urine voided between 8 — 10 a. m.) and the results compared with those from a 24 hour urine sample collected on the same day.
Table 6 summarizes the results obtained in 13 normal persons.
When tested with the paired signed rank test of Wil- coxon, Mann & Whitney (16) no significant differences between analyte concentrations in second morning urine and 24 h urines were found for total protein, IgG and albumin, whereas -microglobulin and N- acetyl-ß-Z>-glucosaminidase activity exhibited signifi- cant differences.
When related to creatinine the differences between the two urines were no longer significant except in the case of o^-microglobulin.
Use of the new diagnostic program äs screen- ing procedure
In order to test the diagnostic Utility of the present Programme, 67 unselected urines from a daily routine were analysed and the results compared with the
results of the usual test strip procedure. The results are summarized in table 7a,bc. As can be seen, 13 out of 67 (19%) gave a positive test strip result for proteinuria. When analysed with the present analyti- cal Programme, 37 out ot 67 urines (55%) gave at least one result outside the normal ränge. All five assays revealed nearly the same number of positive answers. Of the 28 urines with an elevated albumin only 12 gave a positive test strip result for protein.
Of these 28 urines, 25 exhibited a simultanous eleva- tion of IgG, 21 of aj-microglobulin and 20 of N- acetyl-ß-Z>-glucosaminidase. Total protein was ele- vated together with albumin in 24 out of 28 urines.
Twenty eight urines showed an elevated N-acetyl-ß- Z>-glucosaminidase activity. All the other analytes were also elevated in 71 —76% of these urines. Only 36% of the urines showing increased N-acetyl-ß-Z)- glucosaminidase gave a positive protein test strip re- sult.
When albumin and N-acetyl-ß-£>-glucosaminidase were combined, 36 urines exhibited at least one po- sitive result outside the normal ränge. This combi- nation provided the highest rate of recognition of glomerular and tubular dysfunction. In comparison, only 33 urines exhibited an elevation of total protein and/or N-acetyl-ß-Z>-glucosaminidase, 33 showed an elevation of albumin and/or aj-microglobulin, and 30 showed an elevation of total protein and/or albumin.
The number for other combinations was less than 30.
In order to test the diagnostic Utility of the present prograinme for excluding haematuria and leukocy- turia, the results were compared with those of the respective test strip field (tab. 7c).
Eighteen urines were positive for the blood test strip.
In 17 of these urines IgG was elevated. Similarly high numbers of positives were found for total protein and albumin.
a. total protein (manual biuret procedure) linear regression: n = 22; r = 0.994
y = -35 4- 0.92x Bablok et al.: y = -41 4- 0,93x b. IgG (radial immunodiffusion method)
linear regression: n = 20; r = Q.986 y = -0.6 4- 1.07x Bablok et al,: y = -1.1 + l.OSx c. albumin (radial immunodiffusion method)
linear regression: n = 30; r = 0.992 y = -1.3 4- l.Olx Bablok et al.: y = -^1.8 4- 1.02x d. armicoglobulin (radial immunodiffusion method)
linear regression: n = 40; r = 0.980 y= -1.8 + l.llx Bablok et al.: y = -2.5 4- 1.14x
e. N-acetyl-ß-/>-glucosaminidase. The present method was compared with a previously published adapta- tion of the Noto procedure (13) to the Epos analyser, which was also compared with the manual method of Maruhn et al. (14) using nitrophenyl derivatives äs Substrate, with gel filtration (8).
Epos/Maruhn linear regression: n = 59; r = 0.994
y = 0.15 + 0.42x Bablok et al.: y = 0.11 H- 0.42x
Epos/Kone linear regression: n = 73; r = 0.999
y = 0.01 + 0.94x Bablok et al.: y = 0.01 H- 0.94x f. creatinine (Jaffe kinetic, Hitachi 705, using l: 20
diluted urine samples)
linear regression: n = 74; r = 0.991 y = 0.20 + 0.94x Bablok et al.: y = 0.12 4- 0.95x J. Clin. Chem. Clin. Biochem, / Vol. 27,1989 / No. 9
596
Hofmann and Guder: Quantitative analysis of proteinuria 5040
£30α>
u-£20 10
Γ|
r°
„-
- ty
^
^
I,
U 1 2 3 4 5 6 7 8 9 10 11 12 13 14
Total protein [g/mol creatinine]
20 15.
12 θ 4 η
• d -
1 1 I z
Eχ
^
.Λi I
7y! I I I I ·
0.1 0.3 05 0.7 0,9 1.1 1.3 "Ί.5 1.7 1.9 arrMieroglobulin [g/mol creatinine]
30 20 10
n
" b _
-
1 1
77!I
\\/Λ\{/Λ\ Ϊ7Ά\ Υ/Α\Γ-τ-Λ\ν-7-*\l/Xvl Ixvd r//!0.1 0.3 0.5 0.7 0.9 1.1 IgG [g/mol creatinine]
40
&30
CQJ LL.ΪΓ20
10 n
" e
j
V,
l I II.·.
s·
60
20
Q
• c
•
i ι
^ 1
* I 1
0.2 0.4 0.6 Q8 1.2 1.4 1.6 1fl
Albumin [g/mol creatinine]
0.1 0.2 0.3 0.4 0.5 0.6 0.7 N-Acetyl- -ZJ-glucosaminidase [kU/mol creatinihe]
f
30 40 60 80 100
[mg/l]
Fig. 2. Distribution of results in urines and sera from a normal population.
154 second morning urines and 31 sera from 31 normal persons (see methods for age and sex distribution) were analyzed with the procedures described in the methods section and the results expressed in relation to the creatinine concentration in the same sample.
Analyte N Medi n 95th percentile
a. Total protein (g/mol creatinine) b. IgG (g/mol creatinine)
c. Albumin (g/mol creatinine)
d. ott-Microglobulin (g/mol creatinine)
e. N-acetyl- -D-glucosaminidase (kU/mol creatinine) f. αι-Microglobulin, serum (mg/1)
154153 154154 15424
0.41.6 0.950.59 600.22
6.30.77 1.341.49 860.47
a
rMicroglobulin and N-acetyl- -Z>-glucosaminidase activity were raised in 14 and 13 cases respectively.
The leukocyte test strip was positive in 32 urines.
Nine of these urines showed no positive result outside the reference ranges in the present programme. Total protein and N-acetyl- -Z)-glucosaminidase were raised in 18 urines (56%), albumin and oc
rmicroglob- ulin in 19 cases (59%) and IgG in 21 (66%).
Discussion
The present st dy was performed to establish a fully automated programme fof scfeening and differentia- tion of proteinuria in a routine laboratory. The ana^
lytes chosen allow the recognition of all types of
glomerular and tubulaf proteinuria. In contrast, the
test strip prpcedure for screening for proteinuria, al-
though relatively specific for albumin, detects this
J. Clin. Chem. Clin. Biochem. / Vol. 27,1989 / No. 9Hofmann and Gudcr: Quantitative analysis of proteinuria 597 Tab. 6. Comparison of excretion rates in second morning and 24 h urine from 13 normal persons.
Second morning urine 24 hour urine
median ränge median ränge
IgG
mg/1 5.2 2.6-11.3 g/mol creatinine 0.42 0.22-1.00 Albumin
mg/1 10.5 <4-18.4 g/mol creatinine 0.65 < 0.45 -1.11
,-Microglobulin
mg/1 10.2 4.5-34.8 g/mol creatinine ' 0.99 0.22 -1.74 N-Acetyl-ß-/)-glucosaminidase
U/l 3.6 1.2-6.3 kU/mol creatinine 0.25 0.11 - 0.48 Creatinine
mmol/1 14.9 3.0-25.8
3.80.25
0.535.8
8.20.65
2.90.28
10.9
1.1-10.4 0.13-0.64
< 0.45-1.05 2.4-30.4 0.27-1.89
1.7-5.8 0.18-0.40 6.8-16.1
Bias Total protein
mg/1g/mol creatinine 311.7 10-55
1.1-10.9 11 <10-20
<1.1 <1. 1-1.8 4-20 -h 1.4 + 0.17 + 4.7 + 0.12 + 2.0*
-l· 0.34**
+ 0.7**
- 0.03 + 4.0
* = 0.001
** = 0.05
Excretion of the analytes was measured in second morning and 24 h urine samples on the same day. Statistical significance of difTerences (bias) was tested by the paired signed test of Wilcoxon, Mann & Whitney (16).
protein at an excretion rate 10 times above normal (l, 3, 4). In addition prerenal and tubular proteinuria are not detected by the protein-error-of-indicator principle (l, 4). The polyacrylamide gel electropho- resis technique, which separates proteins according to their relative molecular mass, was therefore propa- gated to detect and differentiate these different forms (5, 6, 7). In fact when applied in a screening pro- gramme many more prpteinurias were detected, pri- marily of the tubular type (20).
In contrast to this technique, the presently used quan- titative measurement of characteristic proteins gives additional Information abput the degree of tubular and glomerular proteinuria. The present programme of analytes was choseii to combine the sensitivity of the electrophoretic procedure with the advantages Pf quantification and automation. In addition, by in- cluding the automated measurement öf N-acetyl-ß-D- glucosaminidase and creatinine, the present profile yields rriPre Information than previously süggested regimes. The automated assay of N-acetyl-ß-D-glu- cpsaminidase was proposed äs a screening procedure by fucker et al. (21).
Polyacrylamide^gel-electrophoresis seems more suit- able only for the detection of prerenal proteinuria such äs myoglobinuria and Bence-Jones-proteirmna,
(22). Recent experience with urines of patients with monoclonal gammopathies (23) has shown that these forms can be recognized from the discrepancy between total protein and albumin, and that they simultane- ously exhibit an elevated N-acetyl-ß-D-glucosamini- dase activity and o^-microglobulin concentration (24).
Biological Variation of urinary proteins Other investigators have reported the biological day to day Variation of urinary analytes. Thus Hemming- sen & Skaarup (25) found that albumin varied day to day by 31%, IgG by 26%, and lysozyme by 36%. In studies on 24 h urines Bingham et al. (26) found intra- individual variations for urine analytes between 10.7% (creatinine) and 30.5% (sodium). For albumin, measured in urines of normal persons, Viberti et al.
(27, 28) found ä large intra-individual Variation, which was pnjy slightly less when related to creatinine.
Calculation of urinary enzyme activities, in relation to creatinine reduced the intra-individual variabilities (29, 30, 31). Our present results confirm and extend these pbservations. When compared with concentra- tions, excretion rates related to creatinine showed slightly but significantly lower biological variations.
This may however limit the diagnostic value in situ-
J. Clin. Chem. Clin. Biochem. / Vol. 27,1989 / No. 9
598
Hofmann and Guder: Quantitative analysis of proteinuria Tab. 7. Comparison of present analytical profile with test strip procedure for screening unselected urines.a) Total results n = 67 Positive Negative
Protein test strip 1354
Blood 4918
Leuko- cyte 3235
Glucose 643
Total protein 4126
IgG 2839
Albu- min 2839
oti-Micro- globulin 4126
N-Acetyl-;ß-£>- glucosaminidase 2839
b) Urines with increased albumin and N-acetyl-ß-jD-glucosaminidase excretion 1. albumin > 2.26 g/mol creatinine (20 mg/g creatinine)
n = 28 Positive Negative
Total protein 244
IgG 253
Oi-Micro- globulin 217
N-AcetyUß-i)- glucosaminidase 208
Protein test strip 1216
2. N-Acetyl-ß-Z>-glucosaminidase > 0.56 kU/mol creatinine (5 U/g creatinine)
n = 28 Total protein IgG Albumin oci-Microglobulin Protein test strip
Positive
Negative 217 22
6 20
8 22
6 11
17 3. Combination
albumin > 2.26 g/mol creatinine (20 mg/g creatinine)
and N-acetyl-ß-jD-glucosaminidase > 0.56 kU/mol creatinine (5 U/g creatinine) n = 36
Positive Negative
Total protein 2610
IgG 279
Albumin 2810
-Micro- globulm 2412
N-Acetyl-ß-i)- glucosarainidase 2810
Protein test strip 2115
c) Urines with positive blood and/or leukocyte test strip field 1. blood test field positive
n = 18 Total protein IgG
2. leukocyte test field positive
n = 32 Total protein IgG
Albumin
Albumin
cci-Microglobulin
glucosaminidase Positive
Negative 162 17
1 16
2 14
4 13
5
(Xi-Microglobulin N-Acetyl-ß-D- glucosaminidase Positive
Negative 1814 21
11 19
13 19
13 18
14
ations where urine creatinine is highly variable, äs in pediatric urines (32), athletes (Hofmann, W., Beuker, F. & Guder, W. G. unpublished observations) and in acute renal failure (33). As expected, the intra-indi- vidual variability was much lower than the inter- individual variability. Compared with the biological Variation of serum parameters (34), the variability for urinary parameters was much higher. This can be expected for an open System like urine where many
niore physiological influences, like fluctuating filtra- tion rates, changing reabsorption arid catabolism must be considered.
Remarkably the biological variability for iSf-acetyl-ß-
£)-glucosaminidase was only half of thät öf the other proteins. This might be explained by the fact thät IgG, albumin and a^microglobulin are filtered in varying amoünts through the glomerülar basal mem-
J. Clin. Chem. Clin. Biochem. / Vol. 27,1989 / No. 9
Hofmann and Guder: Quantitative analysis of proteinuria 599
brane. Haemodynamic factors like blood pressure and different reabsorption rates of high and low molecular weight proteins influence the excretion rates of these tested proteins (20). In contrast N-acetyl-ß-Z)-glucos- aminidase is added to the urine by the turnover of cells. This process has been shown to proceed period- ically (35).
Selection of sample
For qualitative sereening purposes the first morning urine is generally used, whereas 24 h urine sampling is suggested for quantitative urine determinations (36). With regard to urine protein and enzyme activity determination, no uniform recommendations exist in the literature (19, 27, 29, 35, 37).
Our observation that second morning urine and 24 h urine showed no significant differences when results were related to creatinine makes it possible to substi- tute the 24 h urine for the second morning urine. This circumvents the problem of quantitative urine collec- tion (26). The second morning urine has additional advantages because of its higher practicability in am- bulatory sereening. Sauer et al. (38), Gatling et al.
(39) and Watts et al. (40) showed, for diabetics, that morning urine has the same diagnostic efficiency for the recognition of microalbuminuria äs an overnight or twenty-four hour urine. Jung & Schulze (30), Bur- chardt et al. (35) and Schulze & Goebel (41) reported investigations on the determination of urine enzyme activities in second morning urine related to creati- nine. According to their conclusion, inactivation of enzymes could be avoided and different excretion rates corrected.
Application of the present programme äs a sereening procedüre
Application of the present programme äs a sereening procedüre resulted in the expected higher number of positive results. These additional "positives" were
mainly due to albuminuria below the detection limit of the test strip, tubular proteinurias and urines with increased N-acetyl-ß-£>-glucosaminidase activity and IgG excretion. Albumin and N-acetyl-ß-D-glucosa- minidase, when used äs the only criteria, were able to detect 97% of all urines positive in one of the analytes quantified. Therefore these two parameters seem to be sufficient for excluding clinically relevant glomer- ular and tubular forms of proteinuria.
From the other test strip procedures only the leuko- cyte test field resulted in additional positive answers, whereas more than 90% of urines with haematuria exhibited at least one result outside the reference ränge when the present profile was applied. As a preliminary conclusion it seems advisable to add a test for leu- kocytes to the present profile to exclude infectious diseases of the urinary tract.
Future aspects and conclusions
The present programme seems to be sufficiently sen- sitive for the detection of all clinically relevant types of glomerular and tubular proteinuria. To differen- tiate between prerenal and renal types of proteinuria the present concept has to be tested in special patient groups. By setting the decision limits outside the nor- mal ränge, it is possible to differentiate and monitor various forms of clinical nephropathies. In addition, ratios between the measured analyte concentrations may be used diagnostically; such ratios have already beeen successfully applied in the analysis of liver dis- eases (42) and spinal fluid analysis (43). As long äs 23 years ago, Cameron & Blandford proposed the use of analyte ratios in urine analysis (44).
In conclusion the present programme offers the pos- sibility of screening large numbers of urine samples by quantitative analysis with little additional to the work load. Reagent costs can be kept within the ränge of those for routine clinical chemistry procedures by using the present strategy.
References
1. Kutter, D. (1983) Schnelltests in der klinischen Diagnostik.
2. Aufl., Urbän & Schwarzenberg, München, Wien, Balti- more.
2. Weidemann, G. & Guder, W. G. (1986) Harnuntersuchun- gen. In: Nierenkrankheiten 5. Aufl. (Sarre, H. & Gessler, V., eds.) pp. 59-73, Thieme, Stuttgart.
3. Guder, W. G. & Heidland, A. (1986) Urine analysis. J.
Clin. Chem. Clin. Biochem. 24, 611—620.
4. Lorentz, K. & Weiss, T. (1986) Proteinbestimmung im Urin - Eine kritische Übersicht. J. Clin. Chem. Clin. Biochem.
24, 309-323.
5. Boesken, W. H. (1977) Die SDS-PAA-Elektrophorese der Urinproteine: Eine Methode zur Differentialdiagnose der Nephropathien und zur Analyse extrarenaler Proteinurien.
Urologe 77, 140-144.
6. Scherberich, J. E. (1986) Proteinverteilungsmuster im Harn:
wertvolle Hilfe bei der Diagnostik glomerulärer und tubu- lärer Erkrankungen. Bioscientia Bericht Nr. 28.
7. Spieker, C. & Lison, A. E. (1984) Polyacrylamide gel elec- trophoresis (PAGE). Range of possible application in renal medicine. In: Advances in Non-lnvasive Nephrology (Lubec, G. & Campese, A., eds.) pp. 195-198 John Libbey.
J. Clin. Chem. Clin. Biochem. / Vol. 27,1989 / No. 9
600
Hofmann and Guder: Quantitative analysis of proteinuria 8. Hallbach, J., Poppe, W. & Guder, W. G. (1985) An auto-mated procedurc to mcasurc N-acetyl-ß-Z)-glucosaminidase in urine. J. Clin. Chem. Clin. Biochem. 23, 590 (abstract).
9. Cheung, C. K., Mak, Y. T. & Swaminathan, R. (1987) Automated trichloracetic acid precipation method for urine total protein. Ann. Clin. Biochem. 24, 140 — 144.
10. Hofmann, W. & Guder, W. G. (1988) Automatisierung der quantitativen Bestimmung von Harnproteinen und Harn- enzymen zur nephrologischen Stufendiagnostik. Fresenius Z. Anal. Chem. 330, 428-429.
11. Richterich, R. & Colombo, J. P. (1978) Urinprotein, Biuret- Methode. In: Klinische Chemie pp. 566—569, Karger-Ver- lag, Basel.
12. Hofmann, W. & Guder, W. G. (1987) Adaptation eines immunturbidimetrischen Testes zur Albuminbestimmung im Urin an das Analysengerät Kone Progress. Ärztl. Lab.
33, 229-232.
13. Noto, A., Ogawa, Y., Mori, S., Yoshioko, M., Kitakaze, T., Hori, T., Nakamura, M. & Miyake, T. (1983) Simple, rapid spectrophotometry of urinary N-acetyl-ß^D-ghicosa- minidase with use of a new chromogenic Substrate. Clin.
Chem. 29, 1713-1716.
14. Maruhn, D., Fuchs, L, Mues, G. & Boche, K. D. (1976) Normal limits of urinary excretion of eleven enzymes. Clin.
Chem. 22, 1567-1574.
15. Keller, H. (1986) Klinisch-chemische Labordiagnostik för die Praxis, pp. 76-90, Thieme Verlag.
16. Sachs, L. (1982) Statistische Methoden. Springer Verlag, Berlin, Heidelberg, New York.
17. Bablok, W., Passing, H., Bender, R. & Schneider, B. (1988) A General Regression Procedure for Method Transforma- tion. J. Clin. Chem. Clin. Biochem. 26, 783 — 790.
18. Hofmann, W. & Guder, W. G. (1989) Praeanalytische und analytische Faktoren bei der Bestimmung von IgG, Albu- min, tti-Mikroglobulin und Retinol-bindendem Protein im Urin mit dem Behring Nephelometer System (BNS). Lab.
Med. (submitted)
19. Maruhn, D. (1983) Methodische Aspekte der Harnenzym- ologie. Z. Ges. Inn. Med. 38, 557-564.
20. Alt, J. M., Hacke, M., von der Heyde, D. & Stolte, H.
(1983) Urinary protein excretion in interstitial and tubular kidney disease äs characterized by gradient electrophoresis.
Klin. Wochenschr. 61, 641-648.
21. Tucker, S. M., Boyd, P. J. R., Thompson, A. E. & Price, R. G. (1975) Automated assay of N-acetyl-ß-glucosaminl·
dase in normal and pathological human urine. Clin. Chim.
Acta 62, 333-339.
22. Fink, P. C., Engelke, C. & Haeckel, R. (1988) Früherken- nung von Nierenschädigungen durch die Proteinuriediffer- enzierung bei Patienten mit Multiplem Myelom. Lab. Med.
12, 39-50.
23. Fateh-Moghadam, A., Schmidt, D., Hofmann, W. &
Guder, W. G. (1989) Analysis of proteinuria in patients with multiple myeloma (in preparation).
24. Cooper, E. H., Forbes, M. A., Crockson, R. A. & Mac- Lennan, I. C. M. (1984) Proximal renal tubular function in myelomatosis: observations in the fourth medical re- search council trial. J. Clin Pathol. 37, 852-858.
25. Hemmingsen, L. & Skaarup, P. (1975) The 24-hour excre- tion of plasma proteins in the urine of apparently healthy subjects. Scand. J. Clin. Lab. Invest. 35, 347-353.
26. Bingham, S. A., Williams, R., Cole, T. J., Price, C. P. &
Cunnings, J. (1988) Reference values for analytes of 24-h urine collections known to be complete. Ann. Clin.
Biochem. 25, 610-619.
27. Viberti, G. C., Mogensen, C. E., Keen, H., Jacobsen, F. K., Jarrett, R. J. & Christensen, C. K. (1982) Urinary exeretion of albumin in normal man: The effect of water loading.
Scand. J. Clin. Lab. Invest. 42, 147-151.
28. Mogensen, C. E., Chachati, A., Christensen, C. K., Close, C. F., Deckert, T., Hommel, E., KäStrup, J., Lefebvre, P., Mathiesen, E. R., Feldt-Rasmussen, B., Schnetz, A. &
Viberti, G. C. (1985—86) Microalbummuria: An early marker of renal involvement in diabetes. Uremia Invest. 9, 85-^95.
29. Werner, M., Heilbron, D. C., Maruhn, D. & Atoba, M.
(1970) Patterns of urinary enzyme excretion in healthy subjects. Clin. Chim. Acta 29, 437-449.
30. Jung, K. & Schulze, G. (1986) Diuresis-dependent excretion of multiple forms of renal brush-border enzymes in urine.
Clin. Chim. Acta 156, 77-84.
31. Vanderlinde, R. L. (1981) Urinary enzyme measurements in the diagnosis of renal disorders. Ann. Clin. Lab. Sei. 11, 189-201.
32. Burchardt, U. & Miesel, B. (1977) Alaiiinaininopeptida- seausscheidung mit dem Harn in Abhängigkeit von Alter und Geschlecht. Zschr. Inn. Med. 32, 319-322.
33. Kristof, O. (1989) Haraproteine und Harnenzyme beim akuten Nierenversagen. Dissertation, München.
34. Keller, H. (1986) Krankheitsfrüherkennung und Entschei^
dungsgrenzen von klinisch-chemischen Tests. Dt. Ges. Klin.
Chem. Mitt. 17, 2-8.
35. Burchardt, U., Winkler, K., Klagge, M., Balschum, D. &
Barth, A. (1988) Infradian biorhythms of enzymuria in man. J. Clin. Chem. Clin. Biochem. 26, 491 —496.
36. Krieg, M., Gunßer, K. J. & Becker, H. (1986) Vergleichende quantitative Analytik klinisch-chemischer Kenngrößen im 24-Stunden Urin und Morgenurm. J. Clin. Chem. Clin.
Biochem. 24, 863 — 869.
37. Hutchinson, A. S., O'Reilly, D. & MacCuish, A. C. (1988) Albumin excretion rate, albumin concentration and albu- min/creatinrae ratio cornpared for screening diabetics for slight albuminuria. Clin. Chem. 34, 2019 — 2021.
38. Sauer, N. A., Xavier, F. R., Spathis, G. S. & Barron, J. L.
(1988) Screening for microalbuminuria. Ann. Clin.
Biochem. 25, Supplement 99s—100s.
39. Gatling, V, Knight, C. & Hill, R.. D. (1985) Screening for early diabetic nephropathy: Which sample to detect mi- croalbuminuria? Diabetic Medicine 2, 451—455.
40. Watts, G. F., Shaw, K. M. & Polak, A. (1986) The use of random urine to screen for microalbuminuria in the diabetic clinic. Practical Diabetes 3, 86—88.
41. Schulze, G. & Goebel, H. (1988) Harnenzymdiagnostik - ein Vorschlag zur Definition der präanalytischen Bedingun- gen. Z. Med. Lab. Diagn. 29, 381-386.
42. Schmidt, F. W., Schmidt, E. & Chemmtz, G. (1984) Krank- heiten der Leber, pp. 377—473, Urban & Schwarzenberg, München, Wien, Baltimore.
43. Reiber, H. & Felgenhauer, K. (1987) Protein transfer at the blood cerebrospinal fluid barrier and the quantitation of the humoral immune response within the central nervous System. Clin. Chim. Acta 163, 319-328.
44. Cameron, J. S. & Blandford, G. (1966) The simple assess- ment of selectivity in high proteinuria. Lancet //, 242.
Prof. Dr. W. G. Guder Institut für Klinische Chemie Englschalkinger Straße 77 D-8000 München 81
J. Clin. Chem. Clin. Biochem. / Vol. 27,1989 / No. 9