INSTITUTE OFPHYSICSPUBLISHING EUROPEANJOURNAL OFPHYSICS
Eur. J. Phys.24(2003) 297–300 PII: S0143-0807(03)57041-6
Multimedia in physics education:
a video for the quantitative analysis of the Reynolds number
Andreas Wagner, Stefan Altherr, Bodo Eckert and Hans J rg Jodl
University of Kaiserslautern, Department of Physics, Erwin-Schr¨odinger-Straße, 67663 Kaiserslautern, Germany
Received 2 December 2002, in final form 14 January 2003 Published 28 March 2003
Online at stacks.iop.org/EJP/24/297
Abstract
A video of the Reynolds transition experiment, developed for physics teaching, shows the continuous transition from laminar to turbulent flow. Additionally, the critical Reynolds number of the experimental set-up is determined approximately. By looking at it, the user of the video can measure all necessary data and then calculate a result.
(Some figures in this article are in colour only in the electronic version)
The original experiment by Reynolds [1] carried out in 1883 allows one to observe the laminar or turbulent behaviour of a water flow. But existing videos of the Reynolds dye experiment show only the qualitative aspects of this phenomenon [2]. A video ‘Farbfadenversuch nach Reynolds’ developed at the University of Kaiserslautern enables the student to observe this transition of flow behaviour and to determine the critical Reynolds number of a pipe flow as the flow rate is continuously increased during the video experiment.
This topic—ideal/laminar/turbulent flow, Reynolds number, similarity laws—is still taught in the context of fluid mechanics at school and university level, because of its relevance in the curriculum of physics as well as its technical importance (aircraft wings in a flow channel, turbulent flow through tubes).
It is a problem to demonstrate this in an ordinary course at school or university due to experimental difficulties. The experimental procedure may need to be repeated several times due to a badly injected dye. Furthermore, the experimental set-up is sensitive to external vibrations. In addition to set-up and experimentation details, the video contains the theoretical background described by Sommerfeld and data analysis.
Initially the real experimental set-up is described step by step in full detail (figure 1).
One attaches a discharge pipe with an inner diameter 2r horizontally to a vertical water-filled cylinder with an inner diameter of 2R. The flow rate may be varied with a valve at the end of the pipe. For the visualization of the flow behaviour one uses a potassium permanganate solution
0143-0807/03/030297+04$30.00 © 2003 IOP Publishing Ltd Printed in the UK 297
ö
298 A Wagneret al
Figure 1.A schematic sketch of the set-up of the Reynolds number experiment.
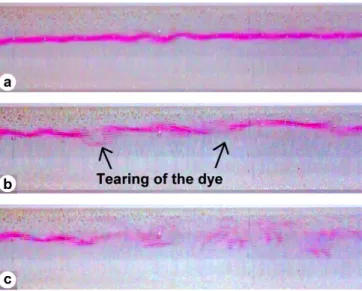
Figure 2. (a) The line of the dye in laminar flow; (b) fluctuations and tearing of the dye liquid at the transition point; (c) unordered movement of the dye in turbulent flow.
as a dye liquid, which is injected centrally into the horizontal pipe. This tube must be as small as possible in diameter (about<1 mm) and well positioned to avoid additional turbulences.
During the experimental procedure we have chosen a modified approach in relation to the literature on fluid dynamics. Instead of leaving the flow rate constant, one continues to open the valve. Thus the flow rate increases continuously and the transition from laminar to turbulent flow is made visible by the dye (figure 2).
Systematic investigations showed that the dimensionless critical Reynolds numberRecr it
gives empirical values for the transition from laminar to turbulent flow. The definition of the Reynolds numberReis
Re=inertia forces/friction forces of the fluid.
At values less than the critical Reynolds numberRecr it, perturbations are damped in the flow by the viscosity of the liquid. Above this number the inertia forces of the particles are larger than the friction forces of the fluid.
A video for the quantitative analysis of the Reynolds number 299
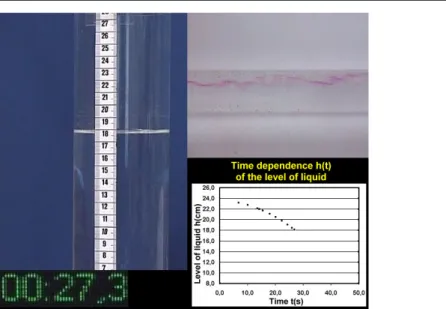
Figure 3.A subdivided view for recording measurements (top left: level of liquid with length scale;
bottom left: time indicator, in seconds; bottom right: measuring points for the time dependence of the level of liquid; top right: pipe flow).
In order to be able to determine the critical Reynolds number of the configuration, we have to measure the changing flow rate, i.e.u(t). The video shows simultaneously the cylinder with the length scale, a real time display, the flow and additionally the measured time dependence of the level of liquid (figure 3) by means of inserts.
Since the transition from laminar to turbulent flow does not happen at a given transition point (first fluctuations, then tearing of the dye liquid, then unordered dye flow), we chose the time at which the dye thread tears off as the initial time.
In this example one can fit the time dependenceh(t)of the level of liquid analytically by a quadratic equation with a relative error of less than 4%. The average flow rateu in the horizontal pipe is given by the conditions of the spatial constant flow rateI. As a result, one obtains the continuity equation:
I =πr2u=πR2 dh(t)
dt .
In order to calculate the critical Reynolds number from the average speeducr itat this transition point, we use the well known equation
Recr it =ρ(2r)ucr it
η
for the ‘infinitely long’ water flow without dye injection in a pipe with circular profile [3]. Here ρis the density of the fluid, 2ris the inner diameter of the discharge pipe,ucr it is the average flow rate at the transition point andηis the dynamic viscosity of the fluid. In our example the critical Reynolds number is approximately 1600. This means a deviation of around 700 compared to the literature value of 2320 in this case [3].
Textbooks on fluid mechanics give the reader the mistaken idea that the transition always occurs at approximately Recr it = 2320 [3]. The reason for this misconception is the clear difference between the Reynolds dye experiment and the derivation of the critical Reynolds number of an infinitely long pipe. As the textbooks describe correctly, the observable transition to turbulent flow depends crucially on the geometry. It is not only the geometry of the pipe that plays a role here. The geometry and quality of the tube used for injection of the dye liquid also
300 A Wagneret al
have an effect. This explains the deviation of the measured critical Reynolds number from the literature value.
Arnold Sommerfeld [4] referred to this deviation in his lectures on theoretical physics.
He stated that the boundaries of the critical Reynolds number can be, for instance, about 1200 (very irregular intake) and 20 000 (good rounding of the inlet).
Further information
The video ‘Farbfadenversuch nach Reynolds’ and further multimedia are available from the authors on CD-ROM for a small charge. Additional information can be found on the Web page of PEN (Physics Education Network, http://pen.physik.uni-kl.de/videos.html).
References
[1] Reynolds O 1883 On the experimental investigation of the circumstances which determine whether the motion of water shall be direct or sinuous, and the law of resistance in parallel channelsPhil. Trans. R. Soc.174935–82 [2] Selected examples are:
Girwidz R 1999 Universit¨at W ¨urzburg–Physik OnlineRepetitorium zur Str ¨omungslehreOnline at http://www.physik.uni-wuerzburg.de/video2/mpeg/Laminar Turbulent.mpg (2002-10-20)
Stewart R W, Friedman J R and Hansard W 1969Turbulence (Cambridge: National Committee for Fluid Mechanics Films) Available in the Media Catalogue of the IWF. Online at http://www.iwf.de
Breuer K S 2000Re-enactment of the Reynolds Transition ExperimentCourtesy of Professor J D Jackson, Curator of the Reynolds Museum, University of Manchester. Parts available in: Stanford University: Multimedia Fluid Mechanics, Cambridge University Press
[3] R¨odel H 1974Hydromechanik7th revised edn (Munich: Hanser)
[4] Sommerfeld A 1992Mechanik der deformierbaren Medien (Vorlesungen ¨uber Theoretische Physik 2)6th edn (Frankfurt am Main: Harri Deutsch) p 105