Supplementary Figure 1. Epithelial FADD and Caspase-8 prevent ileitis. Related to Figure 1
(A) Representative images of ileum sections from mice with the indicated genotypes immunostained for Lysozyme. Scale bar = 100µm. (B) Graph depicting expression of Paneth cell genes in the ileum of mice with the indicated genotypes measured by microarray analysis.
Each dot represents one mouse. Column shows mean. (C) Representative images of ileum sections from 10-12 week old mice with the indicated genotypes stained with H&E or immunostained for CD45. Scale bar = 100µm. (D) Representative images of ileal sections from mice with the indicated genotypes. Arrowheads mark dying epithelial cells. Scale bar = 50µm. (E) Graphs depicting histological ileitis scores for mice of the indicated genotypes. Each dot represents one mouse. Bars represent mean. (F) Cluster heat map showing average expression of genes that were significantly upregulated(cut-off: fold change ≥ ±1.5, p-value
<0.05) in FaddIEC-KO and/or Casp8IEC-KO ileum tissue for the indicated genotypes. Z-scores are shown. **p<0.01, ***p<0.005, ****p<0.0001. Histological images shown are representative of the groups of mice analyzed as indicated in Table S2. All data from 10-12 week-old mice.
Supplementary Figure 2. Increased expression of ZBP1 during colitis development in FaddIEC-KO mice. Related to Figure 2.
(A) Graph depicting TNF mRNA expression measured by microArray analysis in the indicated mice. Each dot represents one mouse. Bars represent mean. (B and E) Images of colon sections from mice with the indicated genotypes stained with H&E or immunostained for CD45. Scale bar = 100µm. (C, D, F and G) Graphs depicting histological colitis scores (C and F) and the percentage of mice with ulcers (D and G) for mice of the indicated genotypes. Each dot represents one mouse. Bars represent mean. (H) Cluster heat map showing the top 25 up or down-regulated genes that best correlate with colitis severity. Each column represents one mouse. Each row represents one gene indicated on the right. Color code: Yellow: high expression, red: low expression. (I) Immunoblot analysis of IEC protein extracts from mice of the indicated genotypes with the indicated antibodies. Each lane represents one mouse.
*p<0.05, ***p<0.005, ****p<0.0001. All data from 10-12 week-old mice. Histological images
Supplementary Figure 3. TNFR1-independent ileitis development in Casp8IEC-KO mice.
Related to Figure 3.
(A) Graph depicting histological ileitis scores for mice of the indicated genotypes. Each dot represents one mouse. Bars represent mean. (B) Representative images of ileum sections from mice with the indicated genotypes stained with H&E or immunostained for CD45 or Lysozyme. Scale bar = 100µm. (C) Graph depicting histological ileitis scores for mice of the indicated genotypes. Each dot represents one mouse. Bars represent mean. (D) Graph depicting histological ileitis scores for mice of the indicated genotypes. Each dot represents one mouse. Bars represent mean. (E) Representative images of ileum sections from mice with the indicated genotypes stained with H&E or immunostained for CD45 or Lysozyme. Scale bar = 100µm. (F) Graph depicting mRNA levels of the indicated genes in wild type colon and ileum tissue samples measured by microArray analysis. Each dot represents one mouse.
*p<0.05, **p<0.01, ****p<0.0001. All data from 10-12 week-old mice. Histological images shown are representative of the groups of mice analyzed as indicated in Table S2.
Supplementary Figure 4. RIPK3 promotes cleavage of Caspase-8 downstream of TNFR1, ZBP1 and TRIF. Related to Figure 6.
(A) Images of ileum sections from old mice with the indicated genotypes stained with cleaved Caspase-8 (CC8). Arrowheads indicate CC8+ cells. Scale bar = 100µm. (B) Graph depicting percentage of crypts with CC8+ cells on ileum sections of mice with the indicated genotypes.
Each dot represents one mouse. (C) Graph depicting histological ileitis scores for mice of the indicated genotypes. Each dot represents one mouse. Bars represent mean. (D) Images of ileum sections from mice with the indicated genotypes stained with H&E or immunostained for CD45 or Lysozyme. Scale bar = 100µm. *p<0.05, **p<0.01, ***p<0.005, ****p<0.0001. All data from 10-12 week-old mice. Histological images shown are representative of the groups of mice analyzed as indicated in Table S2.
Supplementary Figure 5. ASC-independent ileitis in FaddIEC-KO and FaddIEC-KO Mlkl-/- mice. Related to Figure 6.
(A) Images of ileum sections from mice with the indicated genotypes immunostained for ASC.
Scale bar = 10µm. (B) Graph depicting histological ileitis scores for mice of the indicated genotypes. Each dot represents one mouse. Bars represent mean. (C) Images of ileum sections from mice with the indicated genotypes stained with H&E or immunostained for CD45 or Lysozyme. Scale bar = 100µm. (D) Graph depicting histological ileitis scores for mice of the indicated genotypes. Each dot represents one mouse. Bars represent mean. ****p<0.0001.
(E) Images of ileum sections from mice with the indicated genotypes stained with H&E or immunostained for CD45 or Lysozyme. Scale bar = 100µm. (F) Immunoblot analysis of primary IEC protein extracts from mice of the indicated genotypes with the indicated antibodies. Each lane represents one mouse. All data from 10-12 week-old mice. Histological images shown are representative of the groups of mice analyzed as indicated in Table S2.
Genotype Ileitis Colitis
WT - -
FaddIEC-KO +++++ +++++
FaddIEC-KO Ripk1D138N/D138N ++ +
FaddIEC-KO AscIEC-KO +++++ not reported
FaddIEC-KO Mlkl-/- +++ -
FaddIEC-KO Mlkl-/- Casp8IEC-KO - not reported
FaddIEC-KO Mlkl-/- AscIEC-KO +++ not reported
FaddIEC-KO Mlkl-/- Gsdmd-/- + not reported
FaddIEC-KO Mlkl-/- Zbp1-/- +++ not reported
FaddIEC-KO Mlkl-/- Ripk1D138N/D138N +++ not reported
FaddIEC-KO Tnfr1IEC-KO ++++ +
FaddIEC-KO Tnfr1IEC-KO Zbp1-/- ++ not reported
FaddIEC-KO Tnfr1IEC-KO Zbp1-/- Ticam1IEC-KO ++ not reported
FaddIEC-KO Tnfr1IEC-KO Zbp1wt/- Ticam1IEC-KO ++++ not reported
FaddIEC-KO Zbp1-/- ++++ +
FaddIEC-KO Ripk3IEC-KO ++ -
FaddIEC-KO Casp8IEC-KO ++++ not reported
Casp8IEC-KO ++++ ++++
Casp8IEC-KO Mlkl-/- - -
Casp8IEC-KO Ripk1D138N/D138N + -
Casp8IEC-KO Tnfr1IEC-KO ++++ +
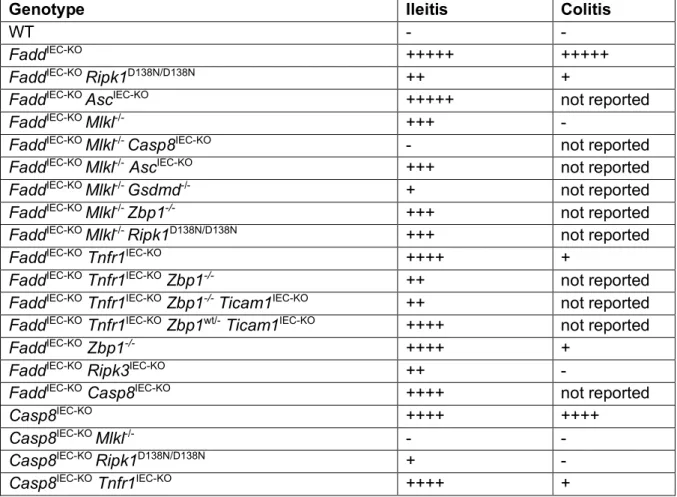
Table S1. Severity of ileitis and colitis in the mouse lines reported in this study.
Related to Figures 1, 2, 3, 4, 5, 6, 7, S1, S2, S3, S4 and S5.