QTLs and diagnostic SNP markers for maturity corrected resistance to Phytophthora infestans in potato (Solanum tuberosum L.)
Inaugural-Dissertation
Zur
Erlangung des Doktorgrades
der Mathematisch-Naturwissenschaftlichen Fakultät der Universität zu Köln
vorgelegt von
Meki Shehabu Muktar
aus Dilla, Äthiopien
Köln, 2014
Die vorliegende Arbeit wurde am Max-Planck-Institut für
Pflanzenzüchtungsforschung in der Abteilung für Pflanzenzüchtung und Genetik (Direktor Prof. Dr. Maarten Koornneef) angefertigt.
Berichterstatter PD Dr. Christiane Gebhardt (Gutachter)
Prof. Dr. Ulf-Ingo Flügge
Tag der mündlichen Prüfung 27.06.2014
Late blight of potato (Solanum tuberosum L.) caused by the oomycete Phytophthora infestans (Mont.) de Bary, is one of the most important bottlenecks of potato production worldwide. The disease could be better managed by using cultivars with high levels of quantitative or field resistance, which is mostly race non-specific and more durable than single R-gene mediated resistance. Breeding for quantitative resistance is however, a complex and challenging process and requires multiple year and location trials. In addition, it is hampered by a correlation between resistance and late maturity. This problem can be tackled by using diagnostic DNA markers, which enhance efficiency and precision of resistance breeding. The aim of this project was the identification of genes for quantitative resistance to P. infestans not compromised by late maturity and the discovery of diagnostic single nucleotide polymorphism (SNP) markers. To meet the objectives, the analysis of candidate genes and genome wide association (GWA) mapping of SNP markers were used.
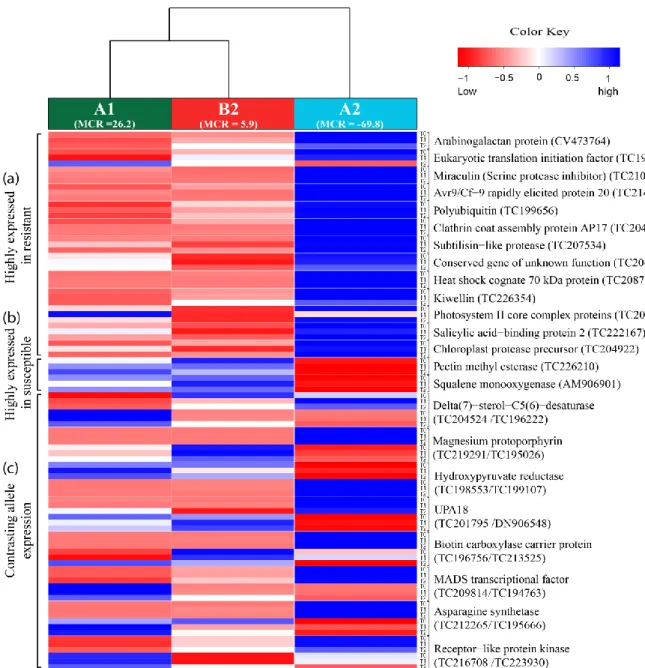
In the first approach, novel candidate genes that were differentially expressed in quantitative resistant versus susceptible potato genotype pools, were selected from transcriptome data generated using SuperSAGE (serial analysis of gene expression) analysis of nine samples comprising three genotype groups with different resistance levels and three infection time points. Twenty-two selected novel candidate genes were subjected to validation of differential expression by quantitative real time PCR (qRT-PCR) and allele specific pyrosequencing. Candidates showing reproducible transcriptional regulation in three independent infection experiments were tested for association with maturity corrected resistance (MCR) to late blight in a population of 184 tetraploid genotypes (CONQUEST2 population). Using mixed linear model (MLM) analysis including kinship and population structure, six novel candidate genes associated with late blight resistance not compromised by late maturity were identified.
In the second approach, GWA mapping was conducted by scanning 8303 SNP markers
distributed across the 12 potato chromosomes. The genotyping of the CONQUEST2
population was performed with the Illumina SolCAP SNP potato genotyping array and
produced a total of 6286 informative bi-allelic SNPs. Approximately 5600 SNP markers
could be used for association analysis. No or very weak relatedness and sub populations were
detected in CONQUEST2 population. The proportion of pair wise r
2values > 0.1 (loci are in
respectively. The trendline of the nonlinear regression curve reached the threshold level for LD, r
2= 0.1, between 270 and 280 bps, showing a rapid LD decay in the potato genome. This fast LD decay implies that a large number of genome wide markers are required for detecting all quantitative trait loci (QTLs) in potato by GWA mapping. Nevertheless, genome wide marker-trait association analysis, with correction for kinship and population structure in a mixed linear model (MLM), identified few novel SNP markers associated with late blight resistance not compromised by late maturity.
In conclusion, comparative transcript profiling combined with association mapping can be
used for the detection of novel late blight QTLs and diagnostic SNP markers that can be used
in marker-assisted resistance breeding. The SolCAP potato genotyping array is a useful but
limited tool in identification of diagnostic SNP markers for agronomic traits in potato.
Die Kraut- und Knollenfäule der Kartoffel (Solanum tuberosum L.), verursacht durch den Oomyzeten Phytophthora infestans (Mont.) de Bary, ist weltweit eines der wichtigsten Probleme im Kartoffelanbau. Die Krankheit könnte besser beherrscht werden durch den Anbau von Sorten mit hoher quantitativer oder Feldresistenz, die überwiegend Rassen- unspezifisch ist und eine längere Lebensdauer hat als die durch einzelne R-Gene vermittelte Resistenz. Die Züchtung auf quantitative Resistenz ist jedoch komplex und schwierig und erfordert mehrjährige Feldversuche, die zusätzlich erschwert wird durch die Korrelation zwischen Resistenz und später Reifezeit. Eine mögliche Lösung dieses Problems sind diagnostische DNA Marker, welche Effizienz und Präzision der Resistenzzüchtung erhöhen.
Ziel dieses Projekts war die Identifizierung von Genen für quantitative Resistenz gegen P.
infestans ohne Beeinträchtigung durch späte Reifezeit, sowie die Entdeckung von diagnostischen ‚single nucleotide polymorphism„ (SNP) Markern. Um diese Ziele zu erreichen, wurde die Analyse von Kandidatengenen und die genomweite Assoziationskartierung (GWA) von SNP Markern verwendet.
Im ersten Ansatz wurden neue Kandidatengene ausgewählt, die in Gruppen von quantitativ resistenten bzw. anfälligen Kartoffel-Genotypen differenziell exprimiert waren. Die Auswahl erfolgte auf der Basis von Transkriptom-Daten, die mittels SuperSAGE (‚serial analysis of gene expression„) Analyse von neun Proben, bestehend aus drei Genotyp Gruppen mit unterschiedlicher Resistenz und drei Infektionszeitpunkten, erhalten worden waren. Die differentielle Expression von zweiundzwanzig der ausgewählten neuen Kandidatengene wurde mittels quantitativer ‚real time„ PCR (qRT-PCR) und allelspezifischer Pyrosequenzierung überprüft. Kandidaten, deren transkriptionelle Regulation in drei unabhängigen Infektionsexperimenten reproduzierbar war, wurden auf Assoziation mit reifekorrigierter Krautfäuleresistenz (‚maturity corrected resistance„: MCR) in einer Population von 184 tetraploiden Genotypen (CONQUEST2 Population) geprüft. Mit Hilfe eines gemischt linearen Modells (MLM) unter Berücksichtigung von Verwandtschaft und Populationsstruktur wurden sechs neue Kandidatengene identifiziert, die mit Krautfäuleresistenz ohne Beeinträchtigung durch späte Reifezeit assoziiert sind.
Im zweiten Ansatz wurde eine GWA Kartierung durchgeführt mit Hilfe von 8303 SNP
Markern, die über die zwölf Kartoffelchromosomen verteilt waren. Die Genotypisierung der
ergab 6286 informative, bi-allelische SNP Marker, von denen etwa 5600 für die Assoziationsanalyse verwendbar waren. In der CONQUEST2 Population wurde keine oder nur sehr schwache Verwandschaft und Populationsstruktur gefunden. Der Anteil von paarweisen r
2Werten > 0.1 (zwei Loci befinden sich im Kopplungsungleichgewicht, ‚linkage disequilibrium: LD) und > 0.8 (Loci befinden sich in sehr starkem LD) betrug nur 1.57%
bzw. 0.01%. Die Trendlinie der nichtlinearen Regressionskurve erreichte den LD Grenzwert r
2= 0.1 zwischen 270 und 280 Basenpaaren. Dies zeigte, dass LD im Kartoffelgenom mit dem physikalischen Abstand rasch abnimmt. Diese rasche LD Abnahme bedeutet, dass eine große Zahl genomweiter Marker erforderlich ist, um alle ‚quantitative trait loci„ (QTL) mittels GWA zu erfassen. Nichtsdestotrotz identifizierte die genomweite Marker-Merkmal Assoziationsanalyse, unter Verwendung von MLM mit einer Korrektur für Verwandtschaft und Populationsstruktur, einige neue SNP Marker, die mit Krautfäuleresistenz ohne Beeinträchtigung durch späte Reifezeit assoziiert sind.
Schlussfolgerung: Die vergleichende Analyse von Transkriptmengen in Kombination mit
Assoziationskartierung kann für die Identifizierung von neuen QTLs und von diagnostischen
SNP Markern verwendet werden, die für eine Marker-gestützte Resistenzzüchtung genutzt
werden können. Der ‚SolCAP potato genotyping array„ ist ein nützliches, aber auch
begrenztes Instrument für die Identifizierung von SNP Markern, die für agromische
Merkmale der Kartoffel diagnostisch sind.
1. General Introduction ... 1
1.1. The potato ... 1
1.2. Phytophthora infestans ... 2
1.3. Interaction between potato and Phytophthora infestans ... 4
1.3.1. Incompatible interaction ... 5
1.3.2. Compatible interaction ... 6
1.4. Association mapping ... 7
1.5. Marker assisted selection ... 9
1.6. The objectives of the study ... 10
2. Selection and validation of novel candidate genes for association with quantitative resistance to Phytophthora infestans in potato ... 11
2.1. Introduction ... 11
2.2. Materials and Methods ... 15
2.2.1. Materials ... 15
2.2.1.1. Potato genotypes used for linkage mapping ... 15
2.2.1.2. Potato genotypes used for association mapping ... 15
2.2.1.3. Potato genotypes used for candidate genes expression analysis ... 15
2.2.2. Methods ... 16
2.2.2.1. Molecular techniques ... 16
2.2.2.1.1. DNA extraction ... 16
2.2.2.1.2. Total RNA extraction from P. infestans infected potato leaves ... 17
2.2.2.1.3. Synthesis of first strand cDNA... 17
2.2.2.1.4. Polymerase chain reaction (PCR) ... 18
2.2.2.1.5. Quantitative real time PCR (qRT-PCR) ... 18
2.2.2.1.6. Pyrosequencing... 19
2.2.2.1.7. Amplicon sequencing and SNP markers scoring ... 21
2.2.2.2. Field assessment of tetraploid potato genotypes to late blight under natural infestation ... 23
2.2.2.3. Multiplication and maintenance of P. infestans ... 23
2.2.2.4. Infection of potato genotypes with complex isolates of P. infestans ... 24
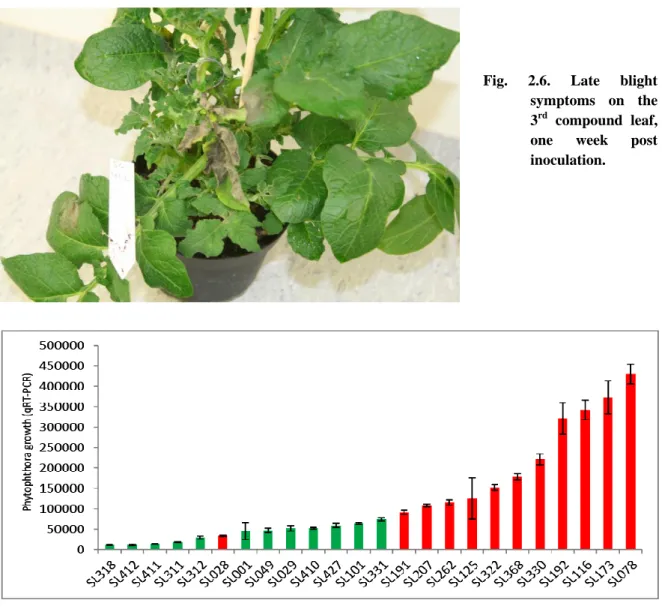
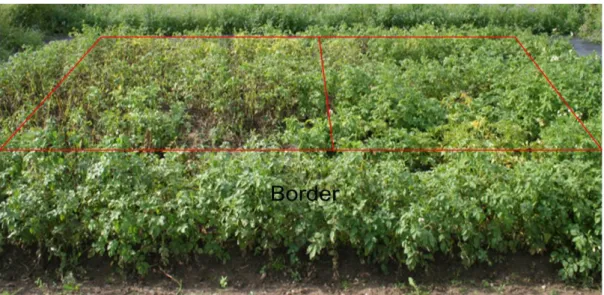
2.2.2.5. Phenotyping ... 25
2.2.2.7. RNA pooling ... 27
2.2.2.8. Selection of novel candidate genes ... 28
2.2.2.9. Statistical methods ... 28
2.2.2.10. Candidate genes linkage mapping ... 28
2.2.2.11. Candidate genes association mapping ... 29
2.2.2.12. Linkage disequilibrium analysis ... 29
2.3. Results ... 30
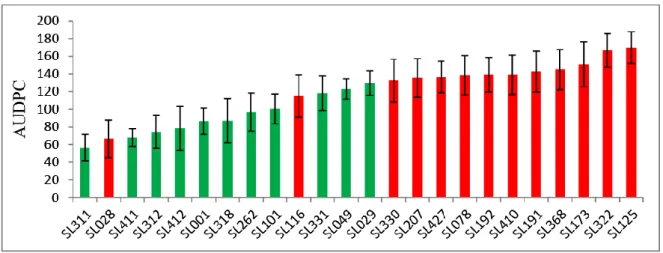
2.3.1. P. infestans SuperSAGE tags for Phytophthora quantification in qRT-PCR ... 30
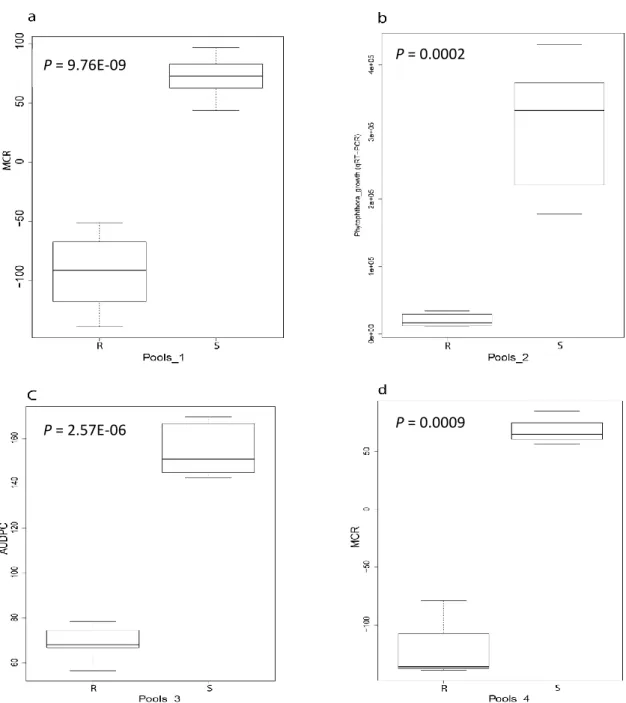
2.3.2. Selection of tetraploid potato genotypes contrasting for MCR to P. infestans 31 2.3.3. Verification of the resistance level of the selected tetraploid potato genotypes .. ... 33
2.3.4. Selection of novel candidate genes for resistance to P. infestans ... 36
2.3.5. RNA pooling and pooling strategy ... 39
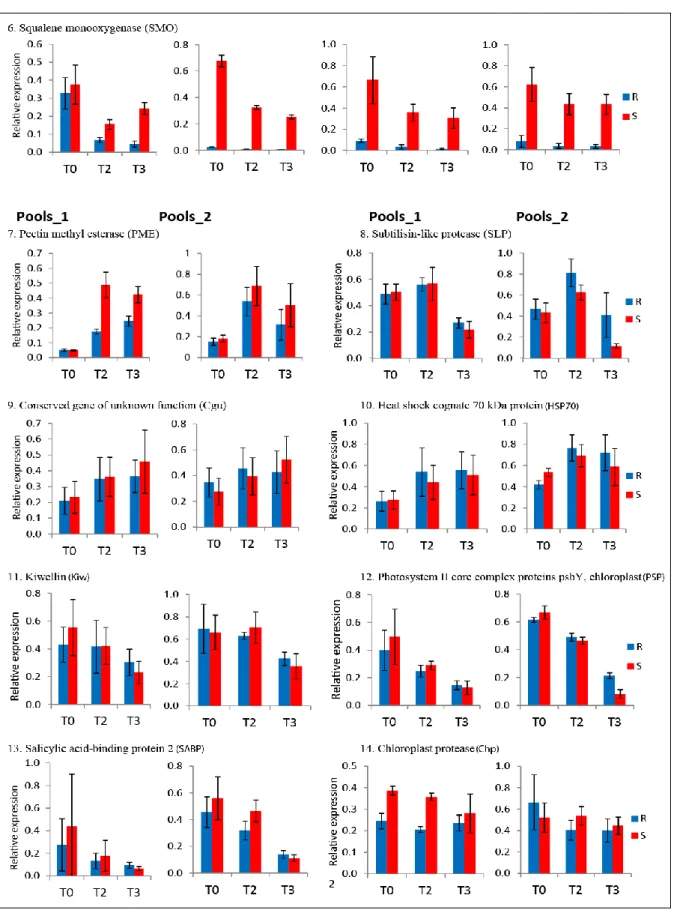
2.3.6. Reproducibility of differential expression ... 40
2.3.6.1. Differential expression analysis in qRT-PCR ... 41
2.3.6.2. Allele specific differential expression analysis by pyrosequencing ... 44
2.3.6.2.1. Allele frequency analysis ... 45
2.3.6.2.2. Amino acid substitution analysis ... 46
2.3.7. Linkage analysis for selected candidates ... 50
2.3.7.1. Phenotypic data ... 50
2.3.7.2. Marker data ... 51
2.3.7.3. Marker-trait linkage analysis ... 51
2.3.8. Candidate genes association mapping ... 53
2.3.8.1. Phenotypic data ... 53
2.3.8.2. Marker data ... 54
2.3.8.3. Marker-trait association analysis ... 54
2.3.8.4. Maturity corrected resistance (MCR) ... 54
2.3.8.5. Relative area under disease progress curve (rAUDPC) ... 55
2.3.8.6. Plant maturity (PM)... 55
2.3.9. Candidate genes co-localization with known QTLs for pathogen resistance .. 56
2.3.10. Linkage disequilibrium (LD) ... 56
2.4. Discussion ... 60
2.4.1. Tetraploid potato genotypes showed stable resistance to P. infestans ... 60
infection and disease progression of P. infestans in potato ... 61
2.4.3. Some candidate genes showed reproducible differential expression ... 62
2.4.4. Linkage mapping identified a QTL with minor allele frequency ... 65
2.4.5. Differentially expressed candidates associated with MCR to P. infestans ... 67
2.4.5.1. Biotin-carboxylase-carrier-protein (BCCP) ... 67
2.4.5.2. Delta(7)-sterol-C5(6)-desaturase (DSD) ... 68
2.4.5.3. Desaturase or Magnesium-protoporphyrin IX monomethyl ester cyclase (MPP) ... 68
2.4.5.4. Pectin methyl esterase (PME) ... 69
2.4.5.5. Avr9/Cf-9 rapidly elicited protein 20 (AC9) ... 69
2.4.5.6. Chloroplast protease (Chp) ... 70
2.5. Conclusions and outlook ... 70
3. Genome wide association mapping for maturity corrected resistance to Phytophthora infestans in potato using SNP markers from high-density genotyping SolCAP SNP array ... 71
3.1. Introduction ... 71
3.2. Materials and methods ... 73
3.2.1. Potato genotypes ... 73
3.2.2. Genotyping ... 73
3.2.3. Linkage disequilibrium (LD) and LD decay ... 73
3.2.4. Kinship ... 73
3.2.5. Population structure ... 74
3.2.6. Statistical analysis ... 74
3.3. Results ... 75
3.3.1. SolCAP SNP markers in the CONQUEST2 population ... 75
3.3.2. Relative Kinship/relatedness between genotypes in the CONQUEST2 population ... 76
3.3.3. Population structure in the CONQUEST2 population ... 76
3.3.4. Linkage disequilibrium (LD) and LD-decay ... 77
3.3.5. Marker-trait association analysis ... 78
3.3.5.1. Maturity corrected resistance (MCR) ... 79
3.3.5.2. Relative area under the disease progress curve (rAUDPC) ... 80
3.3.5.3. Plant maturity (PM) ... 80
3.4. Discussion ... 84
3.4.1. Population structure and relatedness ... 84
3.4.2. Linkage disequilibrium (LD) and LD-decay ... 85
3.4.3. Marker-trait association ... 88
3.5. Conclusions and outlook ... 89
4. References ... 90
5. Appendix ... 105
6. Supplementary data provided on CD ... 128
7. Acknowledgements ... 129
8. Erklärung ... 130
9. Lebenslauf ... 131
Page 1
1. General Introduction
1.1. The potato
Potato (Solanum tuberosum L.) is a member of the Solanaceae, an economically important family that includes tomato, pepper, eggplant, petunia and tobacco (Xu et al., 2011). Potato produces a subterranean swollen stem, called tuber. The tuber is consumed directly as a staple food or vegetable, processed into chips, french fries, and many other food products.
Potato is a major source of carbohydrate energy in the diets of hundreds of millions of people. It is also contain about 2% protein and provide an excellent source of lysine, vitamins C, B6 and B1a, the minerals potassium, phosphorus, calcium, and magnesium, and the micronutrients iron and zinc (Bradshaw and Bonierbale, 2010). Potato is a source for the industrial production of starch, and alcohol. Potato starch is the starting material for the preparation of more than 500 different commercial products (Bradshaw and Bonierbale, 2010), for example for the production of biodegradable plastics (Milbourne et al., 2007). It also serves in unconventional uses as a source of biofuel or as bioreactor for producing pharmaceutical compounds in transgenic plants (Gebhardt et al., 2014).
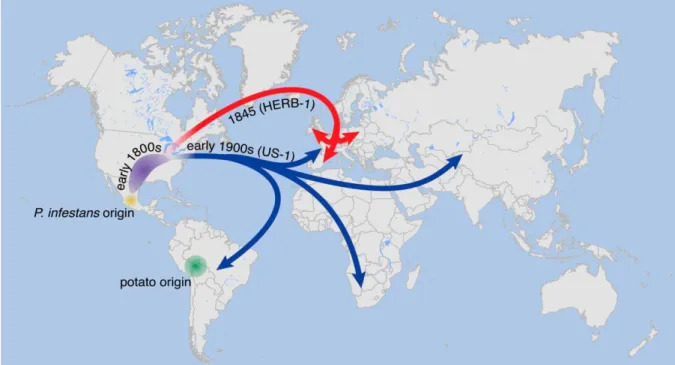
Potato was originated in the area of present day southern Peru and extreme northwestern Bolivia (Fig. 1.1) (Bradshaw and Bonierbale, 2010), and was domesticated 7, 000 to 13, 000 years ago (Milbourne et al., 2007). The Spanish introduced the potato to Europe in the second half of the 16
thcentury and subsequently distributed throughout the world by European mariners (Bradshaw and Bonierbale, 2010; Milbourne et al., 2007). In the 19
thcentury, potato was taken to East Africa by European missionaries and colonialists. In 1858 a German man took potato to Ethiopia, a country with the greatest potential for potato production among African countries (Haverkort et al., 2012). Currently, potato is the world‟s most important food crop after wheat and rice. China is the number one potato producer in the world followed by Russia and India (Gebhardt, 2013).
The potato species have different polyploidy levels; from diploid to hexaploid, with a basic
haploid chromosome number of x=12 (Bradshaw and Bonierbale, 2010; Milbourne et al.,
2007). The cultivated potato, Solanum tuberosum ssp. tuberosum, is tetraploid (2n=4x=48)
with autotetrasomic inheritance, in which the four sets of homologous chromosomes pair
Page 2
randomly during meiosis (Milbourne et al., 2007). Potato reproduces by sexual means, develop flowers and set true seeds in berries following natural pollination by insects. This sexual reproduction creates high diversity by recombining the variants of genes that arose by mutation. In addition, potato displays inbreeding depression on selfing. Thus, potato is highly heterozygous plant. However, it also reproduces asexually by setting tubers. The genetically unique seedlings that grow from true seeds produce tubers that can be replanted as seed tubers and hence distinct clones can be established and maintained by asexual (vegetative) reproduction. Most potato cultivars are propagated through seed tubers and are genetically uniform (Bradshaw and Bonierbale, 2010).
The potato genome was sequenced using a doubled monoploid S. tuberosum group Phureja DM1-3 516 R44. The genome size was estimated to 844 Mbp comprising more than 39, 000 protein coding genes, of which more than 800 are disease resistance genes (Xu et al., 2011).
1.2. Phytophthora infestans
Phytophthora infestans is a plant pathogen belongs to the class oomycetes, microorganisms with a similar morphology to fungi. Oomycetes differ from true fungi as their cell walls contain cellulose and lack chitin. They have diploid mycelium in part of their life cycle and biflagellate zoospores (Pereira et al., 2012). Taxonomically, oomycetes are more related to organisms such as brown algae and diatoms (Haas et al., 2009).
P. infestans originated in the Toluca valley of Mexico, where many different strains evolve
together with wild potato relatives (Fig. 1.1) (Yoshida et al., 2013; Pereira et al., 2012). In
1845, P. infestans reached Europe, spreading rapidly from Belgium to other European coun-
tries and then to Great Britain and Ireland. The impact of the epidemic reached catastrophic
levels in Ireland, where the population was more dependent on potato for their subsistence
than in other parts of Europe. The subsequent great famine killed around 1 million people,
and an additional million were migrated to other countries. Ever since triggering the Irish
famine, P. infestans has continued expanding its territory throughout the world where potato
and tomato are growing and remains the most destructive pathogen on the world‟s most
important food crops (Yoshida et al., 2013).
Page 3
P. infestans first identified by de Bary in 1847 and because of the devastating nature of the pathogen, he named it Phytophthora infestans (= infectious plant destroyer) and the resulting disease is called late blight (Fry, 2008). P. infestans is an extraordinarily virulent and adaptable pathogen (Haas et al., 2009; Fry, 2008). It reproduces by asexual and sexual means. In asexual cycle, sporangia are produced on sporangiophores that grow from infected tissues. The sporangia are readily dehiscent and can be aerially dispersed to other plant tissues. Sporangia in free water germinate either via a germ tube at higher temperatures (optimum around 20–25 C), or by releasing wall-less zoospores at lower temperatures (optimum between 10 and 15° C) (Kamoun and Smart, 2005). The biflagellated zoospores are motile for a short time before encysting. Encysted zoospores germinate directly via a germ tube to penetrate leaf or stem tissue. It is capable of completing an asexual cycle, from infection to the production of sporangia, in less than 5 days, and the sporangia can be washed off the leaves and fall onto the soil where their spores subsequently infect tubers (Fry and Goodwin, 1997). Under favourable weather conditions, P. infestans is capable of destroying a potato crop in a matter of days, resulting in total loss of the crop unless control measures are implemented correctly (Fry, 2008). P. infestans also reproduces sexually in the presence of two different thalli, called A1 and A2, and produce oospores, resistant sexual spores that survive in the soil and in crop residues (Judelson and Blanco, 2005; Kamoun and Smart, 2005).
Once inside the plant cells, Phytophthora uptake nutrients from the living cell and secrete different types of enzymes and effector proteins that further facilitate the nutrient access. The effector proteins inhibit enzymatic activity and enable protection against plant-derived hydrolytic enzymes (Fry, 2008). The effectors classified into two main categories, depending on their site of action. Apoplastic effectors remain in the apoplastic space where they interact with extracellular host molecules. Cytoplasm effectors translocated into the plant cytoplasm.
There are two main families of cytoplasm effectors; the RXLR and Crinkler (CRN) protein families (Nowicki et al., 2012; Haas et al., 2009; Fry, 2008).
P. infestans has a genome size of 240 Mb encoding more than 18,000 genes, with three
quarters of the genome consisting of repetitive DNA. A large number of genes codes for
effector proteins, many of which are delivered inside plant cells to promote host colonization,
Page 4
for instance by suppressing plant immunity. RXLR proteins, the main class of host- translocated effectors, are encoded by about 550 genes (Haas et al., 2009).
Fig. 1.1. Places of origin for potato and Phytophthora infestans. Suggested paths of P. infestans migration are indicated by arrow; the path of the strain (HERB-1) that triggered the Irish famine in 1845 shown by red, while the path for the modern strain (US-1) is shown by blue (Yoshida et al., 2013).
1.3. Interaction between potato and Phytophthora infestans
Up on the arrival of pathogens on plant surfaces, plants detect the presence of pathogen on
their surface by perceiving both chemical and physical signals of pathogen origin, and react
rapidly to the attempted infection (Nowicki et al., 2012). The plant-pathogen interactions can
be incompatible or compatible. In incompatible interaction, the host plant can successfully
defend itself against the pathogen. Usually the plant has a gene for resistance (R-gene) that
recognizes the corresponding specific gene for avirulence (Avr) of the pathogen. In
compatible interaction, the pathogen infects the plant, but there is often a big difference in
how effectively the plant can defend itself against the pathogen. Even when conditions for
infection and disease development are favourable, a plant may develop no disease, only mild
disease, or severe disease, depending on the specific genetic makeup of the plant and of the
pathogen that attacks it.
Page 5
1.3.1. Incompatible interaction
Incompatible interaction takes place in the so called qualitative resistance, which also called monogenic resistance and is controlled by a sing R-gene. This type of resistance is known by complete arrest of pathogen growth. Most plant R-genes are members of a super family of genes that have a nucleotide binding site (NBS) (Rigden et al., 2000) and a leucine-rich repeat (LRR) domain (Dangl & Jones, 2001). R-genes operate by detecting pathogen effectors, proteins secreted by the pathogen to facilitate the infection process. If these effector proteins are detected by an R-gene they are called avirulence proteins (Avr-proteins). Direct recognition of an Avr-protein by the product of an R-gene is rare; more commonly the R- gene “guards” a host protein which is the virulence target of the effector and the response is triggered when the activity of the effector on the host is recognized. Recognition of the Avr- protein or its activity by the plant R-gene leads to elicitation of a strong defense response accompanied by a hypersensitive response (HR), a form of programmed cell death that localises the pathogen and prevents further spread (Gleason et al., 2008; Jones & Dangl, 2006).
However, pathogens continuously adapt their effectors to evade recognition by the R-genes.
The plant-pathogen co-evolution processes are well represented by the „zigzag‟ model (Jones
& Dangl, 2006). In phase 1, PAMPs or MAMPs (Pathogen/Microbe Associated Molecular Patterns) are recognized by PRRs (Pattern Recognition Receptors), resulting in PTI (PAMP- Triggered Immunity). In phase 2, successful pathogens deploy effectors that contribute to pathogen virulence. These effectors suppress PTI resulting in ETS (Effector- Triggered Susceptibility). In phase 3, an NB-LRR protein specifically recognizes a given effector, resulting in ETI (Effector-Triggered Immunity). ETI is an accelerated and amplified PTI, resulting in disease resistance and, usually, a HR at the infection site. In phase 4, natural selection drives pathogens to avoid ETI either by shedding or diversifying the recognized effector, or by acquiring additional effectors that suppress ETI. Again, natural selection results in new resistance specificities so that ETI can be triggered (Jones & Dangl, 2006) and the boom and bust cycle continues.
So far, many race specific R-genes resistance to P. infestans have been identified from wild
potato species and introgressed into varieties (Gebhardt and Valkonen, 2001). 11 R genes
Page 6
(R1 to R11) were identified in S. demissum, a wild species originating from Mexico (Gebhardt and Valkonen, 2001). Another three R genes, RB/Rpi-blb1, Rpi-blb2, and Rpi-blb3 were identified from S. bulbocastanum, and have been mapped to chromosomes VIII, VI, and IV, respectively (Park et al. 2009; Naess et al. 2001). Another one, Rpi-vnt1.1, was identified from S. venturii (Foster et al., 2009). All of the R genes identified so far are defeated by virulent races of P. infestans.
1.3.2. Compatible interaction
In compatible interaction, the pathogen can infect the host plant, but the infection and disease severity vary from plant to plant depending on the level of resistance the plant has. This type of resistance is called quantitative resistance and mediated by multiple genes or quantitative trait loci (QTLs) with each providing a partial increase in resistance. Quantitative resistance is known by slowdown of pathogen growth and disease progression. Compared to R-gene mediated resistance, quantitative resistance is characterized by a partial and durable effect of resistance that is generally race-nonspecific but pathogen species-specific.
Little is known about the biology or the genetic architecture of quantitative traits.
Pathogenesis-related (PR) genes, phenylalanine ammonia lyase (PAL), proteinase inhibitors, defense signaling genes and genes with sequence similarity with R genes and protein kinases have been reported playing role in quantitative resistance (Kou and Wang, 2010; Gebhardt and Valkonen, 2001). According to Kou and Wang (2010), host pattern recognition receptor (HPRR)-type genes and a number of defense-responsive genes have suggested as contributing to quantitative resistance and some of them mediate broad spectrum resistance.
Quantitative resistance may also be contributed by R genes that have residual effects against virulent pathogens or defeated R genes (Gebhardt, 2013).
Quantitative resistance is very complex type of resistance. Quantitative traits do not follow
patterns of Mendelian inheritance. Instead, their phenotypes typically vary along a
continuous gradient depicted by a bell curve. Quantitative traits are controlled by multiple
genes or QTLs. Plants with the same phenotype can carry different alleles at each of many
genes or QTLs or plants with identical QTL genotypes can show different phenotypes when
grown under different environments. Furthermore, the effect of one QTL can depend on the
allelic constitution of the plant at other QTL. For these reasons, one cannot infer the genotype
Page 7
from the phenotype, and one must construct specialized genetic stocks and grow them in precisely controlled environments (Clair, 2010).
However, the genetic variation of most quantitative traits likely involves a small number of major genes or QTLs, a larger number of loci with moderate effects, and a very large number of loci with minor effects. The effects of the major QTLs can be studied via segregation analysis as well as evolutionary and selection history. The numerous genes with small effects, however, cannot be investigated individually (Clair, 2010).
A number of resistance QTLs, which confer quantitative/field resistance against P. infestans have been identified in potato (Nowicki et al., 2012; Gebhardt and Valkonen, 2001). Out of the various identified QTLs, one major resistance QTL, located on potato chromosome V co- localizing with R1, is an important one (Gebhardt and Valkonen, 2001). Unfortunately, this QTL is associated with late plant maturity, reducing its potential value (Gebhardt and Valkonen, 2001). Another major QTL for P. infestans resistance not compromised by late maturity is a gene in chromosome XI, encoding allene oxide synthase 2 (StAOS2) (Pajerowska-Mukhtar et al., 2009; 2008).
1.4. Association mapping
The conventional linkage mapping relies on linkage disequilibrium (LD) generated by crossing two parental lines. Recombination in meiosis that leads to double haploids (DHs), F2 or recombinant inbred lines (RILs) reduces the association between a given QTL and markers distant from it. Unfortunately, derivation of these populations requires relatively few meiosis, such that even markers that are far from the QTL (e.g. 10 cM) remain strongly associated with it. Such long-distance association hampers precise localization of the QTL (Xu, 2006). These problems are worsening in polyploid crops, like tetraploid potato, with high heterozygous and tetrasomic segregation. Furthermore, self incompatibility in diploid potatoes complicates more the use of conventional linkage mapping (Gebhardt, 2007).
Association mapping via LD (non-random association of alleles at different loci) offers promise in this area (Oraguzie and Phillip, 2007).
Association mapping examines the joint inheritance of functional polymorphisms and
physically linked molecular markers in a set of genotypes with unknown ancestry (Gebhardt
Page 8
et al., 2014). It involves searching for genotype-phenotype correlations among unrelated individuals following two main approaches. The first approach is the candidate gene approach that uses pre-specified genes selected based on a priori knowledge of their function, such as their involvement in pathogenesis, defense and defense related pathways (Gebhardt et al., 2007). The second approach is genome wide association mapping (GWA) that scans the whole genome for polymorphism without prior information about the genomic regions governing the variation of the target trait (Soto-Cerda and Cloutier, 2012; Stich et al., 2013).
The scanned DNA markers analyzed statistically for co-segregation with phenotypic traits to find markers linked with a quantitative trait locus (QTL) contributing to the trait (Stich et al., 2008; Yu et al., 2006).
In contrast to the conventional linkage mapping, association mapping exploits the existing LD in a population that undergone historical recombination events in the past (Soto-Cerda and Cloutier, 2012). This makes association mapping more applicable to a much wider germplasm base as compared to the conventional linkage mapping.
However, the use of a collection of genotypes has its own consequences for the analysis. In a collection of genotypes, significant marker trait association might not be due to physical linkage between markers and QTLs. In such type of population, population structure and familial relatedness potentially create LD between unlinked loci (Pritchard 2001; Stich et al.
2005; Yu et al. 2006), leading to false positives or spurious associations (Stich et al., 2008;
Yu et al., 2006).
Different methods have been suggested to avoid such non-functional, spurious associations
between a phenotype and an unlinked gene (Stich et al., 2008; Malosetti et al., 2007; Yu et
al., 2006). Pritchard et al. (2000) proposed a Bayesian method of testing association that
depends on the inferred ancestries of individuals. The computer program STRUCTURE uses
computationally intensive methods to partition individuals into populations given molecular
marker data. Another method is based on principal component analysis (PCA) across a large
number of biallelic control markers with a genome wide distribution (Price et al., 2006). The
PCA summarizes the variation observed across all markers into a smaller number of
underlying component variables. These can be interpreted as relating to separate, unobserved,
subpopulations from which the individuals in the dataset (or their ancestors) originated (Xu,
Page 9
2006). Yu et al. (2006) proposed a mixed-model approach that combines population structure and family relatedness to correct false positives. In this approach, both a marker-based relationship matrix (K) and population structure (Q) are included in a mixed model for association analysis of a single trait in a single environment. Stich et al. (2008) proposed a two-step-approach, in which adjusted entry means of the phenotypic data analysis is followed by association analysis. Malosetti et al. (2007) proposed association mapping approach based on the mixed models with attention to the environmental variation.
1.5. Marker assisted selection
Marker assisted selection (MAS) refers to the use of DNA markers that are tightly-linked to target gene or quantitative trait loci (QTLs) governing the trait as a substitute for or to assist phenotypic screening. By determining the allele of a DNA marker, plants that possess particular genes or (QTLs) may be identified based on their genotype rather than their phenotype. DNA-based genetic markers essentially detect point mutations, insertions, deletions or inversions in allelic DNA fragments, which differentiate the individuals of the same species (Gebhardt, 2007). The first molecular marker was restriction fragment length polymorphisms (RFLP) followed by PCR based markers such as amplified fragment length polymorphisms (AFLP), simple sequence repeats (SSR) and single nucleotide polymorphisms (SNP) markers (Gebhardt, 2007).
MAS may greatly increase the efficiency and effectiveness for breeding compared to
conventional breeding. The main advantages of MAS compared to conventional phenotypic
selection are; simpler compared to phenotypic screening, selection may be carried out at
seedling stage and single plants may be selected with high reliability. In addition, it saves
time and labour by substituting difficult or time-consuming field trials that need to be
conducted at particular times of year or at specific locations, or are technically complicated
(Collard and Mackill, 2008). Furthermore, selection based on DNA markers may be more
reliable due to the influence of environmental factors on field trials. In some cases, using
DNA markers may be more cost effective than the screening for the target trait. Another
benefit from using MAS is that the total number of lines that need to be tested may be
reduced. Since many lines can be discarded after MAS at an early generation, this permits a
more effective breeding design (Collard and Mackill, 2008).
Page 10
A diagnostic marker should predict the phenotype of interest in a breeding population.
Ideally, a diagnostic marker originates directly from the allelic variant of the gene that is causal for the phenotypic effect. The smaller the physical distance between a marker locus and the factor causal for the trait of interest, the larger the LD is between marker and trait alleles, which increase the diagnostic value of the marker (Gebhardt, 2013).
MAS has been successfully implemented for P. infestans resistance in potato, mainly for a single R-gene based resistance (Tiwari et al., 2013). For quantitative resistance, a prominent and reproducible QTL on potato chromosome V was reported (Gebhardt and Valkonen, 2001). However, the same resistance QTL overlaps with a major QTL for plant maturity.
StAOS2 is a marker for a major QTL in chromosome XI (Pajerowska-Mukhtar et al., 2009) conferring maturity-corrected resistance (MCR) to P. infestans and has been successfully implemented in MAS (Draffehn et al., 2013).
1.6. The objectives of the study
The objective of this study was the identification of genes (QTLs) and diagnostic SNP
markers associated with maturity corrected resistance (MCR), relative area under the disease
progress curve (rAUDPC) and plant maturity (PM). Under the long day conditions in the
growing seasons in central and northern Europe, quantitative resistance to P. infestans is
correlated with late plant maturity. Late plant maturity is an undesirable characteristic due to
its incompatibility with agricultural practices. Therefore, the main objective of this study was
the identification of genes for quantitative resistance to P. infestans not compromised by late
plant maturity (MCR) and the discovery of diagnostic SNP markers. We also aimed to
analyze population structure and genome wide linkage disequilibrium (LD) and LD decay in
a panel of 184 tetraploid potato clones (CONQUEST2 population).
Page 11
2. Selection and validation of novel candidate genes for association with quantitative resistance to Phytophthora infestans in potato
2.1. Introduction
Late blight of potato (Solanum tuberosum L.) caused by the oomycete pathogen Phytophthora infestans (Mont.) de Bary, is one of the most important bottlenecks of potato and tomato (Solanum lycopersicum) production worldwide (Gebhardt, 2013; Guenthner et al., 2001). Since causing the Irish famine in the 1840s, P. infestans has continued to destroy potato throughout the world and remains the most destructive disease of the third largest food crop (Yoshida et al., 2013). P. infestans attacks foliage, stems and tubers of the plant causing loss of crop quantity and quality. If not controlled, late blight epidemics can completely destroy the crop yield.
Although the use of chemical fungicides is an option to control P. infestans, it is
environmentally unsafe and costly (Guenthner et al., 2001). In addition, continuous use of
fungicides causes the emergence of new resistant strains. Hence, improvement of the genetic
resistance has been a priority option to manage late blight in potato and tomato. A number of
R-genes conferring resistance to specific races of P. infestans have been identified and
introgressed into advanced cultivars (Gebhardt, 2013; Foster et al., 2009; Ballvora et al.,
2002). However, this type of resistance was quickly overcame by new races of the pathogen
having virulence alleles compatible with the resistance alleles in the plant.
Instead, most
previous results showed that P. infestans could be better managed by using cultivars with
high levels of field resistance or quantitative resistance, which are more durable and mostly
race non-specific (Rietman et al., 2012; Fry, 2008). Quantitative resistance is controlled by
many genes and quantitatively more resistant cultivars have certain level of compatible type
interaction allowing some infection and growth of the pathogen, which reduces the selection
pressure on the pathogen (Gebhardt, 2013). In addition, the pathogen has to undergo many
mutations to overcome the several different genes involved in quantitative resistance
(Draffehn et al., 2013; Gebhardt, 2013). Breeding for quantitative resistance is however,
complex and challenging and requires multiple year and location trials. Quantitative
Page 12
resistance is controlled by many minor genes and also by the environment. In addition, it is more complicated by epistasis, which is interaction between quantitative trait loci (QTLs) (Jannink and Jansen, 2001). Furthermore, it is hampered in potato by a correlation between resistance and late plant maturity. In potato, genotypes with high levels of field resistance to late blight often are late maturing, which is an undesirable agronomic character (Visker et al., 2003). The reason for the correlation is not known, but it is either due to pleiotropic effects (i.e. both traits are controlled by the same gene) or due to linkage between the genes controlling the traits (Bormann et al., 2004). Quantitative resistance breeding can be facilitated by using diagnostic DNA markers, which are directly at or genetically linked to the genes or QTLs playing a role in resistance. A marker at the QTL for resistance is preferable as diagnostic marker compared to a linked marker. A marker physically tightly linked to the causal gene can also be considered diagnostic (Gebhardt, 2013). Hence, the identification of QTLs and diagnostic DNA markers for P. infestans resistance that are not compromised by late maturity was the aim of this project.
In this project, two approaches were followed to identify QTLs and diagnostic DNA markers associated or linked with late blight resistance. The first was the candidate gene approach that uses pre-specified genes selected based on a priori knowledge of their function, such as their involvement in pathogenesis, defense and defense related pathways. The second approach was genome wide association mapping that scans the whole genome for polymorphism without prior information about the genomic regions governing the variation of the target trait. This approach is discussed in chapter III.
The candidate gene approach takes advantages of the knowledge of disease resistance in
plants, genes and proteins that are likely to be involved in resistance. These make the
approach powerful and precise for QTL detection. However, it is biased as it hypothesizes
about the identity and function of the genes underlying the trait. Furthermore, the hypothesis
is limited to the knowledge of the hypothesizer, which increases the chance of missing some
genes that might have role in resistance (Gebhardt et al., 2007). The limitation of the
candidate gene approach can be complemented through comparative transcript profiling that
leads to the identification of candidates differentially regulated between quantitatively more
Page 13
resistance and susceptible genotype pools (Draffehn et al., 2013; Gyetvai et al., 2012; Kreuze et al., 2010; Ros et al., 2005).
So far, some QTLs for key traits were identified in potato through the candidate gene approach. These QTLs include resistance to late blight (Pajerowska-Mukhtar et al., 2009;
Gebhardt and Valkonen, 2001), resistance to Globodera pallida, chip color and tuber starch content (Gebhardt et al., 2007), tuber flesh color and cooking type (Kloosterman et al., 2010), and cold sweetening (Menendez et al., 2002). Among QTLs identified in potato through candidate gene approach, the best example is a major QTL in chromosome XI for late blight resistance (Pajerowska-Mukhtar et al., 2008). The QTL encodes allene oxide synthase 2 (StAOS2) and explained about 30 % of the genetic variation (Pajerowska-Mukhtar et al., 2009).
Many genes alter their level of expression in response to environmental stress conditions like pathogen attack. By profiling the transcripts in RNA pools from pathogen infected genotypes contrasting for disease phenotype or marker data, differentially expressed genes associated with resistance can be identified (Draffehn et al., 2013; Gyetvai et al., 2012; Kloosterman et al., 2010). The differential gene expression can either derive from a polymorphism located physically near the QTL or indirectly from a distant location on the genome (Kloosterman et al., 2010). Differentially expressed genes in potato due to P. infestans infection have been reported (Draffehn et al., 2013; Gyetvai et al., 2012; Thümmler and Wenzel, 2005).
In this study, novel candidate genes, which were differentially expressed in quantitative
resistant versus susceptible potato genotype pools, were selected from transcriptome data
generated by SuperSAGE (serial analysis of gene expression) analysis. The SuperSAGE
analysis was performed on nine samples comprising three genotype groups with different
resistance levels and three infection time points (Draffehn et al., 2013). SuperSAGE is a
digital gene expression profiling method and permits the simultaneous detection and
quantification of the transcriptome both from the host and pathogen in pathogen infected
samples (Matsumura et al., 2003). SuperSAGE generates 26 base pairs (bp) tag from each
transcript in the sample, and the tag frequency is proportional to the amount of the
corresponding transcript. In addition, the 26 bp tags can be used as gene specific primers
(Draffehn et al., 2013; Matsumura et al., 2003). The selected candidates were subjected to
Page 14
validation for differential expression by qRT-PCR and allele specific pyrosequencing.
Candidates showing reproducible transcriptional regulation in three independent infection
experiments as well as with reference to SuperSAGE expression data were tested for
association with maturity corrected resistance (MCR) to late blight in a population of
tetraploid breeding clones.
Page 15
2.2. Materials and Methods
2.2.1. Materials
2.2.1.1. Potato genotypes used for linkage mapping
A total of 111 half sib F1 segregating plants derived from the crosses Phy14 x Phy20 and Phy16 x Phy20 were used for linkage analysis. The genotypes were evaluated for late blight resistance in 2010 under field conditions and phenotypic data for AUDPC (area under disease progress curve), MCR (maturity corrected resistance) and PM (plant maturity) were provided by the breeding company Pflanzenzucht GmbH & Co. Ka (SAKA). DNA was extracted from leaf samples of each genotype as described below (2.2.2.1.1).
2.2.1.2. Potato genotypes used for association mapping
For association mapping, the CONQUEST2 population was used, which consisted of 184 tetraploid potato clones (Pajerowska-Mukhtar et al., 2009). The CONQUEST2 population was originally from two breeding companies, Böhm-Nordkartoffel Agrarproduktion (BNA) and SAKA. The population was phenotyped in the field for rAUDPC, MCR and PM and adjusted entry means were calculated as described previously by Pajerowska-Mukhtar et al.
(2009). DNA of the CONQUEST2 population maintained in Max Planck potato research group (Cologne, Germany) was used for candidate genes amplicon sequencing analysis.
2.2.1.3. Potato genotypes used for candidate genes expression analysis
Twenty-four tetraploid potato genotypes were selected based on their MCR to complex
isolates of P. infestans and plant maturity date. Twelve genotypes were quantitatively more
resistant while the other twelve were quantitatively more susceptible. The genotypes were
half-sib offspring from two crosses with two different resistant parents (Phy14 and Phy16)
and one common susceptible parent (Phy20). The genotypes, phenotype and their pedigree
are shown in Table 2.1.
Page 16 Table 2.1. Tetraploid potato genotypes used for differential candidate genes expression analysis.
Their pedigree, phenotype for plant maturity (PM), relative area under the disease progress curve (rAUDPC) and maturity corrected resistance (MCR) and genotype at the StAOS2 locus.
Genotype PM rAUDPC MCR Cross
StAOS2- snp691
StAOS2- snp692
SL001 7 -4.28 -84.1 PapPhy20 x PapPhy14 AAGG CGGG
SL029 1 125.52 -117.7 PapPhy20 x PapPhy14 AAAA CCCC
SL049 5 83.16 -51.1 PapPhy20 x PapPhy14 AAAA CCCC
SL262 5 79 -55.3 PapPhy20 x PapPhy14 AAAA CCCC
SL101 5 16.39 -117.9 PapPhy20 x PapPhy14 AAAA CCCC
SL311 5 -1.77 -136 PapPhy20 x PapPhy16 AAAA CCCC
SL312 5 55.23 -79 PapPhy20 x PapPhy16 AAAA CCCC
SL318 5.7 22.91 -92.3 PapPhy20 x PapPhy16 AGGG CCGG
SL331 7 24.41 -55.4 PapPhy20 x PapPhy16 AGGG CGGG
SL411 6 16.7 -90.3 PapPhy20 x PapPhy16 AAGG CGGG
SL412 4 22.59 -138.9 PapPhy20 x PapPhy16 AAAA CCCC
SL427 5.3 25.82 -100.3 PapPhy20 x PapPhy16 AGGG CGGG
SL028 5.3 198.02 71.9 PapPhy20 x PapPhy14 AAAA CCCC
SL078 3 252.34 63.6 PapPhy20 x PapPhy14 AAGG CGGG
SL116 4 223.02 61.5 PapPhy20 x PapPhy14 AAAA CCCC
SL125 1 287.16 43.9 PapPhy20 x PapPhy14 AAAA CCCC
SL173 5 220.39 86.1 PapPhy20 x PapPhy14 AAAA CCCC
SL191 5.3 207.05 81 PapPhy20 x PapPhy14 AAAA CCCC
SL192 5.7 212.14 96.9 PapPhy20 x PapPhy14 AAGG CGGG
SL207 5.7 189.32 74.1 PapPhy20 x PapPhy14 AAAA CCCC
SL322 4 226.25 64.7 PapPhy20 x PapPhy16 AAGG CGGG
SL330 5 190.52 56.3 PapPhy20 x PapPhy16 AAGG CGGG
SL368 5 218.93 84.7 PapPhy20 x PapPhy16 AAGG CGGG
SL410 5 208.98 74.7 PapPhy20 x PapPhy16 AAAA CCCC
2.2.2. Methods
2.2.2.1. Molecular techniques 2.2.2.1.1. DNA extraction
Potato leaves were harvested and immediately frozen in liquid nitrogen. Frozen samples were
freeze-dried (Christ Gefriertrocknung GmbH, Osterode) overnight and about 100 mg freeze-
dried leaf samples were transferred to 1.5 ml Eppendorf tube containing one stainless steel
Page 17
bead. Samples were grinded to powder in a tissue mile (Retsch GmbH, Haan) for 1 min at 30hz (2x). Genomic DNA was extracted using the DNeasy Plant mini Kit (Qiagen) according to the manufacturer‟s instructions. The concentration of the DNA was measured using the Nanodrop ND-1000 spectrophotometer (Peclab, Erlangen) and the integrity of the DNA was checked by running 1µl DNA mixed with 2µl DNA loading dye on a 0.8 % agarose gel. The quantity of the genomic DNA was determined by comparing the band intensity on the gel with a reference λ50 (50 ng/μl) marker with concentrations of 100 ng, 200 ng, 300 ng and 400 ng load on the gel. The concentration of the DNA was adjusted to 50 ng/µl with double distilled water (ddH
2O) and stored at -20 °C until used.
2.2.2.1.2. Total RNA extraction from P. infestans infected potato leaves
About 100 mg frozen P. infestans infected potato leaves was transferred to collection microtube containing one stainless steel bead inside. The leaf transferring was carried out in a box contain liquid nitrogen. The leaf in collection microtube was grinded to fine powder using the tissue mile (Retsch GmbH, Haan). From the grinded leaf powder, total RNA was extracted simultaneously both from potato and P. infestans using TRIzol RNA isolation kit (Ambion). The total RNA was purified from DNA contamination using the DNA-free
TMKit (Ambion). The RNA concentration was measured using the Nanodrop ND-1000 spectrophotometer (Peclab, Erlangen) and the quality of the RNA was determined based on the ratio of absorbance A260nm/A280nm. In addition, the integrity of the RNA was checked by running 2µl total RNA mixed with 2µl DNA loading dye on a 1.5% agarose gel. Total RNA was stored at -80 °C until used.
2.2.2.1.3. Synthesis of first strand cDNA
First strand cDNA was synthesized following the protocol of Maxima H Minus First Strand
cDNA Synthesis Kit (Thermo Scientific). About 2 µg total RNA was mixed with 0.25 µl
oligo (dT)
18primer and 1µl of 10 mM dNTP Mix and reverse transcribed into cDNA by
Maxima H Minus Enzyme Mix in a 20 µl total reaction volume. The synthesized cDNA was
stored at -20 °C until used in further analysis. First strand cDNA was synthesized from RNA
of each genotype and also for the pooled RNA. The cDNA from each genotype was used to
quantify Phytophthora growth in qRT-PCR while the cDNA from the pooled RNA was used
in candidate genes differential expression analysis in qRT-PCR and pyrosequencing.
Page 18
2.2.2.1.4. Polymerase chain reaction (PCR)
Standard PCR reaction was carried out in 25 μl total volume containing 2.5 µ of 10x standard reaction buffer (10 mM Tris-HCL pH 8.3, 50 mM KCl, 1.5 mM MgCl
2, 0.1% Triton X-100l), 2 mM dNTP Mix (2.5 µl), 25 mM MgCl
2(2.5 µl), 10 µM each forward and reverse primers (0.5 µ1, each), 0.2 U Taq DNA Polymerase, ddH
2O and 50 ng of template DNA. For standard PCR, either homemade Taq-Polymerase or the commercial Taq DNA Polymerase (Ampliqon) was used. The PCR reaction was run with 2 min initial denaturation at 94 °C, followed by 40 to 50 cycles with 30 sec denaturation at 94 °C, 30 sec annealing at temperature specific to each primer pair (Table 2.2 and 2.3), and extension (1 min/Kb) at 72
°C. At the end of the cycles, the reaction was run for 10 min at 72 °C. Reactions were generally performed in a Labcycler (SensoQuest GmbH, Göttingen).
2.2.2.1.5. Quantitative real time PCR (qRT-PCR)
The qRT-PCR was performed on a Mastercycler
eprealplex (Eppendorf, Hamburg) or on CFX384 Touch Real-Time PCR (Bio-Rad) using Power SYBR
®Green PCR Master Mix (Applied Biosytems) with 2.5 μl first strand cDNA. PCR cycling conditions were as follows:
Initial denaturation at 95 °C for 10 min followed by 40 cycles of 95 °C for 15s, annealing at temperature specific to each primer pair (Table 2.2) for 30s and extension at 72 °C for 45s.
At the end of the PCR, reactions were tested for undesired primer dimer formation by melting curve analysis. For standard curve analysis, a serial dilution of the cDNA was prepared as 1:10, 1:100 and 1:1000.
For candidates expression analysis, first strand cDNA was diluted 1:5, and 2.5 μL of the dilution was used as template for quantitative amplification. The primer pair used for each tested candidate is showed in Table 2.2. Expression levels of the candidate genes were normalized against transcripts of the SAND gene (Draffehn et al., 2013; Exposito- Rodriguez et al., 2008; Czechowski et al., 2005).
For growth quantification of P. infestans on each genotype, 2.5 μL of the undiluted first
strand cDNA was used. Growth was estimated by quantifying the transcript level of 60S
ribosomal gene L23a (PITG_02694) (Draffehn et al, 2013), using the primer combination 5_-
CGCCTGACCGCTGACTACGA-3_ and 5_-GCGAGAGTGCGATGACGATG-3_.
Page 19 Table 2.2. Primers used in candidate’s expression analysis in qRT-PCR.
Annotation Forward perimer 5' - 3' Reverse primer 5' - 3'
Amplicon size Ta
Arabinogalactan protein (Agp) CTACCCTATTCGTTCCTACCGT CCTCAAACTCCTCATCTCAATG 202 61 Eukaryotic translation initiation factor 4e
type (EIF) GATGCTTCCTTGCGCGAC CATACACATCAGAAGAACTACAGGC 245 60
Clathrin coat assembly protein AP17 (CCAP) CTGCACTTCTCTTCCGGCTG GCCTCTGGAGTTGACAAAAGA 212 53 Avr9/Cf-9 rapidly elicited protein 20 (AC9) AGCCCTTTACACAGCTCGTC AGTTGAATTAATGGAGAAACAGCTT 157 58 Subtilisin-like protease (SLP) GGAAGTGCCAAAGAATACCA TCCCCAGGGAAGTATAATG 217 55 Pectin methyl esterase (PME) CGTGTTGACGAATTTCAGTGAT GGCCAAGTATAAGCATAAATTCTC 110 60 Squalene monooxygenase (SMO) GGCAAAACTAAGTGAACCG AGTTTCAAGAGTTTAGTCCAAC 242 53 Photosystem II core complex proteins (PSP) CCTGCTTTGCTTTGGGTAG AATCATATGGCCAAACGC 250 57 Conserved gene of unknown function (Cgu) GTTATCCACCTCCTGGC AACTTGGCTGCAGGATG 256 54
Polyubiquitin (Pubq) CTTCTGAATGTCCTGTGTCTG GCAGCAAAAACAAAAGAAC 140 54
Kiwellin (Kiw) CTTGGGACTATTGCGATGGT AGTTGAGCGGGCATTGAT 217 58
Salicylic acid-binding protein (SABP) GGTACTGATCATACGGCA TCTCATCACACATTCTTCAA 189 52 Chloroplast protease (Chp) CAAAGCAAGGGAAACAACTCA GACTGGAGATGAATTCCGTGCTAT 289 60 Heat shock cognate 70 kDa protein (HSP70) TCCAATTATTGCCAAGATGTACCA TCAAGCCAAAATACGCAAAAGT 243 60
SAND CTGCTTGGAGGAACAGACG GCAAACAGGACCCCTGAATC 163 58
60S ribosomal protein L23a (RL23a) CGCCTGACCGCTGACTACGA GCGAGAGTGCGATGACGATG 164 64
Ta = annealing temperature; acronym of each candidate is shown in parenthesis
2.2.2.1.6. Pyrosequencing
Primers for pyrosequencing were designed using Pyrosequencing Assay Design Software (Biotage). Pyrosequencing requires three primers, a pair of forward and reverse primers and a third sequencing primer (Ronaghi et al., 1996). The forward and reverse primers were used to amplify 100 to 300 bp DNA fragment containing the SNP of interest by standard PCR and a third sequencing primer was used to sequence a short region around the SNP of interest by pyrosequencing. One of the PCR primers (forward or reverse) was biotin labeled depending on the direction of the sequencing primer. When the sequencing primer was forward, the reverse primer was biotin labeled at the 5‟ end. The forward primer was biotin labeled at the 5‟ end when a reverse sequencing primer was used. To amplify the genomic region containing the SNP of interest, the standard PCR was used (2.2.2.1.4), except that the PCR was run for 50 cycles to avoid any primers leftover that might interfere in pyrosequencing reaction. Only a fragment with a single band corresponded to the size of the amplicon and with good intensity, free from primer dimers was used for further pyrosequencing analysis.
To capture the biotin labeled PCR product by sepharose beads, 15 µl of the PCR product
was mixed with 40 µl of binding buffer (Qiagen), 5 µl of sepharose beads solution and 20 µl
Page 20
water (double distilled and sterilized water). Then the beads containing biotin labeled PCR product was washed with 70% ethanol (for about 3s), denatured into single strand template by 0.2 M NaOH (for about 5s) and rinsed with 10 mM Tris-HCl (pH 7.6) (for about 8s).
Finally, the cleaned beads with biotin labeled single stranded PCR product was transferred to pyrosequencing plate containing 1µl 0.25 µM sequencing primer and 40 µl annealing buffer (Qiagen) in each well. In at least one well, water instead of PCR product was used as a negative control. The plate was heated to 80 °C on a heating block for 2 min, then cooled down to room temperature and placed into the pyrosequencing machine (Pyrosequencer PSQ96
TMMA). The pyrosequencing was performed using pyromark gold Q96 reagents kit (Qiagen) and a PSQTM 96 MA pyrosequencing instrument (Biotage AB) according to manufacturers‟ protocols.
Candidates represented by two allelic SuperSAGE tags that differed by one or two bp and showed contrasting differential expression were analyzed for allele specific expression by pyrosequencing using cDNA as template. The primer pair used for each tested candidate is shown in Table 2.3.
Table 2.3. Primers used in candidate’s expression analysis by pyrosequencing
Annotation Primer 5' - 3' Amplicon size Ta
Delta (7)-sterol-C5 (6)-desaturase (DSD) F: CATACATGGTAAGGTGTGGC 215 57
R:[Btn]CAACGATGGAAACACGAGAC
S:ATGTAATGTGCATGATTTG
Magnesium-protoporphyrin-IX-monomethyl-
ester cyclase (Desaturase) (MPP) F: GGCTTCTGAGTTATTGGCTG 221 51
R:[Btn]CTGATAATACAAGGGAGTGTCC
S:CATGTTCATTGTTGTAAGTT
Hydroxypyruvate reductase (HPR) F: [Btn]TGCCCGAGCATTGTGAATTCAA 287 60
R:CCAGATTGAGAGTGTGGGTAGCT
S: ATATGAGTAAAACTTGTGTC
UPA18 F: CTCCCCCTCCTCCACGAC 203 60
R:[Btn]CAATCCTTCCCCCAATGTC
S:GAAGCGTAGTGGGAAAAT
Biotin carboxylase carrier protein (BCCP) F: [Btn]GTTGATGAACGAAATAGAGGCTG 125 61
R:TTACCCGAACGGTTCTATGGTTT
S:TTCAGCAACAACCTCA
MADS transcription factor (MADS) F: CCTCGAAGAGCTGAAACTGC 194 59
R:[Btn]AGGGAAGTTGCCCTTACTGA
S:CAAAGATGCATTTGAGG
Table 2.3. Continued
Page 21 Table 2.3.
Asparagine synthetase (AspS) F: [Btn]GGAACATTAGTGGTGCTCAAGAA 237 60
R:GGAAGGATCAGCACGTCTTTTAGA
S:GAATAAAAGATCAAAACCAT
Receptor-like protein kinase RLPK) F: GTACCCTGGAGAATCCTAAG 188 52
R:[Btn]GGACAGTCTCTCATATTGGAG
S:AAAAGTTTGTCATGAAACTA
F = forward primer; R = reverse primer; S = sequencing primer; Ta = annealing temperature; [Btn] = the position of biotin; acronym of each candidate is shown in parenthesis