DOI 10.1140/epjc/s10052-012-1971-8 Regular Article - Experimental Physics
Results from 730 kg days of the CRESST-II Dark Matter search
G. Angloher1, M. Bauer2, I. Bavykina1, A. Bento1,5, C. Bucci3, C. Ciemniak4, G. Deuter2, F. von Feilitzsch4, D. Hauff1, P. Huff1, C. Isaila4, J. Jochum2, M. Kiefer1, M. Kimmerle2, J.-C. Lanfranchi4, F. Petricca1, S. Pfister4, W. Potzel4, F. Pröbst1,a, F. Reindl1, S. Roth4, K. Rottler2, C. Sailer2, K. Schäffner1, J. Schmaler1,b, S. Scholl2, W. Seidel1, M.v. Sivers4, L. Stodolsky1, C. Strandhagen2, R. Strauß4, A. Tanzke1, I. Usherov2, S. Wawoczny4, M. Willers4, A. Zöller4
1Max-Planck-Institut für Physik, 80805 München, Germany
2Eberhard-Karls-Universität Tübingen, 72076 Tübingen, Germany
3Laboratori Nazionali del Gran Sasso, INFN, 67010 Assergi, Italy
4Physik-Department E15, Technische Universität München, 85747 Garching, Germany
5Departamento de Fisica, Universidade de Coimbra, 3004 516 Coimbra, Portugal
Received: 29 July 2011 / Revised: 7 March 2012 / Published online: 12 April 2012
© The Author(s) 2012. This article is published with open access at Springerlink.com
Abstract The CRESST-II cryogenic Dark Matter search, aiming at detection of WIMPs via elastic scattering off nu- clei in CaWO4crystals, completed 730 kg days of data tak- ing in 2011. We present the data collected with eight de- tector modules, each with a two-channel readout; one for a phonon signal and the other for coincidently produced scin- tillation light. The former provides a precise measure of the energy deposited by an interaction, and the ratio of scintil- lation light to deposited energy can be used to discriminate different types of interacting particles and thus to distinguish possible signal events from the dominant backgrounds.
Sixty-seven events are found in the acceptance region where a WIMP signal in the form of low energy nuclear recoils would be expected. We estimate background contri- butions to this observation from four sources: (1) “leakage”
from the e/γ-band (2) “leakage” from theα-particle band (3) neutrons and (4)206Pb recoils from210Po decay. Using a maximum likelihood analysis, we find, at a statistical sig- nificance of more than 4σ, that these sources alone are not sufficient to explain the data. The addition of a signal due to scattering of relatively light WIMPs could account for this discrepancy, and we determine the associated WIMP param- eters.
1 Introduction
The nature of Dark Matter remains one of the outstanding questions of present-day physics. There is convincing evi-
ae-mail:proebst@mpp.mpg.de
be-mail:jschmale@mpp.mpg.de
dence for its existence on all astrophysical scales and many theories predict particle candidates that may be able to ex- plain its composition. However, in spite of numerous at- tempts, Dark Matter particles have not been unambiguously detected so far.
Several experiments currently aim for direct detection of Dark Matter, mostly focusing on a particular class of parti- cles, the so-called WIMPs (Weakly Interacting Massive Par- ticles). WIMPs nowadays are among the most investigated and best motivated candidates to explain Dark Matter. If they exist, they could be present in our galaxy in the form of a halo, constituting the majority of the galactic mass. Rare in- teractions with ordinary matter would then possibly be de- tectable in earthbound experiments.
One such project is CRESST-II (Cryogenic Rare Event Search with Superconducting Thermometers), located at the Laboratori Nazionali del Gran Sasso in Italy. In this exper- iment we aim for detection of the WIMPs via their scatter- ing off nuclei. The main challenges of this kind of measure- ment are to detect the tiny amounts of recoil energy trans- ferred to the nucleus (O(10 keV)), and to achieve sufficient background suppression to be sensitive to the extremely low rate of anticipated interactions (not more than a few tens of events per kilogram and year).
To meet these requirements, CRESST uses cryogenic de- tectors in a low-background environment. Furthermore, the scintillating target material CaWO4 allows for a discrimi- nation of the type of interacting particle. In this way, po- tential rare WIMP interactions can be distinguished from events which were induced by the dominant radioactive backgrounds.
In this article, we report on the latest data obtained with the CRESST setup. They comprise a total net exposure of about 730 kg d, collected between 2009 and 2011. The struc- ture of the paper is as follows: Sect.2starts with a brief in- troduction to the experimental setup. Section3gives the new aspects of the present run and summarizes the observations.
The choice of an appropriate acceptance region and the pos- sible backgrounds relevant in this region are discussed. In Sect.4, we give a qualitative description and estimation of the backgrounds. Section5 then describes the quantitative treatment in the framework of a maximum likelihood analy- sis. The results of this analysis are then discussed in Sect.6.
Finally, Sect.7gives the outlook for future runs of the ex- periment.
2 Experimental setup
A detailed description of the CRESST-II setup was the sub- ject of earlier publications [1,2]. Here, we restrict ourselves to a few key aspects relevant for the discussion of the new results.
2.1 Target material
As a target for WIMP interactions, CRESST uses scintillat- ing CaWO4crystals. They have a cylindrical shape (40 mm in diameter and height) and weigh about 300 g each. The current experimental setup can accommodate up to 33 of these crystals, constituting a maximum target mass of about 10 kg.
Under the usual assumption of coherent WIMP scatter- ings off nuclei, the scattering cross section contains anA2 enhancement (with the mass number A of the target nu- cleus). In this case one expects that the total scattering rate in CaWO4is dominated by interactions with the heavy tung- sten nuclei. However, due to kinematics a heavier nucleus tends to receive a smaller recoil energy, and in a detector with a finite energy threshold the other constituents can also become relevant despite the coherence effect. To illustrate this point, Fig.1 shows, as a function of the WIMP mass, the contributions of the three elements in CaWO4to the to- tal rate of WIMP interactions in the energy interval 12 to 40 keV, the range typical of the CRESST detectors.
For low WIMP masses, up to about 12 GeV, the scatter- ings off tungsten are completely below threshold, and oxy- gen and calcium recoils give the only possible Dark Matter signal. On the other hand, above WIMP masses of about 30 GeV, tungsten completely dominates. When looking for possible WIMP interactions we therefore consider recoils of all three types of nuclei in CaWO4, in order to be sensitive to the largest possible range of WIMP masses.
Fig. 1 Contributions of the three types of nuclei present in a CaWO4
target to the total rate of WIMP interactions, as a function of the WIMP mass and for a cross-section of 1 pb, assuming coherent∼A2interac- tions. The calculation assumes a detector with a sensitive energy range between 12 and 40 keV
2.2 Phonon and light detectors
In order to be able to detect the low energy nuclear recoils the target crystals are operated as cryogenic calorimeters at temperatures of about 10 mK. The energy deposited by an interacting particle is mainly converted into phonons, which are then detected with a transition edge sensor (TES). We thus denote the target crystals with their TES as phonon de- tectors.
The TES is a thin tungsten film evaporated onto the crys- tal, with the temperature stabilized in the transition from the normal to the superconducting state. The tiny change of the film temperature (O(µK)) induced by the absorption of the phonons leads to a measurable change in resistance. This signal is read out by SQUID-based electronics. The ampli- tude of the signal is a precise measure of the deposited en- ergy. After the interaction, the crystal temperature relaxes back to the equilibrium state via a weak thermal coupling to the heat bath.
In addition to the phonon signal, a small fraction of the energy deposited in the target crystal is converted into scin- tillation light. Each crystal is paired with a separate cryo- genic light detector in order to detect this light signal. Most of the light detectors are made from a silicon-on-sapphire wafer (a sapphire wafer of 40 mm diameter and 0.46 mm thickness, with a 1 µm silicon layer on one side, which acts as photon absorber). As an alternative, some light detectors consist of pure silicon wafers of the same size. Similar to the target crystals, each light detector is equipped with a tung- sten transition edge sensor to determine the energy deposited by the absorption of scintillation photons.
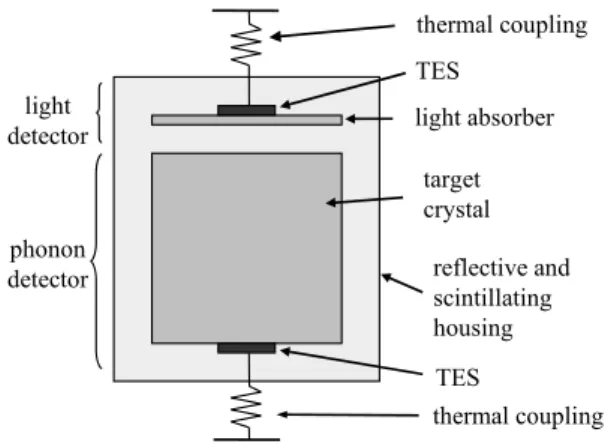
A crystal and the corresponding light detector form a so- called detector module as shown in Fig.2. Both detectors of a module are held by thin, silver-coated bronze clamps and
Fig. 2 Schematic drawing of a CRESST detector module, consisting of the target crystal and an independent light detector. Both are read out by transition edge sensors (TES) and are enclosed in a common reflective and scintillating housing
are enclosed in a common, highly light reflective housing in order to collect as much scintillation light as possible. The reflector is a polymeric foil which also scintillates. This will be discussed in detail in Sect.2.4.
2.3 Quenching factors and background discrimination For each particle interaction, a detector module yields two coincident signals (one from the phonon and one from the light detector). While the phonon channel provides a sensi- tive measurement of the total energy deposition in the target (approximately independent of the type of interacting par- ticle), the light signal can be used to discriminate different types of interactions. To this end, we define the light yield of an event as the ratio of energy measured with the light detector divided by the energy measured with the phonon detector. We normalize the energy scale of the light channel such that 122 keVγ’s from a57Co calibration source have a light yield of unity. With this normalization electron re- coils induced either byβsources or by gamma interactions, generally have a light yield of about 1. On the other hand, α’s and nuclear recoils are found to have a lower light yield.
We quantify this reduction by assigning a quenching factor (QF) to each type of interaction. The QF describes the light output expressed as a percentage of the light output for aγ of the same deposited energy.
Some quenching factors can be directly determined from CRESST data. For example, neutrons detectably scatter mainly off the oxygen nuclei in CaWO4. The QF for oxy- gen can thus be determined from a neutron calibration run which took place during the data taking discussed here. The result is
QFO=(10.4±0.5)%.
Moreover, the quenching factor for low energyα’s can be found to be about 22 %, usingα-events in the current data
Fig. 3 Illustration of background events due to surface contaminations with210Po
set. Similarly, the value for lead can be inferred to be around 1.4 %. Both measurements will be discussed below.
Other types of interactions (in particular calcium and tungsten recoils) are not observed with sufficient statistics in CRESST, and their quenching factors must be determined in dedicated experiments [3]:
QFCa=
6.38+−0.620.65
% QFW=
3.91+−0.480.43
%.
Corresponding to these different values, there will be char- acteristic “bands” for the different particles or recoils in the light yield-energy plane. This allows for an excellent discrimination between potential signal events (expected to show up as nuclear recoils) and the dominant radioactive backgrounds (mainlye/γ-events).
Furthermore, it is even partially possible to determine which type of nucleus is recoiling. Such a discrimination is possible to the extent to which the different nuclear re- coil bands in the light yield-energy plane can be separated within the resolution of the light channel. This then allows a study of potential WIMP interactions with different tar- get nuclei, in parallel in the same setup. Such a possibility can be particularly relevant for the verification of a positive WIMP signal, and is a distinctive feature of CRESST.
2.4 Scintillating housing
As mentioned above, the housing of the detector modules consists mainly of a reflecting and scintillating polymeric foil. Making all surfaces in the vicinity of the detectors scin- tillating is important in discriminating background events due to contamination of surfaces withα-emitters. The ba- sic mechanism of this background is illustrated in Fig.3.
The most important isotope in this context is210Po, a de- cay product of the gas222Rn. It can be present on or im- planted in the surfaces of the detectors and surrounding ma- terial. The210Po nuclei decay to206Pb, giving a 5.3 MeV α-particle and a 103 keV recoiling lead nucleus. It can hap- pen that the lead nucleus hits the target crystal and deposits
its energy there, while theα-particle escapes. Due to its low quenching factor, the lead nucleus can often not be distin- guished from a tungsten recoil and thus can mimic a WIMP interaction.
However, if the polonium mother nucleus was located on the surface of the target crystal or implanted in it (the upper case in Fig.3), the full 103 keV of the daughter nucleus plus a possible contribution from the escapingα-particle will be deposited in the target and the event will lie above the energy range relevant for the WIMP search.
Another situation arises when the polonium atom was im- planted in a surrounding surface. Then the daughter Pb nu- cleus can lose part of its energy on the way to the target crystal and appear in the energy range of interest (the lower case in Fig.3). This possibly dangerous background can be rendered harmless if the surrounding surfaces are scintillat- ing; in this case the escapingα-particle produces additional scintillation light when hitting those surfaces and the event will appear as high-light event in distinction to the low-light nuclear recoils.
Hence the scintillation of the complete surroundings of the target crystals plays an important role. With the scin- tillating foil used as a module housing, currently the only non-scintillating surfaces inside the detector modules are the small clamps which hold the target crystals. In earlier runs, attempts were made to cover these clamps with scintillat- ing layers as well, but these layers appeared to give rise to thermal relaxation events. The current module design there- fore avoids any scintillating (plastic) material in direct con- tact with the crystals. The price for this measure, however, is the presence of several Pb recoil events with energies of 103 keV and below in the data set, as expected from the above discussion. This background must therefore be taken into account in our analysis.
2.5 Shielding
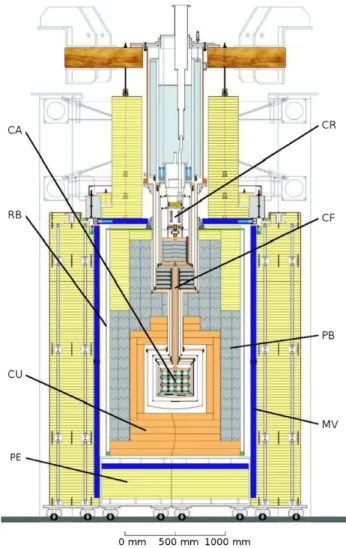
Figure4shows a schematic drawing of the whole CRESST setup, with the detector modules in the very center. The low temperatures are provided by a3He–4He dilution refrigera- tor and transferred to the detectors via a 1.3 m long copper cold finger. The detector volume is surrounded by several layers of shielding against the main types of background ra- diation: layers of highly pure copper and lead shield against γ-rays, while polyethylene serves as a moderator for neu- trons. The inner layers of shielding are contained in a gas tight box to prevent radon from penetrating them. In addi- tion, an active muon veto using plastic scintillator panels is installed to tag muons. The veto surrounds the lead and cop- per shielding and covers 98.7 % of the solid angle around the detectors, a small hole on top is necessary to leave space for the cryostat.
Fig. 4 Schematic drawing of the CRESST setup. A cold finger (CF) links the cryostat (CR) to the experimental volume, where the detec- tors are arranged in a common support structure, the so-called carousel (CA). This volume is surrounded by layers of shielding from copper (CU), lead (PB), and polyethylene (PE). The copper and lead shield- ings are additionally enclosed in a radon box (RB). An active muon veto (MV) tags events which are induced by cosmic radiation
2.6 Data analysis
We apply just a few basic quality cuts to the raw data in or- der to ensure that only valid events, with well-reconstructed energies in the phonon and light channel, are considered for further analysis. In particular, we require that both the phonon and light detector of a given module were fully op- erational and running stably at their respective operating points at the time of an event. Data acquisition, readout, and the procedures for monitoring detector stability, trigger effi- ciency as well as reconstructing the deposited energy from the measured pulses are described elsewhere [1]. All cuts were adjusted on a small subset of the data (about 10 % of the data set, taken from the beginning of the run) and then blindly applied to the full data set.
For the final data set, we reject events coincident with a signal in the muon veto as well as those events with coinci- dent signals in more than one detector module, since multi- ple scatterings are excluded for WIMPs in view of their rare interactions.
An important aspect of the analysis concerns the bands in the light yield-energy plane. Thee/γ-band is highly popu- lated due to the relatively high rate of common backgrounds.
This allows us to extract the position and, in particular, the energy-dependent width of this band directly from the mea- sured data. The observed width is dominated by the light channel resolution compared to which the resolution of the phonon channel is much superior. This is understandable in view of the small fraction of the deposited energy appearing as light.
We extract the resolution of the light channel as a func- tion of light energy by fitting the e/γ-band with a Gaus- sian of energy dependent center and width. We note that, although the production of scintillation light is governed by Poisson statistics, the Gaussian model is a very good ap- proximation in our regions of interest. This is because the e/γ-events produce a sufficiently large number of photons for the Poisson distribution to be well approximated by a Gaussian. On the other hand, for the quenched bands with low light yields, the Gaussian baseline noise of the light de- tector determines the resolution.
The position and width of the bands other than thee/γ- band can be calculated based on the known quenching fac- tors discussed above and using the light channel resolutions obtained from the fit to the e/γ-band. In order to get the width of a quenched band at a certain energy the light chan- nel resolution for the actual light energy is used.
To validate this calculation for quenched bands, we use the data from a calibration measurement with an AmBe neutron source placed outside the Pb/Cu shielding. We ex- pect the neutrons to mainly induce oxygen recoils. Figure5 shows the data obtained by one detector module in this mea- surement, together with the calculated central 80 % band for oxygen recoils (10 % of the events are expected above the upper and 10 % below the lower boundary). At very small recoil energies, where the light signal is smaller than the baseline noise, the standard event fit of the light signal may deliver negative pulse amplitudes, resulting in the negative light yields in Fig.5.
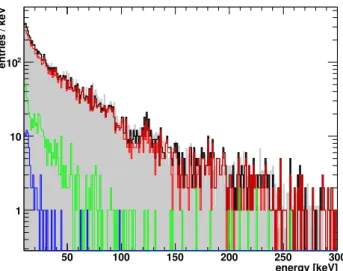
The measured energy spectrum of nuclear recoil events is shown in Fig.6(the grey histogram). Recoil energies up to about 300 keV are observed, with the spectrum falling off quickly towards high energies. Thereby, the highest en- ergies are possible for oxygen recoils, since in neutron- nucleus elastic scattering the recoil energy of the nucleus is inversely proportional to its mass. Simply from the ratio of the mass numbers we then expect the highest energy of calcium recoils to be around 100 keV. This kinematic argu- ment is nicely confirmed by a Monte Carlo simulation of the
Fig. 5 Data obtained with one detector module in a calibration mea- surement with an AmBe neutron source, with the source placed outside the lead shielding. The solid red lines mark the boundary of the calcu- lated oxygen recoil band (10 % of events are expected above the upper and 10 % below the lower boundary). The vertical dashed lines indi- cate the lower and upper energy bounds of the WIMP acceptance re- gion as will be introduced in Sect.3. Neutron scatterings above about 100 keV are purely on oxygen nuclei (see text) while towards lower energies the fraction of calcium recoils increases. With the present res- olution calcium and oxygen recoils cannot be distinguished
Fig. 6 The energy spectrum of nuclear recoils induced by an AmBe neutron source mounted outside the lead/copper shielding. The mea- sured spectrum (grey) is well matched by the Monte Carlo simulation (black). The simulation also yields the individual contributions from neutron scatterings off oxygen (red), calcium (green), and tungsten (blue) nuclei. Oxygen largely dominates at all energies and is the only relevant contribution above 100 keV (Color figure online)
neutron calibration run, the results of which are also given in Fig. 6. Plotted are the total simulated energy spectrum (black) which closely follows the measured data, as well as the contributions from oxygen (red), calcium (green), and tungsten (blue) recoils.
As expected, above 100 keV we observe almost purely oxygen recoils. Looking at Fig.5, their distribution fits well
into the calculated oxygen band. Towards lower energies, the observed events are still in agreement with the predic- tion, although an increasing contribution from calcium re- coils slightly shifts the center of the observed event distribu- tion to lower light yields.
3 The latest experimental run
3.1 Data set
The latest run of CRESST took place between June 2009 and April 2011. It included a neutron test andγ-calibrations with57Co and232Th sources. In total, 18 detector modules were installed in the cryostat, out of which ten were fully operated. The remaining modules cannot be employed for a Dark Matter analysis, principally due to difficulties in cool- ing the light detectors. However, seven additional individual detectors (six phonon and one light detector) were still oper- ated in order to tag coincident events (with signals in more than one module).
One of the ten operational modules was equipped with a test ZnWO4crystal and we do not include it in this analysis because of uncertainties in the quenching factors in this ma- terial. Another operational detector module had unusually poor energy resolution, with practically no sensitivity in the WIMP signal region, and was therefore excluded from the analysis. The data discussed in this paper were thus col- lected by eight detector modules, between July 2009 and March 2011. They correspond to a total net exposure (after cuts) of about 730 kg days, distributed between the detector modules as shown in Table1.
3.2 Observed event classes
Figure7shows an example of the data obtained by one de- tector module, presented in the light yield-energy plane.
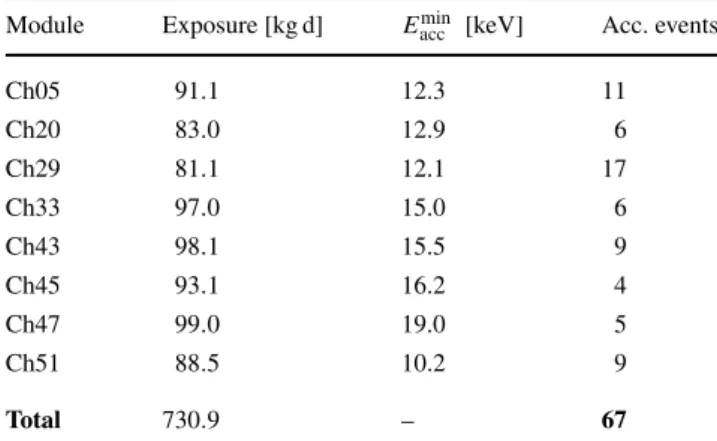
Table 1 The exposures, lower energy limitsEaccminof the acceptance regions, and the number of observed events in the acceptance region of each detector module
Module Exposure [kg d] Eminacc [keV] Acc. events
Ch05 91.1 12.3 11
Ch20 83.0 12.9 6
Ch29 81.1 12.1 17
Ch33 97.0 15.0 6
Ch43 98.1 15.5 9
Ch45 93.1 16.2 4
Ch47 99.0 19.0 5
Ch51 88.5 10.2 9
Total 730.9 – 67
Thee/γ-events are observed around a light yield of 1.
The calculated bands forα’s, oxygen recoils, and tungsten recoils are shown.1The spread of a band at each energy is chosen so that it contains 80 % of the events, that is 10 % of the events are expected above the upper boundary and 10 % of the events are expected below the lower boundary.
This convention will be used throughout the following dis- cussion whenever we refer to events being inside or outside of a band.
Beside the dominante/γ-background, we identify sev- eral other classes of events:
Firstly, we observe low energy α’s with energies of 100 keV and less. They can be understood as a consequence of anα-contamination in the non-scintillating clamps hold- ing the crystals. If theα-particle has lost most of its energy in the clamp before reaching the target crystal, it can appear at low energy. The rate of suchα-events differs by some fac- tor of two among the detector modules (see Sect.4.2).
Secondly, Fig.7shows a characteristic event population in and below the tungsten band around 100 keV. This is present in all detector modules, albeit the number of events varies. This population can be attributed to the lead nuclei from210Poα-decays on the holding clamps (see Sect.2.4).
The distribution of these events exhibits a low-energy tail, with decreasing density towards lower energies. In spite of this decrease, there are detector modules (the ones with a
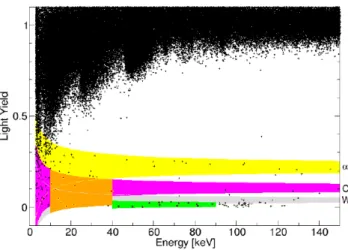
Fig. 7 The data of one detector module (Ch20), shown in the light yield vs. recoil energy plane. The large number of events in the band around a light yield of 1 is due to electron and gamma background events. The black line is the boundary below which 0.1 % of these e/γ-events are expected at each energy. The shaded areas indicate the bands, where alpha (yellow), oxygen (violet), and tungsten (gray) re- coil events are expected. Additionally highlighted are the acceptance region used in this work (orange), the reference region in theα-band (blue), as well as the events observed in these two regions. See text for discussion (Color figure online)
1The calcium band is not shown for clarity. It is located roughly in the middle between the oxygen and the tungsten bands.
high population of such lead events) in which the tail visibly reaches down to energies as low as a few tens of keV.
Events without scintillation light might result from re- laxation processes connected with an improper mounting of the CaWO4 crystals. The mounting in the present run was designed to avoid such relaxation processes and there is no indication that such events are present in the data. Possi- ble mechanisms for the creation of such relaxation events and our measures of preventing them are discussed in Ap- pendixB.
Finally, low energy events are present in the oxygen, (cal- cium,) and tungsten bands at energies up to a few tens of keV, i.e. in the region of interest for the WIMP search. These events will be the main focus of our discussion in the follow- ing. We start by defining the acceptance region on which the discussion will be based.
3.3 Acceptance region
Depending on the mass of a possible WIMP, any of the nu- clei in CaWO4can be a relevant target for WIMP scattering as discussed above. We therefore choose our acceptance re- gion such that it includes all three kinds of nuclear recoils:
it is located between the upper boundary of the oxygen band and the lower boundary of the tungsten band. This selection automatically includes the calcium band.
We restrict the accepted recoil energies to below 40 keV, since as a result of the incoming WIMP velocities and nu- clear form factors, no significant WIMP signal is expected at higher energies. On the other hand, towards low energies the finite detector resolution leads to an increasing leakage of e/γ-events into the nuclear recoil bands. Figure7 illus- trates this fact by showing the boundary (black line) below which 0.1 % of thee/γ-events at the respective energy are expected. We limit this background in the acceptance region by imposing a lower energy bound Eaccmin in each detector module, chosen such that the total expected e/γ-leakage into the acceptance region of this module is one event in the whole data set. The leakage calculation is based on the fit to the observede/γ-distribution in the Dark Matter data set as described in Sect.5.2. Due to the different resolutions and levels ofe/γ-background in the crystals, each module is characterized by an individual value ofEaccmin. Table1lists the values ofEaccminfor all modules.
An example of the resulting acceptance region is shown (orange) in Fig.7and the events observed therein are high- lighted. In the sum over all eight detector modules, we then find 67 accepted events, the origin of which we will dis- cuss in the following. Table1shows the distribution of these events among the different detector modules. SinceEaccminas well as the width of the bands are module-dependent, dif- ferent modules have different sized acceptance regions and thus different expectations with respect to background and signal contributions.
3.4 Backgrounds in the acceptance region
With the above choice of the acceptance region, four sources of background events can be identified:
1. leakage ofe/γ-events at low energies, 2. α-events due to overlap with theα-band,
3. neutron scatterings which mainly induce oxygen recoils in the energy range of interest, and
4. lead recoils fromα-decays at the surface of the clamps, degraded to low energy.
In the following, we estimate the contribution of each of the four sources of background listed before and finally investigate a possible excess above this expectation. When present, such an excess may be the result of WIMP scat- terings in our detectors, or of course an unsuspected back- ground.
We estimate the backgrounds and the contribution of a possible WIMP signal in the framework of a maximum like- lihood fit that allows a treatment with all relevant parameters and their uncertainties simultaneously. However, before in- troducing this rather abstract formalism in Sect.5, we give a qualitative discussion of the backgrounds, with the aim of clarifying the basic arguments and assumptions.
4 Qualitative background discussion
4.1 e/γ-Background
The lower energy bound of the acceptance region is chosen such that we expect a leakage of one backgrounde/γ-event per detector module. These events are expected to appear mainly at the low energy boundary of the acceptance region where the overlap between the bands is largest and towards the upper boundary, closer to thee/γ-band. The quantitative modeling is discussed in Sect.5.2.
4.2 α-Background
Since theα-band has some overlap with the acceptance re- gion, some low energy α-events may be misidentified as oxygen or even calcium or tungsten recoils. This will lead to a certain expectationnαaccof background events in the ac- ceptance region of each module.
The energy spectrum dNα/dE of the low energy events in theα-band appears to be flat within the available statis- tics. In order to estimate dNα/dE, we first select a reference region of theα-band which is free of overlap to any other band.
An example of such a reference region is highlighted (blue) in Fig.7. To obtain reasonable statistics, we have cho- sen the relatively large energy range of 100 keV for the ref- erence region. The low energy limitErefminof the reference
Table 2 Lower energy limits Erefmin of theα-reference regions, ob- served alpha counts nαref in the reference regions, and the resulting (rough) estimates of the alpha backgroundnαaccin the acceptance re- gions of all detector modules
Module Eminref [keV] nαref nαacc
Ch05 21.7 17 1.6
Ch20 21.3 14 1.5
Ch29 21.7 14 1.2
Ch33 28.3 8 0.9
Ch43 29.7 8 0.6
Ch45 24.7 5 0.8
Ch47 32.2 9 1.2
Ch51 18.3 18 1.4
Total – 93 9.2
region is chosen as low as possible, while taking into ac- count the increasinge/γ-leakage into the α-band towards low energies. Low Erefmin are desirable, since the reference region should naturally be close to the acceptance region to minimize extrapolation errors. On the other hand, influences of the e/γ-background on the α-estimate should be mini- mized and the value ofErefminwas thus chosen such that only 0.1 counts ofe/γ-leakage are expected in the whole refer- ence region for each detector module. Since the width of the bands varies from module to module, each module has its own value ofErefmin. These values are listed in Table2.
For our first rough estimate of the alpha background in the acceptance region, we simply count events in the ref- erence region. We then assume constant dNα/dEand cal- culate the ratio of α-events expected in the acceptance re- gion to those expected in the reference region. Scaling the observed number of events in the reference region by this ratio, we arrive at an estimate of the α-background in the acceptance region.
Table 2 summarizes the observed alpha counts nαref in the reference region and the resulting estimates of the al- pha backgroundnαaccin the acceptance region of each mod- ule. This results in a total expectedα-background of about 9.2 events.
In the likelihood analysis of Sect.5, we will relax the as- sumption of constant dNα/dE and also allow for a linear term in the α-energy spectrum. We will, however, see that the simple estimate given here is quite close to the one ob- tained with the more sophisticated analysis.
4.3 Neutron background 4.3.1 Introduction
Throughout our discussion, we distinguish two different classes of neutron production mechanisms:
Firstly, free neutrons can be emitted by radioactive pro- cesses, in particular spontaneous fission (s.f.) of heavy ele- ments or(α, n)reactions on light nuclei. Such neutrons typi- cally have energies up to a few MeV, for which the polyethy- lene shielding provides a very efficient moderator. Monte Carlo simulations suggest that neutrons from s.f. and(α, n) reactions in the rock outside the experiment thus only con- stitute a negligible background at the level of 10−5events per kg d [4]. Therefore, such neutrons are a possibly rele- vant background only if they are emitted inside the neutron shielding, e.g. by s.f. of 238U in the lead shielding, or by (α, n)reactions or s.f. in the copper shielding. We consider such neutrons here, even though Monte Carlo simulations predict only a negligible background in the acceptance re- gion due to these processes, at a level of 10−3 events per kg d [5].
Secondly, neutrons can also be produced by muons, ei- ther in the lead or copper shielding or in the surrounding rock. In the former case, the muon will mostly be tagged by the muon veto enclosing the Pb/Cu shielding. However, there is a small probability that the muon is missed by the veto because of the hole on top of the setup, as mentioned above (cf. Fig.4). Such a muon may create a shower of neu- trons inside the PE shielding which then reach the detectors.
On the other hand, muon-induced neutrons created outside the neutron shielding may penetrate the polyethylene layers if they are energetic enough. Such high energy neutrons then have a high probability to scatter inelastically in the Pb/Cu shielding and to create secondary neutrons and gammas. Ul- timately, this leads to events with similar characteristics as when the shower is directly induced by a muon inside the PE shielding.
4.3.2 Experimental information
It is a characteristic feature of neutrons that they can lead to coincident events in more than one detector module at the same time, with at least one module registering a nuclear re- coil. A given neutron source will thereby lead to events with a characteristic ratio between single and coincident scatter- ings. If this ratio is known, the observed coincidences can be exploited to estimate the expected number of single neu- tron (background) events. This is the basic concept pursued in the following.
We shall base our discussion on two sources of informa- tion. One is the results of the neutron test with an AmBe neutron source already mentioned above. The second is the examination of events in coincidence with incoming muons, i.e. muon veto triggers accompanied with a signal in the ac- ceptance region of a module. These two “calibration mea- surements” are used to infer the properties of neutron back- grounds originating from ambient neutrons and from muons
escaping the veto and interacting in the apparatus. We em- phasize that Monte Carlo or other external information is helpful, but does not enter into our quantitative estimates.
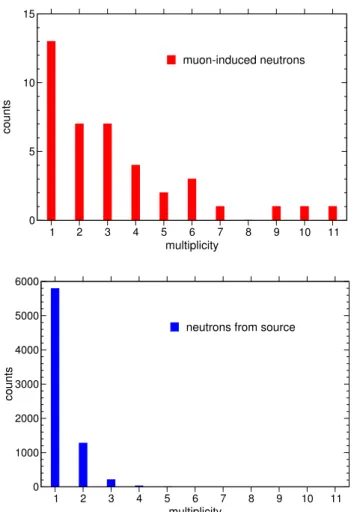
For each type of neutron mechanism, we use the cor- responding calibration to infer the typical structure of the events with respect to their multiplicity, defined as the num- ber of detector modules triggering at the same time (within a time window of 5 ms). For muon-induced neutrons, we ob- serve 40 events coincident with a muon veto trigger and with at least one detector module having a signal in its acceptance region. The multiplicities of these events are shown in the top histogram of Fig.8. On the other hand, the multiplicities of the events induced by the AmBe neutron source (placed at various positions outside the Pb/Cu shielding but inside the neutron shielding) are given in the bottom histogram of Fig.8.
Events due to muon-induced neutrons show an obviously higher average multiplicity than events from the neutron test source. This evidently results from muon-induced cascades, leading to neutrons and gammas in different detector mod- ules at the same time.
With this information at hand, we turn back to the Dark Matter data set. In addition to the 67 accepted events, these data contain three events in which several detector modules triggered in coincidence, with at least one module register- ing an event in its acceptance region. Two of these events have a multiplicity of three (i.e. three modules triggered), while in the third event five modules triggered in coinci- dence. Such coincidences which include at least one nuclear recoil must involve a neutron, and perhapsγ’s. Accidental coincidences may be neglected in view of the low overall counting rate.
Based on these three coincident events we can use the calibration information given above to scale up to the num- ber of expected single scatters for each type of source.
For a first rough estimate of the level of neutron back- ground, we start with the three observed coincidences and neglect their precise multiplicities. From the histograms in Fig.8, we find that muon-induced neutrons are character- ized by a ratio of single to coincident scatterings of about 0.5, while the neutron source test gives a ratio of about 3.8.
Consequently, if we assume that only muon-induced neu- trons are present in the experiment, this would lead to an estimated number of single scatterings of 3·0.5=1.5. On the other hand, in case the neutron background purely comes from a radioactive source, the same estimate gives a back- ground expectation of about 3·3.8=11.4 single events.
In reality, both types of neutrons may be present, and the above limiting cases show the extremes between which the expected neutron background can lie according to this esti- mate. Our likelihood analysis of Sect.5 takes into account the more detailed information of the individual event multi- plicities in order to clarify the contributions of the two types
Fig. 8 Multiplicity (i.e. the number of modules which triggered in co- incidence) of events which include a nuclear recoil in the acceptance region of at least one detector module. Top: muon-induced events, bot- tom: events from an AmBe neutron source
of neutron sources to the total background. We will, how- ever, see that the result is compatible with the simple esti- mates of the limiting cases given here.
An independent aspect of the neutron background con- cerns the corresponding recoil energy spectrum. Within our narrow accepted energy range, the energy spectra induced by the two types of neutron events are found to be very similar, according to the calibration data discussed above.
The spectrum can be parametrized by a simple exponen- tial dNn/dE∝exp(−E/Edec). We determine the parameter Edecfrom a fit to the spectrum obtained in the AmBe neu- tron calibration run. In the energy range between 12 keV to 40 keV we obtainEdec=(23.54±0.92)keV.
This similarity in the spectra induced by neutrons from the two quite different sources (in agreement with Monte Carlo results [5]) indicates how the Pb/Cu shielding sur- rounding the detectors will moderate an incoming neutron flux regardless of its origin. The primary spectrum of the neutrons is washed out by inelastic scatterings in the shield- ing. This finding supports our use of the results of the neu-
Fig. 9 The data of detector module Ch51, shown in the light yield vs.
recoil energy plane. Again, the shaded areas indicate the bands, where alpha (yellow), oxygen (violet), and tungsten (gray) recoil events are expected. Additionally highlighted are the acceptance region (orange), the region where lead recoils with energies between 40 and 90 keV are expected (green), and the events observed in these regions. The highlighted lead recoil region (green) serves as a reference region for estimating the206Pb recoil background (Color figure online)
tron calibration to estimate the effects of a general neutron background. The only exception to this argument might be a neutron-producing contamination in close vicinity of the detectors. In this case, we would expect a recoil spectrum reaching to much higher energies and some fewer singles for a given number of coincidences. In this case, the application of our above calibration results would lead to a conservative neutron background estimate.
4.4 Lead recoil background
To illustrate the lead recoil background from 210Po decay, Fig.9 displays the data set of a different detector module as in Fig.7. Compared to Fig.7, a more prominent popu- lation of 206Pb recoils below the tungsten band is visible, with a rather long tail extending down to the acceptance re- gion. Since the lead band and the acceptance region overlap considerably, a leakage of some206Pb events into the accep- tance region cannot be excluded.
For an estimate of this background, we follow a simi- lar strategy as for theα-background. We define a reference region for each detector module which contains predomi- nantly206Pb recoils, and model the spectral energy density dNPb/dEin this region. This model is then extrapolated into the energy range of the acceptance region.
As a reference region, we choose the lead recoil band at energies above the acceptance region, where a possible WIMP signal cannot contribute. In some detector modules with wider bands, the lead band still overlaps with the oxy- gen band around the lower edge of this energy range. In this case, we additionally restrict the reference region to the
Table 3 Observed countsnPbref in the lead reference regions of the detector modules
Module nPbref
Ch05 17
Ch20 6
Ch29 14
Ch33 6
Ch43 12
Ch45 15
Ch47 7
Ch51 12
Total 89
lower part of the lead band without overlap with the oxygen band in order to be independent of possible neutron-induced events on oxygen. The event distribution of the Pb recoils peaks at the full lead recoil energy of 103 keV and the up- per boundary of the reference region is set at 90 keV so that it covers the low energy tail. An example of the resulting reference region is highlighted in green in Fig.9. Table3 summarizes the countsnPbrefobserved in the reference region of each detector module.
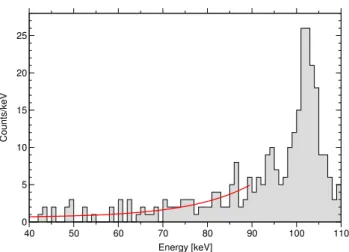
Figure 10 presents the energy spectrum of the events found in the206Pb reference regions of all detector modules, but includes also lead recoils with higher energies to illus- trate the peak at the full nominal recoil energy of 103 keV.
In the energy range of the reference region (below 90 keV), the tail of the distribution can be modeled by an exponential decay on top of a constant contribution:
dNPb
dE (E)=APb·
CPb+exp
E−90 keV EdecayPb
. (1)
For a first rough estimate of the recoil background, we simply fit such a function to the spectrum of Fig. 10.
The red line shows the result of this fit with the param- eters APb=4.53 counts/keV, CPb =0.13 and EdecayPb = 13.72 keV. This model then needs to be extrapolated into the energy range of the acceptance region.
To check the validity of this extrapolation we used the SRIM package [6] to simulate the energy spectra expected for three different depth distributions of the210Po mother nucleus. These distributions were: an exponential profile with 3 nm decay length peaking at the surface, a uniform distribution in the volume, and finally the depth distribution resulting from implantation due to preceding alpha decays.
For the latter case the implantation profile was also calcu- lated with SRIM, assuming that222Rn is first adsorbed on the surface of the clamps holding the crystals, followed by two subsequent alpha decays to 210Po. The results of the three simulations are shown in Fig.11.
An important result of the simulation is that none of the calculated spectra of the Pb recoils rises significantly to-
Fig. 10 Energy spectrum of events in the206Pb reference region of all detector modules. Events occurring in the lead band at energies above the upper energy limit of the reference region are included to show the peak at the nominal recoil energy of 103 keV. The curve (red) is a fit of the histogram with an exponential plus a constant term, in the energy range of the reference region
Fig. 11 Energy spectrum of206Pb recoils calculated with the SRIM package for three different depth profiles of the alpha emitting210Po parent nuclei: (top) distribution peaking at the surface with a 3 nm exponential decay length, (middle) uniform distribution throughout the volume, and (bottom) a depth profile resulting from adsorption of
222Rn at the surface of the clamps, with a subsequent implantation by the two alpha decays which follow in the238U decay chain. The full (red)curve is the result of a fit of Eq. (1) to the top spectrum, in the en- ergy range of the reference region from 40 to 90 keV. The extrapolation of this fit into the acceptance region below 40 keV is shown
wards low energies within the range of our acceptance re- gions. The simulated spectra for the uniform as well as the implantation profile are rather flat between 40 and 90 keV compared to the data in Fig.10. However, the energy spec- trum from the distribution peaking at the surface has a tail similar to that observed in the data. The curve in Fig.11is the result of a fit of Eq. (1) to this spectrum in the energy range of the reference region between 40 and 90 keV. Its ex-
ponential decay ofEdecayPb =13.6 keV agrees within errors with the value obtained from the fit of the data in Fig.10. Be- low 40 keV the curve in Fig.11shows the extrapolation of this function into the accepted energy range. The very good agreement of extrapolation and simulated data in the energy range of the acceptance region justifies the use of this type of extrapolation for our estimate of the Pb background.
For a rough first result, we take a typical energy range for the acceptance region of 12 to 40 keV and estimate the number of Pb recoils in it. From the extrapolation of the fit function in Fig.10 we calculate about 17 events of206Pb background in the acceptance region. Of course, this simple estimate neglects small differences in the overlap of the lead band with the acceptance region in different detector mod- ules, as well as the acceptance reduction in the reference re- gion due to partial overlap of lead and oxygen bands. Never- theless, the result is very close to the final value that we will obtain from the full likelihood analysis, which performs the background estimate module-wise and hence takes such dif- ferences into account.
5 Maximum likelihood analysis
In the previous section, the qualitative principles of our background estimates were discussed. This section explains how we formulate these concepts quantitatively. We choose the framework of a likelihood analysis to estimate the un- known parameters of our backgrounds and as well as the ones of a possible signal. This formalism also allows us to take into account and propagate the corresponding uncer- tainties. We first give a general overview of the formalism before focusing in detail on the treatment of the different backgrounds in the current measurement.
5.1 General concepts
The maximum likelihood fit is based on a parameterized model of the backgrounds and a possible signal. The param- eters are then varied to find the values for which the model most likely reproduces the data.
As we will see, this procedure allows one to take into account the actual position of the events in the light yield- energy plane, and not merely their presence in a broad acceptance region. Also, measurements from reference re- gions, outside the acceptance regions, may be introduced to help determine some of the parameters. Furthermore one may, in the framework of the method, give a quantitative es- timate of how well a best set of parameters is determined.
The maximum likelihood method itself however gives no direct indication of the quality of the resulting fit. To deal with this question, we shall attempt to give a characteriza- tion of the quality-of-fit using the so-calledp-value.
5.1.1 Likelihood function
The basic input to the analysis is a model for each sourceX that may contribute to our accepted events, be it background or a possible signal. Such a model describes the expected distribution of events in the(E, y)plane (whereEdenotes the recoil energy andythe light yield).
We formulate such a model in terms of a densityρX(E, y| pX) in the (E, y) plane. The number of events expected from sourceX in any subspace of the(E, y)plane is then simply given by the integral ofρXover this region.ρXde- pends on a set of unknown parameters summarized in the vector pX. These are the parameters to be varied.
In our case, each such density function is the product of two components: the expected recoil energy spectrum dNX/dE and a function that describes the expected event distribution in the light yield coordinate at each recoil en- ergyE.
As discussed above, we use a Gaussian distribution for the light yield, where the center of the distribution is given by the respective quenching factor and the width is essen- tially determined by the resolution of the light channel.
Since different detector modules have different resolu- tions, the densitiesρX need to be defined for each module individually. We therefore add an additional indexdfor “de- tector module” to each density. Assuming that we have con- sidered all significant sources of events, the total density for moduledis
ρd(E, y|p)=ργd+ραd+ρneutrond +ρPbd +ρdχ, (2) where we have taken into account the four backgrounds dis- cussed above, plus a possible WIMP signal “χ”. The vector p summarizes all the unknown parameters.
We now have observed a set of events in the acceptance region of each module, located at the positions(Ei, yi). The functionsρdcan be fitted to the event distribution in the re- spective module and, from this the most likely values of the unknown parameters can, in principle, be determined. The normalizations of theρ depend on the variable parameters and give the total number of expected eventsN via N(p):=
d
acc.region
ρd(E, y|p)dEdy
, (3)
where the integral runs over the acceptance region of mod- uledand thus yields the total expected number of accepted events in this module.
Theρdare thus no probability densities, but they can be used in the so-called extended maximum likelihood formal- ism [7] to formulate the likelihood function which then takes the form
Lacc(p)=
d
i
ρd(Ei, yi|p)
·exp
−N(p)
, (4)
with the outer product running over the detector modules and the inner one over all accepted events in the respective module. The exponential factor takes into account the nor- malization of theρd.
We emphasize that, in (4), we directly evaluateρdat the position of each observed event and no binning is involved.
By fitting the density functions to the observed event coordi- nates, one makes use of the full available information from the two-channel measurement. Using the experimental data, the fit then finds the most likely values of the parameters, including those for the backgrounds and a possible signal.
5.1.2 Reference regions
In practice, some of the unknown parameters in p are not sufficiently constrained by the observation in the acceptance region alone. In such cases, additional observations (“refer- ence measurements”) can be exploited which are made ei- ther in other regions of the measurement parameter space (for example in the α-reference region introduced in the previous section), or in completely different experiments or measurement channels. Each such reference measurement yields a separate likelihood function which constrains a sub- set pof p, and, assuming all measurements are independent, the total likelihood is simply given by the product
Ltot(p)=Lacc(p)·Lref1
p1
·Lref2
p2
· · · ·
reference measurements
. (5)
This concept can also be exploited in order to take into account the effects of uncertainties on otherwise fixed quan- tities, like e.g. the quenching factors of O, Ca and W, which enter the analysis and have been measured previously. To this end, these quantities are added to p as free parameters and, at the same time, an additional likelihood term is in- cluded for each of them which models the uncertainty of the quantity in question (e.g. a Gaussian around the best esti- mate, with the width given by the error on this estimate).
Finally, maximizing the total likelihood functionLtot(p) leads to estimates for all unknown parameters p. Most of the time, however, one is only interested in a subset of these values, the others just being nuisance parameters required to construct the likelihood. In our case, the only parameters of interest are the WIMP-nucleon cross sectionσWNand pos- sibly (if we find a clear signal) the WIMP massmχ. Our aim is to derive confidence intervals for these relevant quan- tities, taking into account the nuisance parameters and their uncertainties.
5.1.3 WIMP parameters
In a first step, we will thereby only concentrate on σWN
and ask whether our measurement indicatesσWN>0 sig- nificantly. All other parameters shall be summarized in the
vector p. This question corresponds to a test of the null- hypothesisσWN=0 with the model.
As a convenient test statistic, we employ the likelihood ratio
Λ(σWN=0):=Ltot(σWN=0,p)
Ltot(σˆWN,p) . (6) Here,σˆWNandpin the denominator are the maximum like- lihood estimators ofσWNand p, respectively, andpis the conditional maximum likelihood estimator under the condi- tion σWN=0. Λis hence a measure of how “signal-like”
our observation is, in the sense that small values indicate a considerably better description of the data with an allowed WIMP contribution than without.
According to Wilk’s theorem [8], if σWN=0 were the true assumption, then the quantity
q:= −2 lnΛ(σWN=0) (7) would have aχ2-probability distribution for one degree of freedom in the limit of large statistics. We have verified with a Monte Carlo simulation that this approximation holds well for the case of our analysis. This allows for a simple calcu- lation of the statistical significance S, with which we can reject the null hypothesisσWN=0 when having observed a certain valueqobs:
S=√
qobs. (8)
A higher value ofSobviously implies a smaller probability that a statistical fluctuation of the backgrounds may produce a data set as “signal-like” as the observed one, although there is no true signal present.
In a second step, ifσWN>0 can be established with suf- ficient significance, the above approach can be generalized andmχcan be treated as a second parameter of interest. The aim is then to calculate a confidence region in the(mχ, σWN) plane. Such confidence regions are given by the contours on which the likelihood has decreased by a certain factor δL with respect to the maximum, provided that all parameters other thanmχ andσWNare refitted in each point. The value of δL that yields the desired confidence level can thereby be obtained from aχ2-distribution for two degrees of free- dom. In fact, the same procedure can be applied to calculate confidence regions for any combination of n≥1 parame- ters, using theχ2-distribution forndegrees of freedom. The one-dimensional case is commonly known from its imple- mentation in the MINOS program of the MINUIT software package [9].
5.1.4 p-Value
As mentioned above, the significance resulting from the above likelihood ratio test is, in itself, not a good measure
of the quality of the fit to the data. High significances do not automatically imply a good agreement between the fit- ted model and the data, so that the quality-of-fit has to be determined in an independent step. One possibility of doing so is described in [10] and we adopt an analogous procedure here:
The(E, y)-plane (or a subspace of it) is divided into two- dimensional bins, separately for each detector module. In each bini, the expected numberei of events can be calcu- lated by integrating the densityρd. To go with this expec- tation, we have certain numbers of observed events in the bins. We can then determine the total probability of this ob- servation by assuming an independent Poisson process with expectationei in each biniand multiplying all correspond- ing Poisson probabilities.
Let our real observation have such a probabilityPobs. In- dependently, we can then generate artificial data sets where, in each bini, the generated number of events is Poisson dis- tributed with the expectationei. We employ a Markov Chain Monte Carlo for a fast generation of these data sets. Each generated setscan then again be characterized by a certain probabilityPs. From the distribution of the Ps, we finally determine the probability to get a data set with probability less or equal toPobs. This is called thep-value and can be used to describe the quality-of-fit.
Often, as in our case, the model used to generate the ar- tificial data sets is the result of a previous fit to the real ob- served data, where parameter values have been tuned for an optimal description of this observation. Thep-value as ob- tained above needs to be corrected for this bias and a pro- cedure of doing so is suggested in [10]. We perform this correction, but we note that its influence is naturally small when the number of free fit parameters is small compared to the number of bins considered.
Having now established the formal framework of our analysis, we will focus in the following on the concrete con- struction of the densities as well as the required reference measurements for each considered source of events.
5.2 e/γ-Background
The distribution of thee/γ-events in the(E, y)plane is ob- servable directly in the Dark Matter data set. Due to the large number of such events, statistical fluctuations are negligible and we use the observed distribution directly to fix the den- sitiesρdγ(E, y). The fit of the energy-dependent Gaussian width of thee/γ-band as outlined above thereby gives the parametrization of the light yield distribution of the events.
On the other hand, we use a histogram of the observed recoil energies (bin width 0.1 keV) as the expected energy spec- trum and interpolate it to arrive at a continuous function.
In the energy range of interest, the statistical uncertainties of the bin contents of this histograms are below 10−2. The