Deutsche Geodätische Kommission der Bayerischen Akademie der Wissenschaften
Reihe C Dissertationen Heft Nr. 773
Thomas Fuhrmann
Surface Displacements from Fusion of Geodetic Measurement Techniques Applied to the Upper Rhine Graben Area
München 2016
Verlag der Bayerischen Akademie der Wissenschaften in Kommission beim Verlag C. H. Beck
ISSN 0065-5325 ISBN 978-3-7696-5185-0
Diese Arbeit ist gleichzeitig veröffentlicht in:
Online-Plattform KITopen der Bibliothek des Karlsruher Instituts für Technologie - KIT (http://dx.doi.org/10.5445/IR/1000056073): DOI(KIT): 10.5445/IR/1000056073,
URN: urn:nbn:de:swb:90-560733, KITopen ID: 1000056073)
Deutsche Geodätische Kommission der Bayerischen Akademie der Wissenschaften
Reihe C Dissertationen Heft Nr. 773
Surface Displacements from Fusion of Geodetic Measurement Techniques Applied to the Upper Rhine Graben Area
Inaugural dissertation
for the fulfilment of the requirements for the academic degree of Doctor of Engineering (Dr.-Ing.)
accepted by
the Department of Civil Engineering, Geo and Environmental Sciences of the Karlsruhe Institute of Technology (KIT)
submitted by
Dipl.-Ing. Thomas Fuhrmann
from Oberderdingen, Baden-Württemberg, Germany
München 2016
Verlag der Bayerischen Akademie der Wissenschaften in Kommission bei der C.H.Beck'schen Verlagsbuchhandlung München
ISSN 0065-5325 ISBN 978-3-7696-5185-0
Diese Arbeit ist gleichzeitig veröffentlicht in:
Online-Plattform KITopen der Bibliothek des Karlsruher Instituts für Technologie - KIT
(http://dx.doi.org/10.5445/IR/1000056073): DOI(KIT): 10.5445/IR/1000056073, URN: urn:nbn:de:swb:90-560733, KITopen ID:
1000056073)
Deutsche Geodätische Kommission
Alfons-Goppel-Straße 11 ! D – 80539 München
Telefon +49 – 89 – 230311113 ! Telefax +49 – 89 – 23031-1283/-1100 e-mail post@dgk.badw.de ! http://www.dgk.badw.de
Main referee: Prof. Dr.-Ing. Dr. h.c. Bernhard Heck, Karlsruhe Institute of Technology, Karlsruhe, Germany Co-referees: Prof. Dr.-Ing. Stefan Hinz, Karlsruhe Institute of Technology Karlsruhe, Germany
Prof. Dr. ir. Ramon Hanssen, Delft University of Technology, Delft, The Netherlands Further members of the doctoral committee:
Prof. Dr. Philipp Blum, Karlsruhe Institute of Technology Karlsruhe, Germany
Prof. Dr. rer. nat. Martin Breunig, Karlsruhe Institute of Technology Karlsruhe, Germany Prof. Dr. rer. nat. Nico Goldscheider, Karlsruhe Institute of Technology Karlsruhe, Germany Prof. Dr.-Ing. Maria Hennes, Karlsruhe Institute of Technology Karlsruhe, Germany PD Dr.-Ing. Boris Jutzi, Karlsruhe Institute of Technology Karlsruhe, Germany
Prof. Dr. rer. nat. Frank Schilling, Karlsruhe Institute of Technology Karlsruhe, Germany Day of examination: 12.04.2016
Diese Dissertation ist auf dem Server der Deutschen Geodätischen Kommission unter <http://dgk.badw.de/>
sowie auf dem Server des Karlsruher Instituts für Technologie unter
<http://digbib.ubka.uni-karlsruhe.de/volltexte/1000045959> elektronisch publiziert
© 2016 Deutsche Geodätische Kommission, München
Alle Rechte vorbehalten. Ohne Genehmigung der Herausgeber ist es auch nicht gestattet,
die Veröffentlichung oder Teile daraus auf photomechanischem Wege (Photokopie, Mikrokopie) zu vervielfältigen
ISSN 0065-5325 ISBN 978-3-7696-5185-0
“Zwischen all den Sternen schaut ein Satellit auf mich, ich kann ihn zwar nicht sehn, doch sieht er alles, glaube ich.”
(“Between all those stars, a satellite looks down on me, I cannot see it, but it sees everything, I guess.”)
from “Satellitenbild (satellite image)”,
The Wohlstandskinder, German rock band (1995–2005)
Artist view on Karlsruhe and the Upper Rhine Graben, assembled by C. Fuhrmann,
image source: Google Earth, ESAv
Abstract
Detailed information on the present-day intraplate deformation of the Upper Rhine Graben (URG) is of interest for both researchers and decision makers. The URG is part of the Eu- ropean Cenozoic Rift System and carrying a significant probability for strong earthquakes.
Furthermore, anthropogenic activities such as mining, groundwater usage and geothermal energy production may affect the deformation of the complex fault system. Within this work, surface displacements in the URG area bounded by the Rhenish Massif in the north and the Alps in the south are detected with geodetic measurement techniques. The three consid- ered techniques use (i) terrestrial measurements from precise levelling, (ii) satellite signals received at ground-based GNSS
1antennas and (iii) spaceborne radar data acquired by SAR
2satellites.
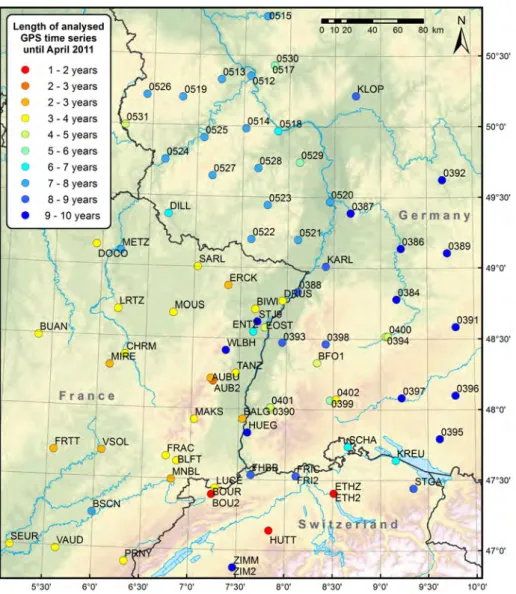
Levelling data measured in several campaigns between 1867 and 2012 provides detailed in- sight into the vertical displacements of the investigation area. A least-squares adjustment of a large database of levelling measurements from Germany, France and Switzerland yields vertical displacement rates at 14,098 levelling benchmarks with a mean standard deviation (1σ) of 0.18 mm/a. GNSS signals observed by a network of permanently operating sites are analysed to estimate 3D coordinates. Horizontal and vertical displacement rates are derived from the coordinate time series between 2002 and 2011 at 85 GNSS sites in the URG area.
Resulting standard deviations (2σ) of horizontal and vertical site velocities are 0.4 mm/a and 1.3 mm/a, respectively. SAR data acquired by the ERS
3and Envisat
4missions provide surface displacements along the slant line of sight towards the satellites in two time intervals, 1992–
2000 and 2002–2010, respectively. A combination of displacement time series of both time intervals results in mean standard deviations (2σ) of displacement rates of 0.6 mm/a. The SAR data available at one descending and two ascending tracks covering the whole URG area are analysed, resulting in slant displacement components with different looking directions.
The results of the single-technique analyses provide useful information on the current defor- mation behaviour of the investigation area. The levelling results reveal uplift tendencies in the Black Forest and in parts of the Vosges Mountains and the Palatinate Forest w.r.t. subsidence in most parts of the URG. Horizontal velocities at GNSS sites evidence a relative southward motion of the Rhenish massif w.r.t. a northward motion of the Alps resulting in sinistral shear- ing at the URG. InSAR
5is most suitable to investigate the temporal and spatial behaviour of surface displacements related to anthropogenic activities in the URG area. In order to exploit the advantages of the three techniques w.r.t. accuracy, sensitivity to different displacement components and spatial as well as temporal resolution, a new approach for the fusion of dis- placements from levelling, GNSS and InSAR is presented. The resulting map of 3D surface displacement rates resolves the neotectonic movements in the URG area with unprecedented spatial resolution and accuracy. With mean standard deviations of 0.4 and 0.2 mm/a for the horizontal and vertical velocities, respectively, the combined velocity solution is particularly able to resolve the relative movements of the graben interior. The 3D velocity field contributes to an improved understanding of intraplate deformation processes and strain accumulation
1
GNSS: Global Navigation Satellite Systems such as the Global Positioning System (GPS)
2
SAR: Synthetic Aperture Radar
3
ERS: European Remote Sensing Satellites
4
Envisat: Environmental Satellite
5
InSAR: Interferometric SAR
in the URG. In addition, the temporal and spatial behaviour of surface displacements related
to anthropogenic activities is resolved at several places, providing a fundamental basis for
interpretation and discussion, for researchers as well as for decision makers.
vii
Zusammenfassung
Detaillierte Informationen zum heutigen Deformationszustand des Oberrheingrabens (ORG) und seiner Umgebung sind von großem Interesse für Wissenschaftler und Entscheidungsträ- ger. Der ORG ist der prominenteste Teil eines mitteleuropäischen Riftsystems, das Europa vom Mittelmeer bis zur Nordsee durchquert. Die tektonisch interessante Grabenstruktur ist in den letzten Jahrzehnten von moderater seismischer Aktivität geprägt. Allerdings gibt es eine signifikante Wahrscheinlichkeit für starke Erdbeben bis zur Magnitude M
W= 7. Außer- dem kommt es durch die intensive Nutzung des Untergrunds im Oberrheingrabengebiet in den letzten Jahrzehnten verstärkt zu größeren, anthropogenen Deformationen, die im Zusam- menhang mit Erdölförderung, Bergbau, Grundwasserentnahme oder Geothermie stehen. In der vorliegenden Arbeit werden Oberflächenbewegungen im Gebiet des ORG zwischen dem Rheinischen Schiefergebirge im Norden und den Alpen im Süden aus drei geodätischen Ver- fahren abgeleitet. Die drei Verfahren verwenden (1) terrestrische Messungen mittels Präzi- sionsnivellement, (2) Satellitensignale, die an GNSS
1-Antennen auf der Erde empfangen wer- den und (3) satellitengestützte Radardaten, die von SAR
2-Satelliten aufgezeichnet werden.
Die Nivellementdaten im Bereich der trinationalen Oberrheingrabenregion wurden von den zuständigen Landesvermessungsbehörden aus Deutschland, Frankreich und der Schweiz in mehreren Kampagnen gemessen. Als Datenbasis stehen Nivellementmessungen aus den Jahren 1867 bis 2012 zur Verfügung. Aus Messdaten an mehrfach beobachteten Nivelle- mentpunkten können vertikale Verschiebungen der Erdoberfläche berechnet werden. Dazu werden die gemessenen Höhenunterschiede an den Nivellementpunkten mit einem kinema- tischen Modell nach der Methode der kleinsten Quadrate ausgeglichen. Aus mehr als 40.000 Beobachtungen können vertikale Verschiebungsraten an mehr als 14.000 Nivellementpunkten im gesamten Oberrheingrabengebiet abgeleitet werden. Mit einer mittleren Standardabwei- chung von unter 0,2 mm/a (1σ) lassen sich aus den Verschiebungsraten Rückschlüsse über die rezente Geodynamik des ORG ziehen. Die Nivellementsergebnisse zeigen unter anderem eine relative Absenkung des Grabeninneren bezüglich der Grabenschultern (Schwarzwald, Teile der Vogesen und des Pfälzer Walds) von 0,5–0,8 mm/a. Zusätzlich zu mittleren, linearen Verschiebungsraten kann das zeitliche Bewegungsverhalten entlang einzelner Nivellementlin- ien untersucht werden, beispielsweise an den Hauptrandverwerfungen des Grabens oder in Gebieten mit anthropogenen Aktivitäten.
Aus GNSS-Daten können 3D-Koordinaten mit einer Genauigkeit von wenigen mm bis cm abgeleitet werden. Im Gebiet des ORG kann auf ein Netz aus permanenten GNSS-Stationen zurückgegriffen werden, die von unterschiedlichen öffentlichen oder privaten Institutionen aus Deutschland, Frankreich und der Schweiz betrieben werden. Die Datenbasis umfasst GNSS-Beobachtungen von mehr als 80 Stationen und startet im Jahr 2002. In einer differen- ziellen Auswertung der zur Verfügung stehenden Daten werden zunächst tägliche Koordi- natenlösungen für Ost-, Nord- und Vertikalkomponente berechnet. Die Koordinatenzeitrei- hen über den kompletten ausgewerteten Zeitraum zwischen 2002 und 2011 liefern schließlich Verschiebungsraten für jede Komponente. Die 2σ-Standardabweichungen der resultierenden Raten an 85 permanenten Stationen liegen im Mittel bei 0,4 mm/a für die horizontalen Kom- ponenten und bei 1,3 mm/a für die vertikale Komponente. An einigen Stationen (10 %) reicht
1
GNSS: Global Navigation Satellite Systems wie z. B. das Global Positioning System (GPS)
2
SAR: Synthetic Aperture Radar
die Länge der ausgewerteten Zeitreihe derzeit nicht aus, um die kleinen tektonischen Bewe- gungen des ORG signifikant nachzuweisen. Die horizontalen Geschwindigkeiten an 76 Statio- nen zeigen jedoch ein plausibles Bewegungsmuster und machen die großräumige tektonische Deformation des ORG sichtbar. Der ORG ist eingespannt zwischen SSO-gerichteten Bewegun- gen des Rheinischen Schiefergebirges und NNO-gerichteten Bewegungen im Alpenvorland, was zu erhöhten Strainraten insbesondere im südlichen Bereich des Grabens führt.
Mittels SAR-Interferometrie (InSAR) lassen sich Oberflächenbewegungen entlang der Sicht- linie zu einem SAR-Satelliten in der Größenordnung weniger mm nachweisen. Im Bereich des ORG wurden SAR-Daten der ESA
1-Satelliten ERS
2und Envisat
3ausgewertet. Die Daten decken einen Zeitraum von 1992–2000 beziehungsweise 2002–2010 ab und sind entlang von ca. 300 km langen und 100 km breiten Streifen in aufsteigenden und absteigenden Satel- litenbahnen verfügbar. Im Rahmen dieser Arbeit werden Daten aus zwei aufsteigenden und einer absteigenden Bahn mit der Persistent-Scatterer-Methode ausgewertet. Das Ergeb- nis der Auswertungen eines SAR-Streifens sind eindimensionale Verschiebungen entlang der Sichtlinie zum Satelliten an Punkten mit gleichbleibenden Rückstreueigenschaften (Persistent Scatterer). In den Städten und Dörfern des Untersuchungsgebietes sind die Reflexionseigen- schaften der nutzbaren Punktstreuer über die ausgewerteten Zeiträume stabil. Hier wird eine hohe räumliche Auflösung für die Verschiebungen erzielt. Um die Genauigkeit der Ergebnisse zu steigern, werden die Verschiebungszeitreihen der beiden Datenzeiträume mathematisch kombiniert. Die mittleren 2σ-Standardabweichungen der resultierenden Verschiebungsraten liegen bei 0,6 mm/a. Insbesondere in Gebieten mit größeren (anthropogenen) Deformationen lässt sich die räumliche und zeitliche Entwicklung der Oberflächenbewegungen mit InSAR nachverfolgen. Für die großräumige Tektonik des ORG ist die erzielbare Genauigkeit nicht ausreichend, um Bewegungen im sub-mm/a-Bereich signifikant nachzuweisen. Insbesondere in Datenstapeln, die nur wenige SAR-Szenen enthalten, lassen sich atmosphärische Effekte dann nicht vollständig vom Deformationssignal trennen. Eine Fusion von InSAR mit Nivelle- ment und GNSS auf Basis der Verschiebungsraten soll es ermöglichen sowohl die langwelligen als auch die kurzwelligen Anteile des Deformationssignals aufzulösen.
Die Ergebnisse aus den Einzelauswertungen der drei Techniken liefern bereits ein bemerkens- wertes Gesamtbild der aktuellen Oberflächenbewegungen im Untersuchungsgebiet. Um die Vorteile der drei komplementären Messverfahren hinsichtlich ihrer Sensitivität für horizontale und vertikale Bewegungskomponenten, der räumlichen und zeitlichen Auflösung der Mes- sungen sowie ihrer Genauigkeit optimal auszunutzen, wird ein neuer Ansatz vorgestellt, der die Ergebnisse der Techniken gewinnbringend zu einem 3D-Geschwindigkeitsfeld fusioniert.
Dazu werden die resultierenden Verschiebungsraten der drei Techniken zunächst mittels Krig- ing auf ein gemeinsames Gitter interpoliert. In diesem Schritt werden die Verschiebungen der InSAR-Auswertungen von ERS- und Envisat-Daten auf Basis der Zeitreihen zu einer mittle- ren Verschiebungsrate über den Gesamtzeitraum kombiniert. Zur Datenfusion werden aus linearen Verschiebungsraten von Nivellement (vertikal), GNSS (horizontal) und InSAR (auf- steigende und absteigende Bahnen) 3D-Verschiebungsraten berechnet. Im Rahmen der Daten- fusion werden auch die unterschiedlichen Referenzrahmen der drei Techniken berücksichtigt.
Das resultierende 3D-Geschwindigkeitsfeld visualisiert die rezente Geodynamik des ORG in bisher unerreichter räumlicher Auflösung und Genauigkeit und trägt zu einem besseren Ver- ständnis der vorherrschenden Deformationsprozesse bei. Unter anderem zeigen die Ergeb- nisse, dass das Grabeninnere Bereiche mit unterschiedlichen Bewegungsmustern aufweist
1
ESA: European Space Agency
2
ERS: European Remote Sensing Satellites
3
Envisat: Environmental Satellite
ix wie z. B. eine relative Senkung im Bereich des Heidelberger Lochs gegenüber der Gegend um Karlsruhe in Verbindung mit einer linksdrehenden Rotationsbewegung in den horizontalen Bewegungskomponenten. Die Standardabweichungen von 0,38, 0,45 und 0,18 mm/a für Ost-, Nord-, bzw. Vertikalkomponente belegen die hohe Qualität des Kombinationsansatzes und der ausgewerteten Daten.
Oberflächenbewegungen im Zusammenhang mit anthropogenen Aktivitäten konnten an ver-
schiedenen Stellen im Untersuchungsgebiet nachgewiesen werden, insbesondere im Bereich
des ehemaligen Kohleabbaus im Saarland und in Lothringen, im ehemaligen Kalisalzabbauge-
biet Wittelsheim bei Mulhouse und im Bereich der Erdölfelder Landau. Letzteres liefert die
Möglichkeit, die drei Verfahren gegenseitig zu validieren, da Messdaten aller drei Techniken
in hoher zeitlicher Auflösung vorliegen und sowohl Senkungen als auch Hebungen im Be-
reich von bis zu 7 mm/a signifikant nachweisbar sind. Die durchgeführten Untersuchungen
zu Oberflächenbewegungen im gesamten Oberrheingrabengebiet bilden eine gute Basis, um
die künftige Nutzung des Untergrunds wissenschaftlich und strategisch zu diskutieren. Die
kontinuierliche Erfassung von GNSS-Daten an den permanenten Stationen im ORG und an-
grenzenden Gebieten sowie die Fortführung der SAR-Datenbasis mit den Starts der beiden
Sentinel-1-Satelliten ermöglichen zukünftige Untersuchungen zu Oberflächenbewegungen im
ORG unter Verwendung einer zeitlich längeren Datenbasis. Die in dieser Arbeit entwickelten
Auswerte- und Kombinationsansätze können dabei direkt auf künftige Studien und andere
Untersuchungsgebiete übertragen werden.
Contents
Abstract v
1 Introduction 1
1.1 Motivation and Background . . . . 1
1.2 Problem statement . . . . 3
1.3 Outline . . . . 4
2 The Upper Rhine Graben (URG) 7 2.1 Geological overview of Europe . . . . 8
2.2 Evolution of the URG . . . . 11
2.3 Recent Tectonics of the URG area . . . . 13
2.3.1 Geomorphology . . . . 13
2.3.2 Geology . . . . 13
2.3.3 Faulting mechanisms . . . . 15
2.3.4 Stress field . . . . 16
2.3.5 Seismicity . . . . 17
2.3.6 Surface displacements from previous geodetic studies . . . . 18
2.4 Natural resources and their exploitation . . . . 21
2.5 Summary . . . . 24
3 Geodetic Measurement Techniques 25 3.1 Levelling . . . . 26
3.1.1 Methodology . . . . 26
3.1.2 Database . . . . 30
3.1.3 Analysis strategies . . . . 34
3.2 GNSS . . . . 39
3.2.1 Methodology . . . . 39
3.2.2 Database . . . . 42
3.2.3 Analysis strategies . . . . 45
3.3 InSAR . . . . 47
3.3.1 Methodology . . . . 47
3.3.2 Database . . . . 50
3.3.3 Analysis strategies . . . . 53
3.4 Summary . . . . 58
4 Levelling Analysis 59 4.1 Kinematic adjustment of simulated data . . . . 60
4.2 Data preparation . . . . 63
4.2.1 Quality check . . . . 63
4.2.2 Systematic effects at line 638 . . . . 65
4.2.3 Clearing up on repeatedly measured benchmarks . . . . 69
4.2.4 Modelling of non-linear displacements . . . . 71
4.3 Influence of gravity . . . . 73
4.4 Stochastic model . . . . 78
4.4.1 Modelling of random and systematic errors . . . . 78
4.4.2 Variance component estimation . . . . 80
Contents xi
4.5 Resulting surface displacements . . . . 84
4.5.1 Data set for the kinematic adjustment . . . . 84
4.5.2 Selection of the reference point . . . . 85
4.5.3 Outlier handling . . . . 87
4.5.4 Discussion of final results . . . . 88
4.6 Static comparisons along levelling lines . . . . 92
4.6.1 Levelling lines close to Freiburg . . . . 92
4.6.2 Levelling lines close to Landau . . . . 94
4.7 Summary . . . . 96
5 GNSS Analysis 97 5.1 Differential GNSS analysis . . . . 98
5.2 Displacement estimation from differential coordinate estimates . . . 100
5.2.1 GPS coordinate time series . . . 100
5.2.2 Euler pole estimation . . . 102
5.2.3 Time series analysis using CATS . . . 103
5.3 Resulting surface displacements . . . 106
5.3.1 Horizontal surface displacements . . . 107
5.3.2 Vertical surface displacements . . . 109
5.3.3 Calculation of tectonic strain . . . 111
5.3.4 GPS time series analysis for the 2004 Waldkirch earthquake . . . 113
5.4 Summary . . . 115
6 InSAR Analysis 117 6.1 Data preparation . . . 118
6.1.1 Selection of a master image . . . 118
6.1.2 Interferogram formation . . . 122
6.2 Persistent Scatterer analysis . . . 125
6.2.1 Selection of Persistent Scatterers . . . 125
6.2.2 Weeding . . . 126
6.2.3 Phase unwrapping and parameter estimation . . . 127
6.2.4 Envisat oscillator drift . . . 129
6.3 Atmospheric influences and corrections . . . 131
6.3.1 Phase correction using MERIS data . . . 131
6.3.2 Phase correction using weather model data . . . 132
6.3.3 Spatial phase filtering using the power-law method . . . 133
6.3.4 Spatio-temporal filtering of the phase . . . 133
6.3.5 Comparison of results . . . 135
6.4 Small Baseline Subset analysis . . . 137
6.4.1 Interferogram selection . . . 137
6.4.2 Comparison to single master approach . . . 138
6.5 Resulting surface displacements . . . 140
6.5.1 Frequency distribution of phase values . . . 140
6.5.2 Quality estimation . . . 141
6.5.3 Side lobes . . . 146
6.5.4 LOS displacement rates in the URG area . . . 149
6.5.5 Deformation pattern close to Landau . . . 150
6.6 Summary . . . 153
7 Fusion of Techniques 155
7.1 Characteristics of the techniques . . . 156
7.2 Theoretical considerations based on simulated displacements . . . 158
7.3 Interpolation of scattered data using Kriging . . . 162
7.3.1 The Kriging system . . . 162
7.3.2 Covariance modelling using semivariograms . . . 164
7.4 Fusion of surface displacements . . . 166
7.4.1 Covariance models for the spatial interpolation . . . 168
7.4.2 Interpolation of levelling, GNSS and InSAR data . . . 171
7.4.3 Stitching of overlapping SAR image stacks . . . 173
7.4.4 Combination of ERS and Envisat time series . . . 174
7.4.5 Reference frame integration . . . 179
7.4.6 Mathematical data fusion . . . 182
7.5 3D velocity field of the URG . . . 184
7.5.1 Discussion of final results . . . 185
7.5.2 Geoscientific interpretation of the velocity field . . . 187
7.6 Summary . . . 191
8 Conclusions and Outlook 193 8.1 Summary and Contributions . . . 193
8.2 Recommendations . . . 196
8.3 Outlook . . . 197
Appendix
A Levelling Analysis 199
B GNSS Analysis 209
C InSAR Analysis 216
D Fusion of Techniques 225
Bibliography 229
Acronyms and Symbols 247
Acknowledgements 251
1
Chapter 1 Introduction
The first chapter of the thesis is dedicated to introduce the background of the performed in- vestigations and put the work into a broader context (Sect. 1.1). Sect. 1.2 presents the research objectives and addresses some major questions to be handled within the thesis. The outline of the thesis is given in Sect. 1.3, considering different groups of readers.
1.1 Motivation and Background
Every two years, the organisation Naturefriends International elects a transnational and eco- logically valuable European region as Landscape of the year (NFI, 2015). It is a happy coinci- dence that at present the Upper Rhine Valley is the latest designated landscape of the year (for the years 2013/2014), right at the moment while the major results of this work have been achieved. Nonetheless, from a scientific point of view, the widely used term Upper Rhine Valley is not correct as valleys are washed out by a river by definition (Röhr, 2014). However, the river Rhine developed about 15 Ma ago (Böhme et al., 2012) and thus may not be responsible for the subsidence of the Earth’s crust at the Upper Rhine Graben (URG), which already started about 45 Ma ago (Rouchy, 1997, p. 82). By definition, a graben is a piece of crust which is sunk w.r.t. its surroundings along parallel striking faults (Murawski & Meyer, 2010, p. 65 f.). A graben may exist on the cm- as well as on the km-scale, with the URG standing out as a rather large specimen. The highly interesting URG system has been studied by many scientists, but is not yet fully understood in various respects.
If one would ask people living in or close to the URG whether they have ever felt an earth- quake, many of them would deny it, at least most of the younger people. However, strong earthquakes happen with a certain frequency in the URG area. The strongest and most dev- astating event known today is constrained to a moment magnitude M
Wof 6.7 to 7.1 and happened in 1356 close to the city of Basel (Fäh et al., 2009). In 1728 a M
W= 5.3 event was registered close to Mahlberg, between Freiburg and Strasbourg (Meidow, 1998). The largest earthquakes in recent years occurred 2003 close to Rambervillers in the Vosges Mountains with M
W= 4.8 (Grünthal & Wahlström, 2012) and 2004 close to Waldkirch, northeast of Freiburg, with M
W= 4.6 (Häge & Joswig, 2009). Events with smaller magnitudes occur much more frequently. It is worth having a look at the daily updated catalogue of the Seismological Service conducted by the Federal State Office for Geology, Natural Resources and Mining of Baden-Württemberg (LGRB, 2015). Epicentres of instrumentally measurable earthquakes lo- cated in the URG area appear every few days in the catalogue. Despite all the progress that has been made, the scientific community cannot unambiguously assess how frequently strong earthquakes may occur in the URG area and how likely the occurrence of an earthquake like the Basel 1356 event is. Hence, it is important to better understand the current tectonic setting of the URG – not least, because the region is highly populated and economically important.
The aim of this work is to contribute to the knowledge of the present-day tectonics of the URG area by quantifying the deformation from a geodetic point of view. In addition, anthropogenic activities in the subsurface are supposed to affect the deformation behaviour of the region.
The URG has been intensively exploited in the past decades by coal, potash and oil mining,
groundwater usage and for geothermal energy production. The influence of these activities on the surface are unknown in most cases. For scientific monitoring and public acceptance of future subsurface activities in the URG area, detailed knowledge of the spatial and temporal behaviour of surface displacements is essential for both geoengineers and decision makers.
Within this work, all available geodetic data suitable for the measurement of surface displace- ments in the URG area is collected, evaluated and analysed. Fortunately, there is a lot of data available in the region, measured with levelling, GNSS
1and SAR
2satellites. On the other hand, it is lengthy and hard work to analyse the large amount of data, along with the de- velopment of new strategies in order to achieve the best possible results. The thesis will also provide insights into the characteristics of the three techniques levelling, GNSS and SAR inter- ferometry (InSAR). Focussing on the estimation of surface displacements, the major challenges concerning a suitable and up-to-date analysis of the available database will be given for each technique.
It is an honourable task to analyse data which was measured more than 100 years ago. Geode- sists used to wear a suit and top hat for the field work at that time. Except for the clothing, the execution of levelling measurements has not significantly changed, since the first levelling line used within this work was measured in 1867. Furthermore, it is amazing that the accuracy of the old measurements is almost at the same level as it is today. In general, deep respect is due to the hundreds of surveyors who organised and carried out the measurements resulting in the database available for the geodynamic studies presented within this work – a real treasury of data. Thereby, the discrepancies of measured height differences along close levelling loops over hundreds of km are on a scale of several mm only. This corresponds to observing from one goal line of a football pitch to the other, whether a fine dust particle ( < 10 µm) lies on a football or not.
One of the most crucial advances of modern geodesy is the availability of GNSS, enabling world-wide 3D positioning at the mm- to cm-scale. Furthermore, positioning and navigation with low-cost GNSS receivers has rapidly become part of our everyday life in the last years.
For geodetic tasks, high-tech antennas are used to receive and process the GNSS signals, emitted from satellites at about 20,000 km distance. Analysing the GNSS signals of several satellites over some hours along with a sophisticated consideration of error sources, such as the atmospheric delay, the position on Earth may be determined with an accuracy of a few mm. This is like distinguishing the location of two adjacent fine dust particles at Strasbourg Cathedral from the tower of the Karlsruhe Castle.
“Between all those stars, a satellite looks down on me” (a line of the song “satellite image”) sounds like a poetic description of a SAR satellite. In fact, the SAR satellites carry sensors which actively “look” down on Earth and receive the reflected signal. However, their “eyes”
are exceptionally sharp, taking into account that only a small fraction of the transmitted signal is received back at the satellite. It is even more astonishing that surface displacements in the range of several mm can be observed with SAR satellites orbiting our planet at an altitude of 500 to 800 km with a speed of approximately 25,000 km/h. This is like observing the movement of a football at the fine-dust-particle-scale from the goal line of the opposite side of the football pitch – while continuously moving.
1
GNSS: Global Navigation Satellite Systems
2
SAR: Synthetic Aperture Radar
1.2 Problem statement 3
1.2 Problem statement
The research objective of this work is to provide a complete picture of recent surface displace- ments in the whole URG area at a spatial extent of about 300 km × 200 km in N–S and E–W direction, respectively. Thereby, both large-scale tectonic deformation and local displacements at faults or related to man-made activities are of interest. The following questions shall be addressed within the thesis:
• Is it possible to measure the small tectonic deformation in the URG area with the avail- able geodetic data sets?
From geological estimates, e. g. from thickness distribution of Quaternary deposits or from outcrops at faults, the tectonic deformation of the URG is supposed to be well below 1 mm/a. Hence the question arises, whether it is possible to measure these small displacements with significance at all. The determination of a displacement is strongly related to the length of the total period covered by the data. It is thus important to cover the largest possible period with each of the techniques. Furthermore, a focus should be set on the best analysis strategies for each technique.
• How can the single-technique analyses of levelling, GNSS and InSAR be enhanced in order to derive the best possible accuracy for the displacement estimates?
For each technique, the resulting displacements shall be at the best possible accuracy level. Therefore, (i) the database of each technique is evaluated w.r.t. quality and usabil- ity and (ii) the processing strategy is evaluated and adapted w.r.t. the technique-specific error sources. Note that the displacements resulting from all three techniques are rela- tive quantities and hence also the resulting precision estimates depend on the introduced reference frame. Separated for each technique the following issues have to be consid- ered.
Levelling:
- assessment of the usability of levelling data from the 19th century,
- calculation of loop misclosures and detection of strong systematic effects, - application of gravity corrections,
- appropriate weighting of the observations using variance component estimation.
GNSS:
- coordinate time series analysis incorporating the consideration of periodic effects and jumps,
- selection of usable GNSS sites w.r.t. the length of the time series and the noise level, - proper subtraction of the major trend of the Eurasian plate.
InSAR:
- selection of appropriate master and slave images for the InSAR stack processing, - reduction of atmospheric effects by filtering methods or additional meteorological
data,
- selection of high quality pixels using appropriate quality measures,
- combination of displacement data from different SAR sensors at the level of time
series.
• Is it possible to combine surface displacements from levelling, GNSS and InSAR in a reasonable and gainful way?
The properties of the three techniques are different in many aspects, such as temporal and spatial resolution, location and distribution of the measurement points, accuracy and datum definition. A major difference is that levelling can only provide information on vertical displacements, GNSS on horizontal as well as vertical displacements and In- SAR on displacements along a slant line of sight towards the side-looking SAR satellite.
One may ask in particular whether a combined displacement field benefits from the advantages of each technique and thus provides useful information on the present-day deformation of the URG area or not. Furthermore, it would be desirable if the devel- oped combination approach was also applicable to other regions and for new satellite missions, such as Sentinel-1.
• How do the results affect the current knowledge of the complex graben system?
Both the single-technique results and a combined 3D displacement solution shall be dis- cussed w.r.t. the current knowledge of the tectonics of the URG and its surroundings.
Hence, the findings of previously published geoscientific investigations on the URG have to be summarised and discussed, including previous geodetic studies. It will be inter- esting to see whether the geodetically derived surface displacements are in accordance or discordance with general concepts of tectonic deformation of the URG from geology and geophysics. In this context, the reader should keep in mind that the displacements observed at the surface with geodetic techniques are a superposition of all effects acting in the subsurface such as tectonic deformation, sedimentation and anthropogenic effects.
• At which locations may the observed surface displacements be related to anthropogenic activities?
The natural resources of the URG area are exploited at several locations in the investi- gation area. A compilation of all past and current man-made subsurface activities with best knowledge and conscience will give an overview of the areas potentially affected by anthropogenic deformation. Areas with conspicuous surface displacements w.r.t. the magnitude of displacements and the temporal and spatial behaviour can be investigated in detail by one or more techniques. Especially InSAR is well suited to trace the spatio- temporal behaviour of surface displacements related to local anthropogenic activities.
However, the combined surface displacement solution is dedicated to tectonic deforma- tion, and hence should suppress non-tectonic features at the best possible rate.
1.3 Outline
This work is supposed to be of interest for readers with different backgrounds like geodesy, radar remote sensing, geology, geophysics or geodynamics. Within this section, the outline of the thesis is presented, designating the group of readers for whom the corresponding chapters are of special interest.
Chap. 2 is intended to give a comprehensive overview of the investigation area. The evolu-
tion of the URG as well as the current knowledge of the tectonic setting of the region are
presented including previous geodetic studies. The chapter enlightens the URG from differ-
ent perspectives and is hence dedicated to incorporate the whole geoscientific community.
1.3 Outline 5 Sect. 2.4 gives an overview on known anthropogenic activities in the tri-national URG area and may furthermore be of some value for decision makers.
Chap. 3 could as well be denoted Material and Methods as it introduces the reader to the gen- eral concepts for the analysis of the geodetic databases of levelling, GNSS and SAR data. It has a repeating structure for the three techniques and subsequently presents: (i) the general methodology of each technique, (ii) the available database in the URG area and (iii) the strate- gies to derive surface displacements from the techniques. Without going into too much detail, this chapter may be particularly useful for non-geodesists in order to understand the principal features of each technique.
Chap. 4–6 describe in detail the single-technique analyses of levelling, GNSS and SAR data in the URG area. People with a background in classical geodesy are probably more interested in the specific mathematical and statistical investigations performed with the levelling and GNSS database (Chap. 4 and 5). Radar scientists may find useful information on the processing and evaluation of ERS and Envisat data in Chap. 6. However, the resulting surface displacements obtained with the three techniques are highly valuable for the whole geoscientific community dealing with the URG area. Major results are found in Sect. 4.5.4 and 4.6 for the levelling part, Sect. 5.3.1 and 5.3.3 for the GNSS part, and in Sect. 6.5.4 and 6.5.5 for InSAR.
Chap. 7 presents the developed approach to combine surface displacements from levelling, GNSS and InSAR to a high-resolution 3D velocity field. The chapter also contains theoret- ical and practical aspects on spatial interpolation using the geostatistical Kriging technique.
The presented approach for the fusion of different SAR sensors based on displacement time series is particularly relevant for the InSAR community. The finally resulting combined 3D displacement rates for the URG area are presented and discussed in Sect. 7.5.
Chap. 2–7 are terminated by a brief summary section, which lists the key points of the content
discussed within the whole chapter. Finally, Chap. 8 gives an overall conclusion of the whole
thesis. Furthermore, open questions and future works are briefly discussed.
7
Chapter 2
The Upper Rhine Graben (URG)
The study area of all investigations performed in this thesis is the URG area located in the tri-national region of Germany, France and Switzerland. More than six million people live at the Upper Rhine area consisting of the national regions Südpfalz, Baden, Alsace and North- western Switzerland. For the year 2010, the German-French-Swiss conference of the Upper Rhine (GFSC, 2012) calculated a population density of 279 inhabitants per km
2, which is higher than the mean population densities of Germany, France, Switzerland or whole Europe, although also the mountain regions surrounding the URG have been included in the statisti- cal assessment. The URG comprises large cities and industrial areas listed in Tab. 2.1 mainly contributing to the economic development of the region.
Table 2.1: Population of large cities in the URG area listed from north to south.
City Inhabitants Inhabitants per km
2Inhab. of the agglomeration
Mannheim 296,690
a2,047
a1,148,497
dKarlsruhe 299,103
a1,724
a509,452
dStrasbourg 272,222
b3,478
b488,552
dFreiburg 220,286
a1,439
a364,283
dBasel 174,974
c7,333
c739,228
da
Source: Statistisches Bundesamt (2014), status: 2013-12-31
b
Source: Insee (2015), status: 2011-12-31
c
Source: Statistisches Amt (2015), status: 2015-05-31
d
Source: Brinkhoff (2015)
Besides the methodological items concerning the analysis and combination of geodetic data
w.r.t. the determination of surface displacements, the main goal of the thesis is to provide
significant displacement results for the geoscientific community working on topics relevant
to the URG. The quantification and qualification of surface displacements is an important
factor for decision makers dealing with current and future projects in the URG area such as
earthquake-resistant construction standards, groundwater usage, oil extraction or geothermal
power generation. This chapter aims to introduce the URG area to the reader. Sect. 2.1 in-
tegrates the region into the geological context of Europe, whereas Sect. 2.2 focusses on the
evolution of the graben structure itself. Sect. 2.3 gives an overview of the recent tectonics of
the URG from previous geological, geophysical and geodetic studies. As the natural resources
of the URG area are increasingly exploited in the last decades revealing clearly visible defor-
mation features in the analysed geodetic data, this topic is discussed in an extra section at the
end of this chapter (Sect. 2.4).
2.1 Geological overview of Europe
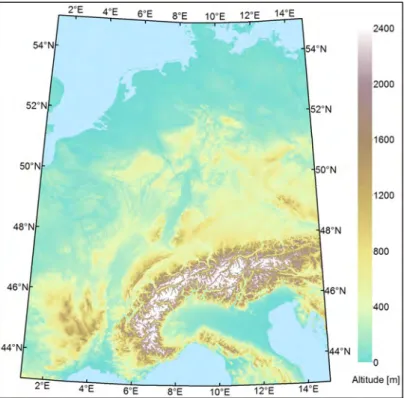
The URG is the most prominent segment of a continental Cenozoic rift system in Central Eu- rope (Ziegler, 1992). In a topographic view of Central Europe, the graben structure bounded by the Vosges Mountains (VG) in the west and the Black Forest (BF) in the east is clearly vis- ible, see Fig. 2.1. The term Cenozoic is used for the era 66 Ma ago until present (Cohen et al., 2013) and therefore covers a quite young period in geological time scales. If the age of the Earth of 4.54 billion years corresponds to one day, the Cenozoic era would only cover the last 21 minutes. In order to integrate the evolution of the URG into a broader context, a geological overview of Europe is given within this section.
Figure 2.1: Topographic map of Central Europe generated from elevation data of the Shuttle Radar Topography Mission (SRTM). The URG is located north of the Alps at approximately 8
◦E and between 47
◦30’ and 50
◦N. Spatial reference: Universal Transverse Mercator (UTM) coordinate system, zone 32N.
The evolution of our planet Earth as we know it today is largely influenced by the phe- nomenon of plate tectonics. At the beginning of the 20th century, A. Wegener tried to prove a concept of rigid continental plates which are slowly drifting away from each other (Wegener, 1929). He supported the concept of continental drift by geological, paleontological, biological and climatological observations. T. J. Wilson expanded the theory of sliding plates which de- struct and create crustal material, when he discovered transform faults and established what is known today as the Wilson cycle (Wilson, 1963, 1965). He postulated a multiple tectonic cycle of about 300 Ma length describing aggregation and dispersal of continental crust (Murawski
& Meyer, 2010, p. 188):
1. Continental rifting )
Divergent boundary 2. Ocean-floor-spreading
3. Subduction )
Convergent boundary
4. Collision-type orogeny
2.1 Geological overview of Europe 9 In this way, the Earth’s continents and oceans evolved to what we have today. The earliest con- tinental crust existing in Europe are Precambrian
1terranes in Fennoscandia and the Ukraine which can be traced back to 3.5–3.2 Ga (Bogdanova et al., 2008). Further Precambrian rocks are present on the British Isles, on the Iberian Peninsula and in Southern Italy. The crystalline basement rocks of Central and Western Europe were mainly built in the Cadomian orogen (650–550 Ma ago, Plant et al., 2005). A presently prominent mountain building in Northern Europe, i. e. Scotland, Ireland, Scandinavia, is part of the Caledonian orogen, occuring be- tween Late Cambrian and Earliest Devonian (490–390 Ma ago, Plant et al., 2005; Frisch et al., 2011, p. 161 f.). The crystalline basements of the VG and the BF were built in the Variscan oro- gen (370–280 Ma ago, also called Hercynian orogen, Eisbacher & Fielitz, 2010, p. 16 ff.). The Variscan mountains cross Central Europe in E–W direction and are subdivided into different zones (von Raumer et al., 2003), most parts of the Upper Rhine massifs (VG, BF) belonging to the Moldanubian zone (Frisch et al., 2011, p. 163 ff.). The terranes of Europe are summarised in a map by Oczlon (2006) providing a view on the growth of the Earth over billions of years.
Fig. 2.2(a) displays a crop of the terrane map for Central Europe including a description for terranes relevant to the URG area. Fig. 2.2(b) shows the distribution of the Variscan basement in Central Europe. The granitic and metamorphic rocks of the Moldanubian zone can be traced from Spain over the Massif Central, VG and BF to the Bohemian Massif.
(a) Growth of Europe’s lithosphere documented in the Ter- rane Map of Europe, modified from Oczlon (2006).
(b) Geological map of Variscan basement areas, modified from von Raumer et al. (2003).
Figure 2.2: Crops of geological maps for Central Europe, VG: Vosges mountains, BF: Black Forest, MC:
Massif Central, BM: Bohemian Massif.
1
see stratigraphy table published by Cohen et al. (2013) for chronology and age of geological eras
The evolution of the Alps started in Cretaceous and mainly affects the present tectonics of Central Europe. Bonnet et al. (2007) subdivides the Alpine mountain building into three main orogenic phases: Eoalpine (140–60 Ma), Mesoalpine (60–30 Ma) and Neoalpine (30–0 Ma) events, while the main mountain building processes took place during the younger phases.
As typical for an Alpine style orogeny, the foreland of the mountain front is filled up with the debris of the ascending mountains building a Molasse basin (Frisch et al., 2011, p. 149 ff.).
Since the Paleocene (60 Ma ago), the axis of maximum compressive stress north of the alps has changed from NNE–SSW to NW–SE (Ahorner, 1975) pushing the Molasse basin and the Jura Mountains towards NW and still affecting the present-day horizontal deformation of the URG. During late Eocene (35 Ma ago), the N directed compressional stresses originating in the Alpine and Pyrenean collision zones created the European Cenozoic rift system (Dèzes et al., 2004). Fig. 2.3 displays the locations of the individual grabens belonging to the European rift system w.r.t. the Alps. The URG is the most prominent segment of the rift system and is discussed in the following section.
Figure 2.3: Location of the European Cenozoic rift system and oblique opening of Rhine and Bresse
graben from Schlunegger & Mosar (2011). In addition to the URG, the Lower Rhine Graben
(LRG) and the Bresse Graben (BG) are shown in Fig. 2.1.
2.2 Evolution of the URG 11
2.2 Evolution of the URG
The URG is part of an intracontintental rift zone. According to Milanovsky (1972), rift zones may be classified into three categories:
(a) oceanic rift zones: axial graben bordered by oceanic crust on both sides, e. g. mid ocean ridges,
(b) intracontinental rift zones: rift floor and shoulders are of continental crust, e. g. URG, (c) intercontinental rift zones: oceancic rift floor bordered by continental crust on both sides,
e. g. Red Sea.
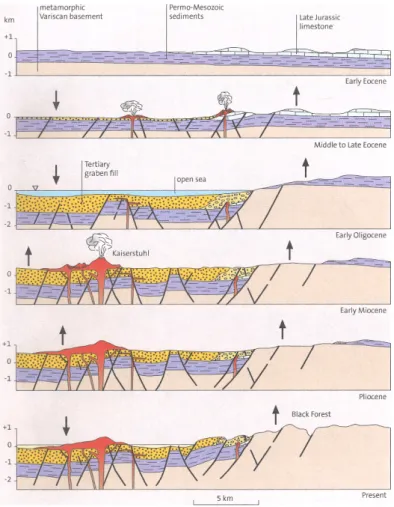
The formation of the URG started in Eocene and is visualised in Fig. 2.4. At the end of Eocene, a vertical displacement between the graben basin and its shoulders of more than 1000 m existed. During Oligocene (30 Ma ago), the graben surface was situated below sea level allowing for marine ingression. The Upper Rhine developed into a channel connecting the Alpine Molasse zone with the North Sea Basin (Schumacher, 2002), and might have looked similar to the Red Sea today. In Early Miocene (20 Ma ago), the Kaiserstuhl volcano was formed in the southern part of the URG where the crust is thinnest and large faults exist (Frisch et al., 2011, p. 34). Being interrupted between Late Miocene and Early Pliocene (5 Ma ago), sedimentation restarted resulting in a total thickness of sediments in the graben of more than 3 km in the northern part (Doebl & Olbrecht, 1974).
Figure 2.4: Cross sections showing the evolution of the URG, from Frisch et al. (2011, p. 32).
Quaternary deposits are concentrated at the so called Heidelberger Loch (northern URG, 350 m
thick) and at the Geiswasser basin (southern URG, 200 m thick), see Buchmann & Connolly
(2007). For the Heidelberger Loch, Pflug (1982, p. 42 f.) derives an average subsidence rate
of 0.1–0.2 mm/a from the thickness of Quaternary deposits. Peters & van Balen (2007a)
investigate Pleistocene terraces in the northern URG in order to better constrain the recent
tectonic activity. From dating of terraces, they derive vertical displacement rates between 0.01
and 0.08 mm/a, which is well below the rates in the adjacent Rhenish Massif (0.1–0.3 mm/a
uplift, van Balen et al., 2000) and in the Heidelberger Loch (Pflug, 1982).
2.3 Recent Tectonics of the URG area 13
2.3 Recent Tectonics of the URG area
This section describes the recent tectonics of the URG area from different points of view. It presents the currently available findings and conclusions related to geomorphology, geology, the faulting mechanism, seismicity and surface displacements of the URG. The evolution and neotectonics of the URG have been intensively studied within the EUCOR
1-URGENT
2project, see Behrmann et al. (2005). This multi-disciplinary research and training programme lasting from 1999 to 2009 aimed at a better understanding of the seismic hazard, neotectonics and evolution of the URG and surrounding areas. Some of the cited publications in this section are based on the investigations carried out within the EUCOR-URGENT framework.
2.3.1 Geomorphology
As the most prominent segment of the European Cenozoic rift system, see Fig. 2.3, the shape of the URG is nicely visible in the landscape. The graben has a length of more than 300 km, a fairly constant width of approximately 36 km (Frisch et al., 2011, p. 31) and appears as vast lowland plain in the landscape. It is bounded by the VG in the west, by the BF in the east, by the Jura Mountains and the Alps in the southeast and by the Rhenish Massif in the northwest.
The average height above sea level in the graben interior varies between 85 m in the northern part (river Rhine at Mainz) and 250 m in the southern part (river Rhine at Basel), with an anomaly at the Kaiserstuhl volcano which has a maximum height of 557 m above sea level.
The graben shoulders reach maximum heights of 1424 m (Grand Ballon, VG) and 1493 m (Feldberg, BF) in the west and east, respectively. In the northern part, the graben is bounded by the Palatinate Forest (Pfälzer Wald) in the west and the Kraichgau and the Odenwald in the east, but with significantly lower heights of the graben shoulders (below 673 m).
2.3.2 Geology
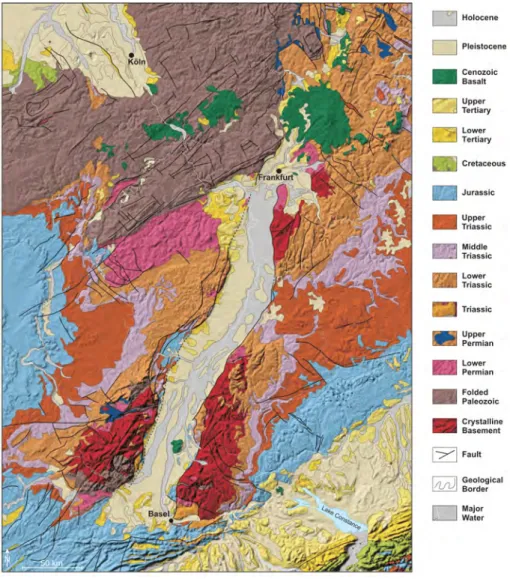
The geological layers existing in the URG are strongly correlated with the evolution of the graben system as presented in Sect. 2.2. Fig. 2.5 shows the major geological units present at the surface. The oldest rocks are found in the BF and the VG, mainly granites and gneisses, belonging to the Variscan basement, see Sect. 2.1 and Fig. 2.2(b). The geological layers on both sides of the URG are found in symmetrical sequence forming the Southwest German and the Lorraine cuesta landscape (Lower Triassic, Middle Triassic, Upper Triassic, Jurassic). In the east, the Swabian Jura forms the backbone of the Southwest German cuesta landscape and is of special interest from a tectonic and seismic point of view (Geyer et al., 2011, p. 19 and p. 446). In the northwest, Paleozoic rocks of the Rhenish Massif bound the URG as discussed by Murawski et al. (1983). South of the Rhenish Massif, Permian rocks of the Saar-Nahe Basin and the Tertiary Mainz Basin form the boundary of the URG.
The graben itself is filled with sediments of different thickness and distribution, particularly along the NNW–SSE axis of the graben. Subsidence and sedimentation started in the southern URG and developed further north within Tertiary (Pflug, 1982, p. 7). Sedimentation was interrupted in late Miocene in the whole URG, but restarted in Pliocene and is still going on.
The thickness of Quaternary sediments in the graben reaches up to 350 m at the Heidelberger Loch. The spatial distribution of Quaternary deposits is shown in a map by Bartz (1974), also given in Buchmann & Connolly (2007). Vertical profiles of the different deposit layers and their distribution within the graben are shown in several publications (Roll, 1979; Pflug,
1
EUCOR: EUropean COnfederation of Upper Rhine universities
2
URGENT: Upper Rhine Graben: Evolution and NeoTectonics
Figure 2.5: Geological map of the URG area, modified from Röhr (2014).
1982; Geyer et al., 2011; Frisch et al., 2011). Doebl & Olbrecht (1974) present a map of the Tertiary base in the graben and observe a maximum thickness of 3,335 m close to Frankenthal (northern URG, Germany). Roll (1979, p. 72) estimates the deposit volume of the graben shoulders to more than 27,000 km
3and the total volume of sediments within the graben to nearly 19,000 km
3. This is about 400 times the volume of water in the Lake Constance (48 km
3, IKGB (2013)). It is important to keep in mind that the total subsidence measured at the surface is caused by a superposition of tectonic subsidence and sedimentary load, see Eisbacher (1996, p. 249 ff.). Following Eisbacher & Fielitz (2010, p. 74), the mass of the sediments in the graben is responsible for more than half of the total subsidence of the graben interior.
Regarding the deeper subsurface, Ziegler & Dèzes (2006) presented a map showing the depth
of the Moho discontinuity for Western and Central Europe and adjacent oceanic domains
derived from a compilation of already published regional Moho maps. It becomes obvious
that the URG area is located in a zone with relatively low Moho depths. In the southern URG,
the Moho depth is found at only 24 km, see also Illies (1977), whereas it increases to 58 km
below the Alps. The regional uplift of the crust-mantle boundary extends up to 75 km east and
west of the graben boundaries (Prodehl et al., 1992). According to Eisbacher & Fielitz (2010,
p. 15), the crust in the URG area is exposed to expansion and thinning since approximately
40 Ma.
2.3 Recent Tectonics of the URG area 15 2.3.3 Faulting mechanisms
The URG comprises many faults, capable of both strike-slip and normal faulting. Schumacher (2002) characterises the contemporary URG as a strike-slip system with two pull-apart basins in the northern and southern part, separated by a restraining bend in the central part. Illies (1977) observes local grabens and horsts in the southern URG segment, compression and thus uplift and erosion in the central segment, and active normal faulting and thus subsidence in the northern segment. This setting has partly been confirmed by analyses of levelling data carried out by Zippelt & Mälzer (1987). In general, the URG is stuck between southward movements of the Rhenish Massif and northward movements of the Alps resulting in a sinis- tral shear at the main border faults along with extension.
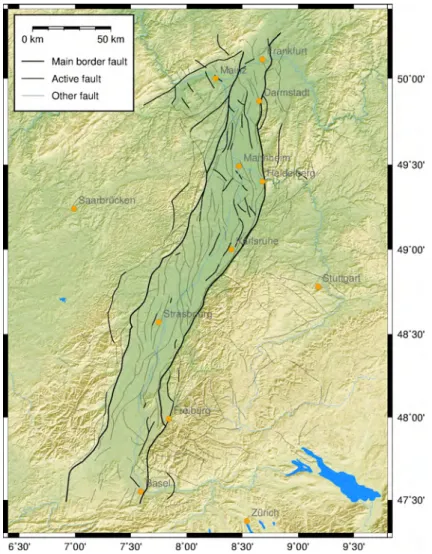
Insights into the current fault setting are based on the interpretation of seismic sections, col- lected on behalf of hydrocarbon exploration in the 1960s and 1970s and on geological mapping of the surface, particularly at the URG shoulder areas (Lemeille et al., 1999; Peters & van Balen, 2007b). The orientation of intra-graben faults and faults at the shoulder areas is mainly NNE, see Fig. 2.6. Some faults, particularly in the northern URG, strike in NW directions matching Variscan fault trends (Peters, 2007, p. 13, 17). As one can see in Fig. 2.6, many of the big cities in the URG are close to active faults potentially capable of strong earthquakes.
Figure 2.6: Relevant faults in the URG area. Fault data from Peters (2007, p. 166), background: shaded
DEM using SRTM-3 data.
2.3.4 Stress field
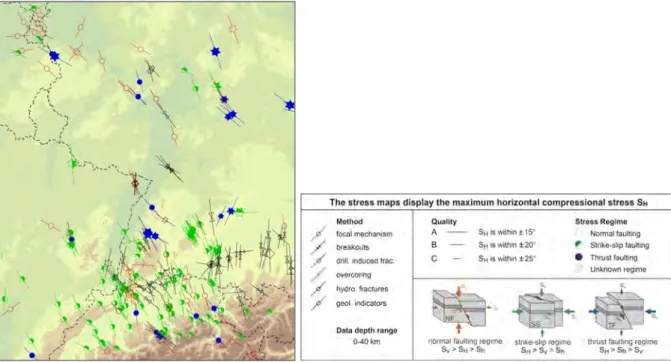
Schumacher (2002) gives an overview of the stress field in the URG area within different geological epochs. The ambient stress field largely changed during different epochs of the graben evolution. He distinguishes between six consecutive intervals of basin subsidence that are related to changes in the stress field and displays isopach maps including the inherent stress field for Priabonian, Lower Rupelian, Upper Rupelian, Chattian, Early Miocene and Quaternary. The stress field was derived by paleostress analyses (Villemin & Bergerat, 1987) for the early periods and by in-situ measurements (Baumann, 1981) and focal plane solutions (Ahorner et al., 1983) for the Quaternary period. Most stress axes given for the Quaternary period in the URG area are NW–SE orientated, predominantly along with a strike-slip regime, see also Fig. 2.7. In principle, the stress orientation of present-day tectonics can be derived from (i) focal mechanisms of earthquakes, (ii) well bore breakouts and drilling-induced frac- tures, (iii) in-situ stress measurements (overcoring and hydraulic fracturing) and (iv) geologic indicators (young geologic data from fault-slip analysis and volcanic vent alignments), see Heidbach et al. (2008); Eisbacher (1996, p. 91 ff.).
Fig. 2.7 shows the recent maximum horizontal stress directions in the URG and adjacent areas.
Most of the information on the stress field is derived from focal mechanisms of earthquakes.
A general NW–SE trend of the maximum horizontal compressional stress is observed in the area. However, the information on the present-day stress field of the URG area is sparsely distributed, particularly in the central and northern part of the graben. Ritter et al. (2009) analyse seismic waveforms of three minor earthquake events (M
L= 2.4, 1.5 and 2.8) close to Speyer and Heidelberg (central/northern URG) and conclude that normal faulting across the whole crustal depth dominates in this part of the URG. However, efforts to determine fault plane solutions from small earthquakes have to be extended in order to better constrain the regional stress field.
Figure 2.7: Crop of the world stress map 2008 (Heidbach et al., 2008) for the URG area. Maximum
horizontal compressional stress derived from different methods.
2.3 Recent Tectonics of the URG area 17 2.3.5 Seismicity
The Cenozoic rift system is a seismically active region within Central Europe (Ziegler, 1992).
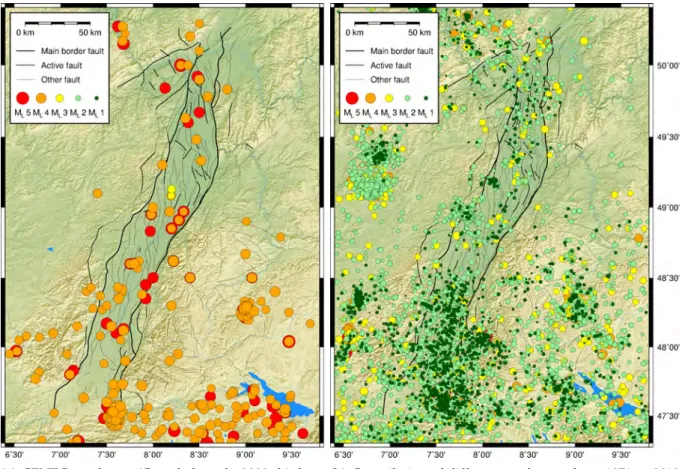
The URG as the most prominent part of the rift system is characterised by low to moderate earthquake activity, documented e. g. by Ahorner et al. (1983); Bonjer (1997). Together with the Lower Rhine Graben, the URG area is among the most seismically active regions in West- ern Europe, north of the Alps (Grünthal et al., 2009a,b; Leydecker, 2011). Fig. 2.8 shows the distribution and magnitude of earthquakes in the URG area since 1000 AD. The historical cat- alogue of earthquake events given in Grünthal et al. (2009b) is visualised for events until 1970 mainly based on macroseismic estimations of epicentre locations and intensity. In addition, Barth et al. (2015) compiled the data of different catalogues after 1970 for the URG area, see Fig. 2.8(b). It becomes obvious that large earthquakes are concentrated in the URG and its shoulder areas and in the Alpine foreland. Only few seismic events have been recorded in the northern URG in the last decades, whereas the southern URG is exposed to a large number of small events (Barth & Ritter, 2010; Barth et al., 2015). Within the graben, focal depths vary typically between 5 and 15 km, increasing in the BF to values between 15 and 23 km (Plene- fisch & Bonjer, 1997). Significantly less seismic activity is found in the shoulder areas north of the BF and the VG.
(a) CENEC catalogue (Grünthal et al., 2009a,b) from 1000 AD to 1970, mainly from macroseismic esti- mations.
(b) Compilation of different catalogues from 1971 to 2012 published by Barth et al. (2015), mainly from instru- mental records.
Figure 2.8: Seismicity in the URG area: earthquake epicentre registrations from different catalogues.
The largest reported earthquake in the URG was the Basel event in 1356 with a moment magnitude M
Wbetween 6.7 and 7.1 (Fäh et al., 2009). With intensities up to VIII on EMS
1within a 30 km radius around the epicentre at 47.47
◦N, 6.70
◦E, it is the most destructive earthquake known in Central Europe. Mayer-Rosa & Cadiot (1979) estimate the maximum intensity equal or greater IX on MSK
2and deduce a focal depth between 10 and 20 km.
Meghraoui et al. (2001) investigate an active normal fault in the epicentral area close to Basel, which might be responsible for the Basel event in 1356. From paleoseimic records (trench measurements), they identify two additional earthquake events within the last 8500 years and estimate a mean uplift rate of 0.21 mm/a at the fault. The most recent earthquake related to the URG with a local magnitude M
Labove 5.0 was recorded in Waldkirch (close to Freiburg) in 2004. The event is located at 48.08
◦N, 8.04
◦E (Brüstle & Stange, 2005), east of the eastern border fault, and showing predominantly strike-slip character (Häge & Joswig, 2009).
2.3.6 Surface displacements from previous geodetic studies
Major results from previous geodetic studies in the URG area are discussed within this section.
Levelling data has been systematically analysed w.r.t. geodynamics in the URG area since the 1960s until today. Several investigations have been performed within the past decades on a re- gional and local scale, particularly using levelling data from the German and Swiss parts of the URG. Between 1967 and the 1980s, electronic distance measurements (EDM) have been used to get insights into the horizontal motion across the URG, later also in combination with GPS data. In the southern URG, old French triangulation data has also been used together with GPS campaign measurements in order to evaluate the horizontal deformation of the URG.
Recently, the focus is put on GNSS data acquired at permanent sites or from campaigns.
Regarding vertical displacements, Mälzer (1967) and Mälzer et al. (1983, 1988) published maps of height changes in the URG area and the Rhenish Massif. They used repeated precise lev- elling data on first-order lines of the German and Swiss surveying authorities and found sev- eral indications for active tectonic deformation, but presented also examples for man-induced subsidence related to the extraction of oil and groundwater. Kuntz et al. (1975) presented measurements from several geodetic techniques, among others, levelling profiles in the Offen- burg and Freiburg region. Zippelt & Mälzer (1987) published maps of height changes from available levelling data in the German part of the URG area using the kinematic adjustment model provided by Zippelt (1988) and described in Sect. 3.1.3. Most of the detected vertical rates are within ± 1 mm/a, along with uplift of up to 0.7 mm/a in the Palatinate Forest, west of the graben, and subsidence of 0.7 mm/a in the northern part of the graben and east of it. They conclude that the principal deformation feature within the URG (subsidence in the northern part, uplift in the central segment, subsidence in the southern part) is in accordance with the present-day graben mechanism as published by Illies (1979). In the French part of the URG, Ermery (1960) compared the heights of levellings carried out on behalf of the Prussian kingdom at the end of the 19th century (Prussia, 1883, 1894) with the French principal level- ling in Alsace-Lorraine, mainly measured between 1920 and 1924. The resulting map of height changes between these two measurement epochs already confirms that vertical displacement rates in the URG are small ( < 1 mm/a), except from some movements up to 2 mm/a close to the mining area of Lorraine, see Sect. 2.4. A comparison of height changes between different measurement epochs at levelling lines in the southern URG was carried out by Schweizer (1992). The author concludes that there is mostly subsidence within the graben w.r.t. a slight uplift of the levelling benchmarks in the BF. Demoulin et al. (1998) performed a local study of
1
EMS: European Macroseismic Scale
2