Dr. Marcus Dengler Meteor Reise M130
M130, Mindelo – Recife
August 28th to October 3rd, 2016 3nd Weekly Report, September 11th, 2016
Today, our activities have focused on recovering and redeploying a mooring at 5°N, 23°W. A second mooring at 11°N, 21°W was recovered and redeployed on Thursday.
Both moorings are equipped with instrumentation recording time series of currents, hydrography and oxygen concentration. Other works accomplished this week include the survey of a tracer in the eastern tropical Atlantic that was released in the center of the oxygen minimum zone more than 3 years ago and comprehensive measurements along the 23°W section.
Time series of dissolved oxygen
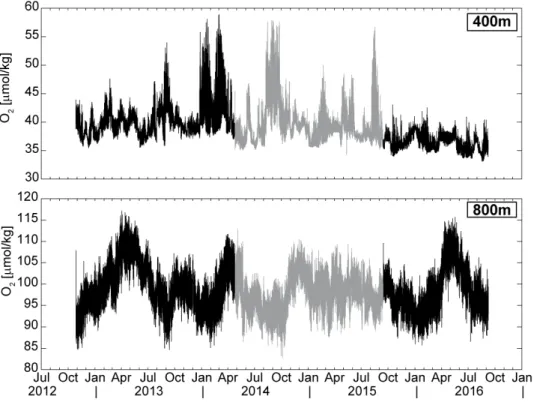
Both moorings serviced this week are an integral component of the SFB 754 related observing system in the eastern tropical north Atlantic. Since 2009, time series of oxygen concentration, velocity and hydrography have been obtained from the mooring at the southern rim of the oxygen minimum zone at 5°N, 23°W. The mooring from the center of the oxygen minimum zone has delivered the same time series data since 2012 (Fig. 1). The time series that are collected in the depth interval between 100m and 800m are used to quantify oxygen, hydrographic and current variability within the oxygen minimum zone and associated lateral oxygen fluxes with a particular focus on the role of mesoscale processes.
Fig. 1: Time series of oxygen concentration from the centre of the oxygen minimum zone (11°N, 21°W) from 400m (upper) und 800m (lower) depth. Black lines indicate the first (left) and the just recovered third (right) mooring period. The grey line indicates oxygen concentrations measured during the second deployment period. (Plot by Johannes Hahn)
Dr. Marcus Dengler Meteor Reise M130
The 4-year time series of oxygen content from the center of the oxygen minimum zone from 400m depth shows the oxygen decrease over the past four years that is not apparent in the time series from 800m (Fig. 1). Instead, the data from 800m show pronounced seasonal variability of oxygen concentration during most years. The physical processes responsible for the seasonal variability are currently subject of investigation.
OSTRE tracer survey
To quantify the strength of lateral and vertical mixing processes within the oxygen minimum zone, an artificial tracer was released in the center of the oxygen minimum zone at 11°N, 21°S in December 2012. During this Oxygen Supply Tracer Release Experiment (OSTRE) the tracer was injected at a density of 27.03 kg m-3, corresponding to a depth of about 400m. The lateral and vertical distribution of the tracer patch was subsequently surveyed during the previous expeditions M97, M105 and M116 by sampling high-resolution station grids.
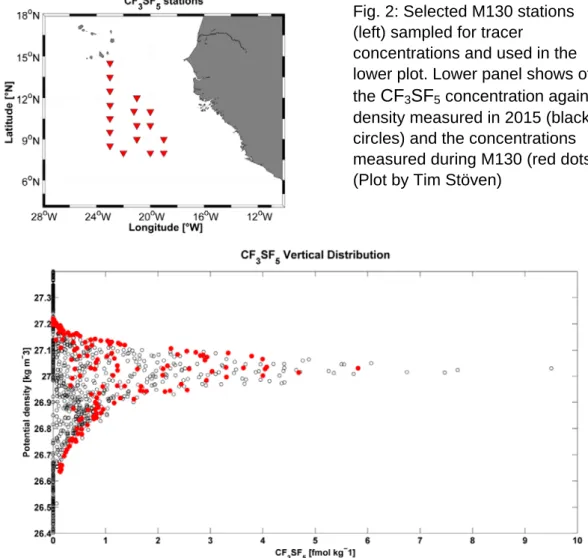
During our cruise, the tracer was sampled on a reduced station grid. The measurements showed that the lateral spreading of the tracer has now extended from the Cape Verde islands (15°N) to as far as 5°N. Comparing the sampled vertical distribution to the vertical distribution from earlier cruises, the tracer had again spread to different lower as well as higher density classes (Fig. 2, lower panel). The data will be used to improve the estimate of vertical mixing from the tracer diffusion.
Fig. 2: Selected M130 stations (left) sampled for tracer
concentrations and used in the lower plot. Lower panel shows of the CF3SF5 concentration against density measured in 2015 (black circles) and the concentrations measured during M130 (red dots).
(Plot by Tim Stöven)
Dr. Marcus Dengler Meteor Reise M130
Impact of zooplankton on biogeochemical cycles
One major focus of this cruise is investigating the role of zooplankton – millimeter sized animals that drift in the ocean – for the biogeochemical cycles of the oxygen minimum zone. Amongst other instruments, we use an underwater vision profiler mounted to the CTD rosette that can be lowered to 6000m depth. During the decent of the profiler, high-definition pictures are taken at a sampling rate of 10 Hz which are then used to quantify the abundance of zooplankton. Recent results using this method have shown that single-celled zooplankton – so called Rhizarier – are much more abundant than previously assumed. These organisms are very fragile. Thus, plankton nets hauls cannot be used to quantitatively assess the biomass of these animals.
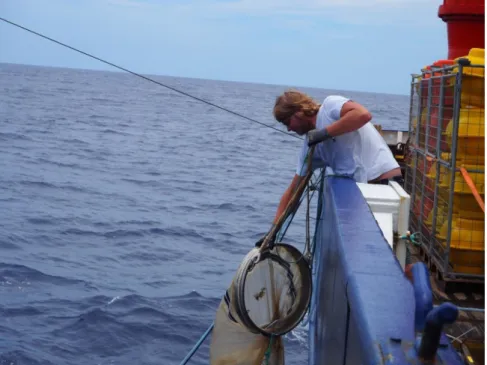
Information about other characteristics of the Rhizarier such as respiration rates, are very scares. Thus, we use drift nets to catch to avoid damaging them as far as possible. After some difficulties at the beginning, strategies have now been found to catch sufficient organisms for the investigation of respiration, size and biomass. In combination with the pictures from the UVP, our investigations will advance understanding of the role of these organisms in the ocean.
During the coming week we will complete the measurement program along the 23°W section. On Thursday, we will service our mooring on the equator.
Best regards from the tropical north Atlantic,
Marcus Dengler and the participants of M130
Fig. 3: Jannik Faustmann retrieving a drift net (Photo:
Rainer Kiko)