SIBIS IST–2000-26276 Statistical Indicators Benchmarking the Information Society
Internet for R&D
By Franz Barjak and Najib Harabi
December 2003
This publication has been prepared by Franz Barjak and Najib Harabi (project leader) University of Applied Sciences Solothurn North-Western Switzerland in the context of the IST-26276-SIBIS project (“SIBIS Statistical Indicators Benchmarking the Information Society”) in co-operation with the other partners in the project.
All publications of the SIBIS project – including this report – are available in electronic format on the internet at:
www.sibis-eu.org
Neither the European Commission nor any person acting on behalf of the Commission is responsible for the use which might be made of the following information. The views expressed are those of the authors and do not necessarily reflect those of the European Commission. Nothing in this report implies or expresses a warranty of any kind. Results from this report should only be used as guidelines as part of an overall strategy.
For further information, contact:
empirica GmbH Oxfordstr. 2 D-53111 Bonn
E-mail: sibis@empirica.com
A great deal of additional information on the European Union is available on the Internet. It can be accessed though the Europa server: http://europa.eu.int
© SIBIS project and European Communities, 2003
Reproduction is authorised provided the source is acknowledged.
Printed in Germany.
Table of Contents
Abbreviations ... 5
Preface ... 6
Executive Summary... 8
1 Introduction ... 12
2 Identification of the indicator framework ... 16
2.1 Overview ... 16
2.2 Readiness for computerised science ... 18
2.2.1 Infrastructure... 18
2.2.2 Attitude towards Internet applications and Internet skills ... 20
2.3 Use of the Internet in science ... 20
2.3.1 Information and publishing via the Internet... 21
2.3.2 Social communication via the Internet... 22
2.3.3 Use of collaboration applications... 24
2.4 Impact of the Internet on science ... 25
2.4.1 Output of research and development ... 25
2.4.2 R&D collaborations ... 27
2.5 Operationalisation and data collection... 29
2.5.1 Survey of Internet issues in research and development ... 30
2.5.2 Secondary data... 33
3 Analysis of currently available data ... 35
3.1 Readiness for computerised science ... 35
3.1.1 Research networks ... 35
3.1.2 Computer equipment ... 40
3.1.3 Electronic information sources... 42
3.1.4 Awareness of Internet potential ... 44
3.1.5 Computer and Internet skills ... 45
3.1.6 Summary on readiness... 50
3.2 Use of Internet applications in science ... 51
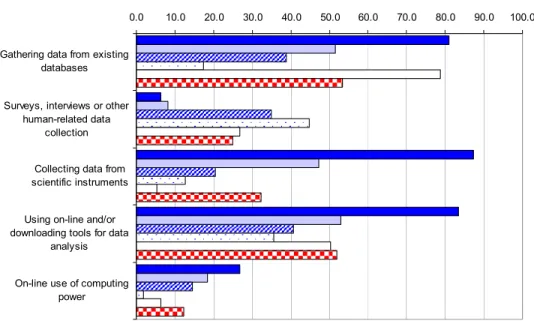
3.2.1 On-line data collection and analysis ... 51
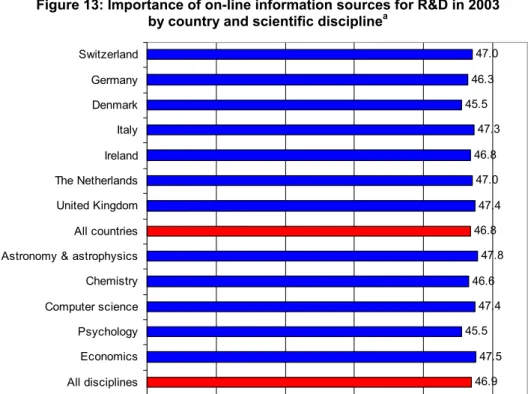
3.2.2 On-line information sources... 53
3.2.3 Scientists’ web presentations and e-publishing... 55
3.2.4 Computer-mediated social communication in science ... 58
3.2.5 Collaboration applications... 59
3.2.6 Summary on using Internet applications in science ... 61
3.3 Indicators for the impact of the Internet on science... 62
3.3.1 Scientific publications ... 62
3.3.2 Citations to scientific publications ... 66
3.3.3 Patents... 67
3.3.4 R&D collaboration ... 70
3.3.5 Summary... 80
3.4 Summary... 81
4 Further developments... 83
5 Conclusions ... 85
6 Bibliography ... 87
7 Annex ... 92
7.1 Data Annex ... 92
7.2 Estimate tables ... 124
7.3 Methodological annex... 129
7.4 Questionnaire of the SIBIS R&D survey... 134
Abbreviations
. No data available A Austria B Belgium cf. Compare
CH Confederatio Helvetica (Switzerland)
CMC Computer-Mediated Communication
D Deutschland (Germany)
DK Denmark
E España (Spain)
EC European Commission
EL Greece
ELS Electronic Library Services ERA European Research Area
EU European Union
F France
FHSO Fachhochschule Solothurn Nordwestschweiz
(University of Applied Sciences Solothurn Northwestern Switzerland) FIN Finland
FTP File Transfer Protocol GDP Gross Domestic Product HTTP Hyper Text Transfer
Protocol I Italy ICT or IT Information and
Communication Technology IRL Ireland
IST Information Society Technologies
L Luxembourg LAN Local Area Network MAN Metropolitan Area Network Med. Median
MSTI Main Science and Technology Indicators
NL The Netherlands
NRN National Research Network OECD Organisation for Economic
Cooperation and Development P Portugal
PPP Purchasing Power Parity R&D Research and Development
RN Research Network
S Sweden
SCI Science Citation Index SSCI Social Science Citation
Index
SIBIS Statistical Indicators for Benchmarking the
Information Society SMTP Simple Mail Transfer
Protocol
TCR Total Congestion Ratio TERENA Trans-European Research
and Education Networking Association
UK United Kingdom
USA United States of America WWW World Wide Web
Foreword
For some years now statistical indicators on Information Society have been central in the policy making process. This has been best demonstrated through the benchmarking exercise of eEurope 2002 Action Plan, and its further inclusion as a key activity in eEurope 2005. Having recognised this need and driven by the difficulties in obtaining reliable and appropriate statistics, the IST programme supported a pan- European research effort during Framework Programme 5. The prime objective has been to develop and make available methodologies, tools and new statistical indicators which can help remedy the deficit in this field.
It is in this context that the SIBIS project was launched (IST-26276, “Statistical Indicators Benchmarking the Information Society”, www.sibis-eu.org). This document presents some of the project’s main findings so far.
There are at least two main reasons that make this document interesting. First, it is one of the few original attempts to have a coherent and comprehensive approach in measuring the Information Society. As such it is expected to stimulate further debate and research among the professional statistical community, leading to an improved statistical competence in Europe. Second, it provides a unique single source of data on real time which supports many of the new IST research areas, at the launch of Framework Programme 6.
Building on the original SIBIS research, in particular on the results of the indicator surveys, the project has produced 9 reports, selected from those addressed by e- Europe.
The SIBIS work attracts further interest since it also supports the e-Europe 2005 initiative. SIBIS is carrying out an evaluation and a benchmarking of the eEurope 2005 initiative for the 15 EC Member States and the 10 Accession countries which will become available later in 2003. Both the reports and benchmarking results can be obtained from the SIBIS web site.
The publication of the SIBIS project results is a timely and direct contribution to benchmark progress on key issues of the Information Society in general and the e- Europe initiative in particular.
Thanassis Chrissafis
athanassios.chrissafis@cec.eu.int DG INFSO-C6
Preface
This report is a deliverable of the SIBIS project (Statistical Indicators Benchmarking the Information Society), funded by the European Commission under the “Information Society Technologies” Programme (1998-2002). The overall goal of SIBIS is to develop and pilot indicators for monitoring progress towards the Information Society, taking account of the “eEurope action lines”. SIBIS focuses on nine topics of interest, i.e.
Telecommunications and Access, Internet for R&D, Security and Trust, Education, Work and Skills, Social Inclusion, e-Commerce, e-Government and e-Health.
The current report is the final report on the benchmarking of Internet use in R&D and includes the most important outcomes of the study. However, some results have been presented in more detail in previous reports. In particular, the intermediate topic research report includes a more extensive review of the literature and the SIBIS indicator handbook describes the indicators in much more detail (both can be obtained from the authors or from the SIBIS website at: http://www.sibis-eu.org).
The first three chapters of the present report give an overview of the main outcomes (Executive summary), the context (Introduction) and the indicators developed (Identification of the indicator framework). Chapter 3 focuses on the analysis of the indicators for which data is presently available. The final chapters (Further developments, Conclusions) summarise the outcomes of the study and outline areas where future research might be necessary. Annex 1 consists of tables and graphs which provide the reader with access to the data referred to in the report. Annex 2 contains the questionnaire used to carry out a survey among European scientists which provided the majority of the data used in this report.
SIBIS is lead by empirica (Bonn, Germany), and includes the following project partners:
RAND Europe (Leiden, The Netherlands), Technopolis Ltd. (Brighton, UK), Databank Consulting (Milan, Italy), Danish Technological Institute (Taastrup, Denmark), Work Research Centre Ltd. (Dublin, Ireland), University of Applied Sciences Solothurn Northwestern Switzerland (Olten, Switzerland).
This report has been peer reviewed, however the authors are solely responsible for its contents.
We thank Loet Leydesdorff, Mike Norris, Bert van Pinxteren, Andrea Scharnhorst, and John P.
Walsh for commenting on this report.
For more information about the FHSO or this document, please contact:
Franz Barjak Prof. Dr. Najib Harabi
E-mail franz.barjak@fhso.ch E-mail najib.harabi@fhso.ch (Head of the SIBIS research team
at the FHSO)
Fachhochschule Solothurn Nordwestschweiz Riggenbachstrasse 16
CH-4600 Olten, Switzerland
Phone: +41 848 821 011, Fax: +41 62 296 6501
Executive summary
The SIBIS topic “Internet for R&D” sets out to benchmark the use of the Internet in European research. In principle this includes academic and private sector research and development (R&D) establishments across all disciplines and industries and throughout all EU member states (plus selected additional countries such as Switzerland and the U.S.). However, the limited scope of the project required some focusing and delimitation and we therefore focused mainly on public science. In the present report we give a brief summary of the indicator system needed to perform benchmarking of the use of the Internet in public science together with the results of a benchmarking exercise based on the currently available data and a survey of European scientists.
The Internet is a global network of computers which supports the transmission of information using various information-sharing techniques (e.g. http, smtp). E-mail and the World Wide Web were invented by and for science. Researchers in some disciplines may still be considered as avant-garde information and communication technologies (ICT) users in a work environment. Hence, exploring the Internet in science should give clues about future ICT requirements and trends in other areas of society. Internet applications also constitute an important group of inputs to R&D activities and hence they affect the degree to which science can function as a source of new knowledge, innovations and technical progress.
Indicator system
We distinguish three thematic domains and use them to structure the indicator system (see the figure):
y Readiness for computerized and networked science covers indicators on the computer and network infrastructure in science and the computer skills and IT awareness of scientists. Capable computers and networks with sufficient transmission capacities represent the technical preconditions for modern science.
Computer skills and an awareness of the capacities of IT for knowledge production are other, somewhat less strict prerequisites.
y The Use of Internet tools and applications section includes indicators on a variety of tasks in science for which computer networks are employed. Internet-based applications have become integrated into such diverse activities as data collection and data analysis, information retrieval, communication, collaboration and publishing. Some of the applications are especially useful in a specific phase of a research project, i.e. during planning and definition, implementation or dissemination, whereas others are used during the entire duration of a project.
y Indicators on the Impact of the Internet are used to assess the production of new knowledge which may be considered as the main aim of science. We include indicators that cover two outcomes of scientific work, i.e. publications and patents.
Furthermore, scientific collaborations can be affected by the use of Internet applications. Therefore we also include indicators on the occurrence of R&D collaborations and the size of collaboration networks. Readiness-related and use- related variables can be regressed on these outcome variables in causal analyses in order to evaluate the impact of the Internet on science. This, however, was not the task of the SIBIS project.
Figure: The indicator system on the Internet in public science
Topic
Thematic domain
Thematic sub-domain
Use of Internet tools and applications
Impact of the Internet
On-line data collection and analysis
On-line information sources Scientists’ web presentations Research networks
Computer equipment Electronic information sources Awareness of Internet potentials
Computer skills
Indicators on the Internet in science
Indicators
Computer-mediated communication Collaboration applications
Scientific publications Patents R&D collaborations
Internet in public science
Readiness for computerised and networked science
Source: FHSO compilation.
Data sources
Most indicators in this section were developed from new in the SIBIS project. For some indicators, experience gained in previous scientometric and other scientific work could be used which was extensively analysed in the previous deliverables in the topic area
“Internet for R&D” (see in particular the reports from work package 2 on the SIBIS website http://www.sibis-eu.org/sibis). In order to test the indicators and collect more information on their strengths and weaknesses, a survey was carried out among European scientists in five scientific disciplines (astronomy, chemistry, economics, computer science and psychology). Another major source of indicators on research networks (RNs) is TERENA, the Trans-European Education and Research Networking Association. TERENA has very good access to the national RNs and offers unique data on their capacities and performances.
There are no other sources of indicators on the Internet in science. However, data on scientific output and collaboration have been collected for some time. The OECD, together with the national statistical institutes and R&D institutions, has developed various manuals and databases: The Main Science and Technology Indicators Database (MSTI) covers the outputs (patents) as well as inputs (personnel, expenditure) of R&D activities in the public and the private sector. Patent data from different sources are also published on the OECD website. Other partly proprietary databases cover specific elements of science such as the publications and citations databases of the Institute for Scientific Information (ISI). However, as yet there is no database covering the technological inputs for science or private R&D activities.
Benchmarking results
The implementation of the indicator system and the benchmarking of the Internet in science among European countries in general provided valid and interpretable results, despite the limited data available. Due to the particular eEurope emphasis on RNs, it seems appropriate to highlight the country differences in this area: The Netherlands and Sweden perform well for the RN indicators, whereas Greece, Ireland and Portugal lag somewhat behind the other countries. Finland and Denmark had attained a very
good position, though their efforts towards further improvement seem to have tailed off somewhat, whereas Spain and Belgium seem to be catching up. It is difficult to rate the larger countries in the survey (Germany, France, UK, Italy) because the available indicators do not yet take different country sizes properly into account.
Overall, the differences in Internet access and use in science can be correlated fairly well with the known differences in scientific output among countries. There is no direct linear relationship between these phenomena, but the overall tendency is clear:
countries with highly productive science systems have made more advanced use of Internet tools than countries with less productive science systems. Swiss scientists in particular perform very well for the e-readiness indicators and at the same time for the indicators on scientific output (but not on R&D collaborations). The same applies to Danish scientists, though to a lesser degree. Dutch science usually obtains a better output and impact rating than Danish science and Dutch scientists also collaborate a lot, though nevertheless their Internet readiness indicators (and some use indicators) were worse. Of the seven countries included in the SIBIS R&D survey, Italy and Ireland lag somewhat behind the others in regard to Internet readiness in science (and Ireland also in regard to Internet use). The overall tendency also points to below-average performance for the output indicators in these countries. The positions of Germany and the UK are close to the average. However, both countries have specific strengths and weaknesses regarding the output of their science systems.
The data of the SIBIS R&D survey yielded results which show that the differences regarding readiness for, and use of, Internet tools are much more pronounced for the five scientific disciplines of the survey than for the countries. Astronomers and computer scientists have a better infrastructure and higher Internet-related skills levels than scientists from the other disciplines. They are also more experienced in using Internet applications. However, they do not use the technology in the same way.
Astronomers rely heavily on computer networks for collecting and analysing data, retrieving information, social communication and scientific collaboration. They do not use the Internet and the WWW very much for disseminating their research results.
Computer scientists often do not use empirical data for their research and consequently draw little benefit from on-line data access (in comparison to the other disciplines). But they use the Internet a lot for the dissemination of research results, communication and collaboration. Chemists, economists and psychologists in general had lower scores for the readiness and use indicators than the two other disciplines.
There is one notable exception to this: For economists, working papers are an important means of communicating research results and they use their own homepage(s) and the Internet in general for making these papers available to their peers and the general public.
It is almost impossible to compare the outcome of scientific work between the different scientific disciplines as they publish in different media which cannot be compared easily. In regard to R&D collaborations it is notable that nearly all astronomers are involved in collaborations. Their collaboration networks are the largest and they have the most co-authors of all scientists. At the opposite end of the scale, economists and psychologists are a lot less involved in R&D collaborations. Computer scientists and chemists are somewhere in between the extremes. Hence, for the scientific disciplines we can state that there are some parallels for collaboration activities and Internet readiness and use. This is not particularly surprising, as the main benefit of many Internet applications is the lowering of barriers to communication and collaboration.
Issues for further research
However, the present study did not analyse any causalities. It is possible, for instance, that astronomers use Internet applications more, because they collaborate a lot and have to overcome the distances to their collaborators; but computer networks might also have further supported the growth of collaborative activities. Based on this analysis we cannot support any interpretations of the type “the Internet increases
scientific productivity”; however, we cannot deny that this may be one of the effects. In order to clarify this, further research that uses the Internet indicators developed in SIBIS and relates them to output indicators is needed.
Furthermore, the indicator system and the available data cannot yet be regarded as comprehensive and further research is needed on a variety of issues. A quasi “natural”
consequence of the novelty of the Internet is that some indicators are still deficient and that for some developments valid and reliable measurement concepts are still lacking.
The first applies for instance to national RNs: the available indicators permit only a limited comparison between large and small RNs and further analysis is required to determine how the comparison could be improved. Additional measurement concepts are needed for sub-national RNs, electronic library services, the use of grids and other new infrastructure and applications. In addition, the development of collaboratories, i.e.
large-scale scientific collaborations that depend on computer networks, should be investigated and operationalised further. In fact we should broaden the appeal: A more detailed and internationally comparable data assessment of inputs and outputs in public science is urgently needed. The OECD, statistical institutes and science and technology ministers are called to extend their monitoring and data collection activities in this field.
Policy recommendations
There is also need for action with regard to science and technology policy. In terms of research networks, one of the focuses of the original eEurope initiative, the local networks and the connections to national networks, has in the meantime become the principle bottleneck. The scientists at disadvantaged institutions and their collaborators could benefit from improvements. Furthermore, we identified countries that are more advanced and other countries that are less advanced on their path towards computerised science. With the developments currently underway, computer networks will permeate science to a greater rather than a lesser degree. Though we did not investigate the influence on scientific productivity and cannot state whether Internet applications increase productivity, it is advisable for the countries that have fallen behind to launch catch-up strategies. A drastic consequence of a permanent development gap could be that some research fields in these countries become isolated from global scientific progress as their scientists do not have the necessary infrastructure and have not mastered the required techniques and methods for participating. This scenario must be prevented.
1 Introduction
Buzzwords such as “Information Society”, “Digital Economy” or “Cyberspace” highlight the trend of increasing integration of information and communication technologies (ICTs) into the lives of people all around the world. Though this trend has been described in thousands of articles, we still lack detailed knowledge regarding its features and effects in many areas. This explains why MIT researchers recently suggested a research programme to study the role of organisations in the development of the digital economy which would deal with the social transformations within and across internetworking organisations and with the use and effects of Internet applications1. We are not yet able to fully understand or even observe the consequences of the information revolution as too many areas are affected by the new technologies, many technological and social developments are too new and the pace of change is too rapid. The fundamental problem is that we often lack valid concepts which show us where we should look and what we should measure in order to assess the size and effects of ICT developments, not to mention the empirical data itself. This applies to all of the different subsystems of society and the economy and hence, with regard to the SIBIS project, analysing nine of these subsystems can only be a modest contribution to what should become a broader effort in various fields of science. The present document analyses the extent to which Internet applications are used in one societal subsystem, namely science.
Three different concepts of science have been identified:
y First, it is a body of certified knowledge,
y Second, science is also a set of procedures for finding things out,
y Third, “… science is a social enterprise, a culture or tradition, and a set of social arrangements for developing, certifying, and communicating knowledge.”2
We will use the term science mainly in line with the second and third concepts and stick to the general term “knowledge” for denoting what science produces.
Our understanding of the Internet also needs a brief elaboration. It is basically considered as a “global network connecting millions of computers”.3 The Internet consists of technical infrastructure, particularly computers (“servers”) and data storage devices and connections (narrowband and broadband) among these servers. This infrastructure is used with various information-sharing techniques to transmit, retrieve and display digitised items of information (the measurement and coding is usually performed using additional technologies). The most common techniques are currently the Hyper Text Transfer Protocol (HTTP) of the World Wide Web (WWW), the Simple Mail Transfer Protocol (SMTP) of e-mail and the File Transfer Protocol (FTP).4 These techniques and the applications based on them have become omnipresent tools for researchers. Other applications are still in the market introduction phase, such as on- line conferencing tools or grids. In particular these latter tools are not ideally suited to reliable and detailed measurement as their stability levels are still low. Looking at the relationship between new technology and its users (and other relevant social groups) we must expect frequent modifications of the technology before ‘closure’ can take place.5 Hence, in an early innovation phase, it is very difficult to collect valid and
1 Orlikowski, W. J.; Iacono, C. S. (2000): The truth is not out there: an enacted view of the “Digital Economy”, in: Brynjolfsson, E. and Kahin, B. (eds): Understanding the digital economy. Data, tools, and research. Cambridge and London, pp. 352-380.
2 Zuckerman, H. (1988), The sociology of science, in: Smelser, N. J. (ed.), Handbook of sociology.
Newbury Park, p. 513.
3 http://www.webopedia.com/TERM/I/Internet.html
4 Cf. on all these terms: http://www.webopedia.com.
5 Bijker, W.; Pinch, T. (1987): The social construction of facts and artefacts: or how the sociology of science and the sociology of technology might benefit each other, in: Bijker, W.; Hughes, T.P.; Pinch, T.
reliable quantitative data, establish benchmarks or undertake comparisons at national level. Indicators on the more established and stable applications are therefore much more frequent and detailed in our indicator system.
A common concept of how the different forms of Internet use in science should be denoted does not yet exist. “E-Science” is often used in the context of remote access to large scale computing power and data storage resources.6 The necessary infrastructure to access these facilities and transmit data or the results of scientific analyses is often discussed in the context of grid technologies (see page 24). An additional target of e-Science is the lowering of barriers to long-distance collaborations.
Another term used in this context is “Internet science” or “i-science”. However, this denotes the use of the Internet as a research tool, the analysis of Internet-related behaviour, techniques or (research) methods, or the use of the Internet to conduct research on “offline” issues.7 Other terms which can be found are “cyberscience” or simply a circumscription of what is investigated, like the use of the Internet in science.
We also make use of this circumscription in the present analysis, as neither of the available alternatives provides a better description of what is included in this report. We use “modern science” or “computerised and networked science” as synonyms which, however, should not be misinterpreted as containing any value judgement.
The dissemination of computer networks throughout science has modernised it and has the potential to transform it. Since the initial introduction of electronic mail and the ARPANET some thirty years ago8 a multitude of further services for scientists has been developed. Computer networks and particularly the Internet have changed the way scientists collect data, retrieve information, communicate and collaborate. Of course, this is an ongoing process. Researchers also investigate the hypothesis that the computerisation of science transforms its economic and social structures.9 For instance it has been proposed that the establishment of electronic journals and preprint archives will have a negative effect on the relationship with scientific publishers and the traditional peer review of scientific publications. However, these are very recent developments and they contain lots of unsolved problems. It would be premature to include them in a statistical measurement, as it has not yet been possible to fully assess and understand many of the less complex phenomena of modern science.
The relationship between science and the Internet must be considered as particularly important: Science is an important source of technical knowledge, skills and innovations and is therefore a major motor of economic growth. Taking an economic production function approach we can model the output of science as a function of its various inputs: researchers and support staff, instruments, library collections, computers and other capital goods, services from various service providers (such as computing services) and many other material and immaterial inputs which are impossible to assess in their entirety. However, there can be no doubt that Internet applications constitute one important group of inputs which are used themselves or which provide access to other digitised research inputs such as databases and libraries. In order to evaluate the extent to which the different inputs contribute to a large and high-quality research output, statistical data for indicators on both sides of the production function are essential.
(eds.): The social construction of technological systems. New directions in the sociology and history of technology. Cambridge, pp. 17-50.
6 See for instance: Woolgar, S. (2003): Social shaping perspectives on e-science and e-social science: the case for research support. A consultative study for the Economic and Social Research Council, annex 1.
– http://www.e-science.clrc.ac.uk/web - http://e-science.ox.ac.uk/public/general/definitions .xml.ID=
body.1_div.1 – Rall, D. (2003): Message to the Air-l mailing list in the thread “e-science, the grid, and supercomputers” on 24. September 2003 (available at: http://www.aoir.org/pipermail/air-l/).
7 Reips, U. (2003): Message to the Air-l mailing list in the thread “e-science, the grid, and supercomputers”
on 29 September 2003 (available at: http://www.aoir.org/pipermail/air-l/).
8 Leiner, B.M. et al. (2000): A Brief History of the Internet. (http://www.isoc.org/internet/history/brief.shtml).
9 Hilgartner, S. (1995), Biomolecular databases: New communication regimes for biology? In: Science Communication, vol. 17, pp. 240-263.
The OECD, together with the national statistical institutes and R&D institutions, has developed various manuals10 and data collections. The Main Science and Technology Indicators Database (MSTI) covers the outputs (patents) as well as inputs (personnel, expenditure) of R&D activities.11 Patent data from different sources are also published on the OECD website. The European Community Innovation Surveys (CIS) and the Eurostat New Cronos Database deal with innovation in the private sector.12 Other partly proprietary databases cover specific elements of science such as the publications and citations databases of the Institute for Scientific Information (ISI). However, as yet there is no database covering the technological inputs for science or private R&D activities.
The lack of proper indicators in this regard has been frequently lamented in the literature:
“There is a pressing need to increase efforts and resources to undertake in-depth empirical studies on the innovative uses of Internet in science and to carry out European-wide surveys on this issue. Such studies are the only way to generate a sufficient amount of data and information necessary to evaluate the impact of new, high capacity electronic communication facilities upon the organization, distribution and conduct of collaboration on fundamental research problems.”13
At the same time the new possibilities and potential of computer networks have become increasingly important in concepts of science and technology policies. The European Commission has promoted a new research policy in its publications on the European Research Area (ERA).14 The common thread of many goals and measures described in these documents is the creation of multi-layered networks within the R&D system as well as across its boundaries, including other socio-economic areas and political institutions. These networks of researchers, research institutes, protagonists of specific research topics, stakeholders of R&D in different organisations etc. must be developed in parallel with modern, high-capacity communication networks. The European Commission acknowledges this fact and consequently promotes the enhancement of Research and Education Networks for data transmission and the development of novel collaboration-oriented computer systems (“grids”) within its eEurope initiative. The ERA communications cover the usage side of ICTs and encourage the development and implementation of further computer-based tools for science, the training of researchers about the possibilities of ICTs and the use of computer networks to connect the best researchers in Europe to form "virtual centres of excellence". Over the last three years many European countries have developed new concepts of research policy and some, for instance Finland and the U.K.,15 expect
10 OECD (1994a): The Measurement of Scientific and Technological Activities: Proposed Standard Practice for Surveys of Research and Experimental Development - Frascati Manual 1993. 5th Edition. Paris. - OECD (1994b): Using Patent Data as Science and Technology Indicators – Patent Manual. Paris 1994.
(http://www.oecd.org/pdf/M000014000/ M00014548.pdf). – OECD (1997): Proposed Guidelines for Collecting and Interpreting Technological Innovation Data: Oslo Manual. 2nd Edition. Paris.
11 OECD (2000): Main Science and Technology Indicators (MSTI). No. 2/2000, Paris.
12 Cf. Foyn, F. (2000): Community Innovation Survey 1997/98 - final results. Eurostat (Ed.): Statistics in Focus: Theme 9 Research and Development, no. 2/2000.
13 From the summary of a European Science Foundation conference, Foray, D. (1999): Building the Virtual
‘House of Salomon’: Digital collaboration technologies, the organisation of scientific work and the economics of knowledge access. Report of the ESF-IIASA-NSF Workshop - 3 to 5 December 1999 - at the International Institute for Applied System Analysis, Laxenburg, Austria, p. 9.
(http://www.esf.org/policy/pdf/iiasa.pdf)
14 Cf. especially: EC (2000): Towards a European research area. Communication from the Commission COM 2000 (6). Brussels, 18 January 2000. (http://europa.eu.int/comm/research/area/com2000-6-en.pdf).
– EC (2000): Making a reality of the European research area: guidelines for EU research activities (2002- 2006). Communication from the European Commission COM(2000) 612 final. Brussels, 4 October 2000. (
15 The Finnish government elaborated “A National Strategy for 2000-2004. Education, training and research in the Information Society” which deals with ICT and the information society as research topics and also covers the multiple opportunities of employing ICT for scientific research. The government also tries to realise its vision of Finland as a leading interactive knowledge society in the year 2004 by means of many different programmes, actions and instruments. The British Government communicated its science and innovation policy in a white paper on “Excellence and Opportunity: a science and innovation policy for the 21st century” together with an implementation plan. The documents laid down many commitments which aim at improving the usage and the effects of ICT in R&D and they also determine concrete
ICTs to contribute to the development of science. This orientation of research policy towards ICTs makes it even more necessary to develop indicators and collect data that are capable of quantifying the relationship between ICTs and R&D.
There is therefore a pressing need to develop indicators on the use of the Internet in science and to relate these to research output in order to better assess the success factors in science and thereby help steer science and technology policy. Before the indicator system can be discussed in more detail, it is necessary to delineate its scope and define some of the major categories.
In Chapter 2 we begin with an (abridged) overview of the relevant literature on Internet applications in R&D. This was carried out to identify the most important issues and give the indicator system some general structure. The entire literature review is the result of SIBIS work package 2 (Topic research and indicator analysis) delivered to the EC in January 2002.16 We briefly present our indicator system in Chapter 2 and include selected indicator details, such as exact definitions, methodological issues, data availability etc. in the annex. These issues form part of the main body of another deliverable of the SIBIS project, the indicator handbook, which was made available in print and electronic form in September 2003.17 In Chapter 3 we perform benchmarking of national research systems using the selected indicators. Due to missing secondary data, we attempted to close many of the gaps through a survey among scientists in different European countries and scientific disciplines. Section 4 highlights the current major deficits in the indicator system and the necessity of future investigations to overcome these. The last section contains a brief conclusion.
responsibilities and activities to monitor and evaluate the progress achieved (cf. British Department of Trade and Industry (2000): Excellence and Opportunity: a science and innovation policy for the 21st century. (http://www2.dti.gov.uk/ost/aboutost/dtiwhite/ index.html). - British Department of Trade and Industry (2000): Implementation Plan on the White Paper “Excellence and Opportunity: a science and innovation policy for the 21st century”. (http://www2.dti.gov.uk/ost/whatsnew/01.htm).)
16 Barjak, F.; Harabi, N. (2002): Topic research report on the Internet for R&D. SIBIS Deliverable 2.1. Olten, Switzerland. (Available at: http://www.sibis-eu.org/sibis/files/D2-2/SIBIS_WP2_R_and_D.pdf). Other reviews are for instance: Aubert, J.E.; Bayar, V. (1999): Maximising the Benefits of Information Technology for Science: Overview and Major Issues, in: STI REVIEW no. 24, Special Issue on “The Global Research Village’’, pp. 7-28. – European Technology Assessment Network (ETAN) (1999):
Transforming European science through information and communication technologies: challenges and opportunities of the digital age. Final version. – Nentwich, M. (2001): How online communication may affect academic knowledge production - Some preliminary hypotheses, in: Trans - Internet-Zeitschrift für Kulturwissenschaften, no. 10. (http://www.inst.at/trans/10Nr/nentwich10.htm).
17 See also the project website for an electronic version of the document.
2 Identification of the indicator framework
2.1 Overview
Overall, there can be no doubt that multiple feedback between the Internet and science is occurring: The WWW was developed to facilitate scientific collaboration and the Internet has made it easier to access information that would otherwise be difficult to obtain. E-mail has made asynchronous communication less formal and more frequent.
R&D collaboration over large distances has been enhanced, as it has become easier to communicate and transmit large volumes of information in various formats. This report discusses indicators for the most important facets of Internet applications in science.
We differentiate between three groups of indicators:
y Readiness for computerized and networked science covers indicators on the computer and network infrastructure in science, and the computer skills and IT awareness of scientists. Capable computers and networks with sufficient transmission capacities are the technical preconditions for modern science.
Computer skills and an awareness of the capacities of IT for knowledge production are other, somewhat less strict prerequisites.
y Use of Internet tools and applications includes indicators on a variety of tasks in science for which computer networks are employed. Internet-based applications have become integrated into such diverse activities as data collection and data analysis, information retrieval, communication, collaboration and publishing. Some of the applications are especially useful in a certain phase of a research project, i.e.
during planning and definition, implementation or dissemination, whereas others are used over the entire duration of a project.
y Impact of the Internet indicators assess on the one hand the production of new knowledge which may be considered as the main aim of science. We include indicators that cover different outcomes of scientific work i.e. publication and patents. On the other, hand scientific collaborations can be affected by the use of Internet applications. Therefore we also include an indicator on the size of collaboration networks. Readiness- and use-related variables can be regressed on these outcome variables in causal analyses.
The analysis of the topic and the indicator system were structured accordingly (cf.
figure 1). In principle, such an indicator system could be infinitely large and the useful indicators should be differentiated from the less useful and useless in order to make the system feasible. In addition to measurement-related criteria such as validity, reliability, direction, sensitivity to differences and accessibility,18 the range of applicability is an important criterion for selecting an indicator. As the aim of the SIBIS project has been to produce indicators which are suitable for describing the situation of science at least in the developed world, we had to abstract as much as possible from the specifics of an individual academic discipline. Indicators which only contain information on one or only a few research disciplines are not particularly helpful. We will concentrate on multi-disciplinary indicators, even if this leads to gaps in the coverage of the indicator system. However, it seems preferable to have some gaps rather than to construct an indicator system that is not particularly representative of the national science systems, though this does not imply that the indicator system ignores differences among the academic disciplines. Instead we will try to make these visible by assessing comparable indicators.
18 Cf. Weiss, C. H. (1998): Evaluation. 2nd edition, Upper Saddle River, pp. 144-150.
Figure 1: The indicator system on the Internet in public science
Topic
Thematic domain
Thematic sub-domain
Use of Internet tools and applications
Impact of the Internet
On-line data collection and analysis
On-line information sources Scientists’ web presentations Research networks
Computer equipment Electronic information sources Awareness of Internet potentials
Computer skills
Indicators on the Internet in science
Indicators
Computer-mediated communication Collaboration applications
Scientific publications Patents R&D collaborations
Internet in public science
Readiness for computerised and networked science
Source: FHSO compilation.
After discussing the different possibilities for measuring the degree of Internet use and the impact on R&D and deleting indicators which would not meet the required criteria, a list of indicators was assembled.19 This list is shown in Table 1. The largest number of indicators, ten in all, assesses the “Readiness” dimension. In addition to the TERENA surveys the major source of data for the indicators is our own SIBIS R&D survey.
However, for two indicators no data at all was available. For the “Use” domain which consists of six indicators, no source other than the SIBIS R&D survey was available.
The “Impact” domain deals with the outcome of scientific work and R&D collaborations, for which there exist some “traditional” indicators from other sources which have been used for some time in scientometrics and which can be used and supplemented by SIBIS.
Table 1: Indicators on the Internet in science Thematic
Domain
Sub-domain SIBIS indicators Sources of
data Core usable backbone capacity on a
national RN
Total congestion ratio on the RN Research
Networks (RN)
Average budget of a national RN
Data from TERENA Computer
equipment
Quality of scientists’ computer equipment SIBIS R&D survey Size of digital journal collections
Staff providing electronic library services
Not yet piloted Electronic
information
sources Scientists’ access to on-line information sources
Awareness of
Internet potential Influence of the Internet on choosing R&D topics
Computer skills levels of scientists Readiness
Computer skills
Internet skills levels of scientists
SIBIS R&D survey
19 Documented in the topic report of SIBIS work package 2 (cf. http://www.sibis- eu.org/sibis/research/reports.htm).
Thematic Domain
Sub-domain SIBIS indicators Sources of
data On-line data
collection and analysis
Use of Internet-based data collection and data analysis methods
On-line infor-
mation sources Use of on-line information sources Scientists’ web
presentations World Wide Web penetration rate E-publishing Working papers available via the Internet Computer-media-
ted
communication
Computer-mediated social communication for R&D purposes Use
Collaboration
applications Use of collaboration applications
SIBIS R&D survey
Publications in scientific journals per capita
Scientific publications
Citation index
ISI data
Patents Triad patent families per capita
OECD based on patent offices Involvement in international R&D
collaborations SIBIS R&D survey Impact
R&D
collaborations Percentage of co-authored scientific articles
ISI data Source: FHSO compilation.
The following Sections 2.2 to 2.4 provide brief descriptions of the topic areas and focus of the indicators listed in Table 1 whilst Section 2.5 discusses the operationalisation and assessment of the indicators.
2.2 Readiness for computerised science
We understand readiness for computerised science as the existence of prerequisites and favourable circumstances among which two categories of factors can be distinguished:
y The first category contains determinants which constitute some sort of infrastructure that is necessary for carrying out modern science, such as computers, computer networks and digitalised information sources.
y The second category refers to somewhat less strict factors, such as computer skills and awareness of the potential of IT for knowledge production. These factors are often difficult to measure but are by no means any less important. They often form barriers to the efficient use of the available infrastructure.
We will briefly discuss each of these factors in turn.
2.2.1 Infrastructure
Among the infrastructure we distinguish computer networks, the computer equipment of scientists and the availability of digital information sources for scientific work.
Research networks (RNs), i.e. the physical and institutional networks for transmitting data among R&D locations, represent one of the major issues of Internet use in science. They were also the key issue of the eEurope 2002 activities in regard to science.20 Research networks have been established on different spatial levels (local, national, supra-national), of which the national level is a very important one; we can therefore expect differences in the service levels between countries. TERENA, the Trans-European Research and Education Networking Association, has recently initiated the development of indicators on national networks. In discussions with its members (the national research networks) it developed indicators on transmission capacities, budgets, staffing and traffic on the networks and these can be considered as a good basis for further considerations. TERENA has also performed various rounds of data collection and preliminary comparisons. For the other geographical levels, only partial data exists. Whereas the TERENA surveys also look at the international connectivity of an RN, local and campus networks are largely ignored. However, these are also important, if we want to benchmark the level of data transmission services available to any researcher at any research location in a country.
The quality of the available computers influences what can be done with the material obtained via research networks. “Quality” refers in particular to computing power. While in the past computing power was localised, this has changed and one of the benefits of research networks is the broadened access to various types of computers such as supercomputers or PC clusters. In many cases this has accelerated scientists’
calculations thereby saving time. In order to assess computing power, an indicator was developed which takes into account the types of available computers (stand-alone PC, workstation, mainframe, supercomputer, cluster of PCs) and the age of the computer used most of the time (see the Methodological table M-2 in the annex regarding calculation of the indicator). This information was collected at the individual level in the SIBIS survey. We used the data to calculate indicators at the level of countries and scientific disciplines. Computer quality can be expected to vary according to country and scientific discipline as the importance of computers differs and because the budgets available to scientists for infrastructure can vary markedly.
Digital information sources, especially those accessible via computer networks, represent a major advance for information retrieval in modern science. The rapid access and the search facilities of electronic texts can speed up information retrieval markedly. However, access to the electronic versions of scientific journals is usually expensive and is dependent on a valid subscription. Increasing access to advanced Internet services, including electronic information sources, is one specific goal of European research policy as laid down in the communications on the ERA.21 We can look at the availability of digital information sources from two perspectives: that of the supplier and that of the user.
The suppliers’ point of view has been taken by various other research projects in Europe and the US with a focus on developing indicators for digital libraries.22 We singled out two of their indicators as particularly valuable for measuring the amount of network-based information that is publicly accessible to researchers: the number of
20 Cf. European Commission (2000a): eEurope: An Information Society for all. Communication on a Commission Initiative for the Special European Council of Lisbon, 23 and 24 March 2000. – European Commission (2000b): eEurope 2002: An Information Society for all. Action plan prepared by the Council and the European Commission for the Feira European Council, 19 and 20 June 2000.
21 European Commission (2000c): Towards a European research area. Communication from the Commission COM 2000 (6). Brussels, 18 January 2000. (http://europa.eu.int/comm/research/
area/com2000-6-en.pdf). - European Commission (2000d): Making a reality of the European research area: guidelines for EU research activities (2002-2006). Communication from the European Commission COM(2000) 612 final. Brussels, 4 October 2000. (Http://europa.eu.int/comm/research/area/ com2000- 612-en.pdf).
22 For instance: Brophy, P. et al. (2000): EQUINOX - Library Performance Measurement and Quality Management System: Performance Indicators for Electronic Library Services. (http://equinox.dcu.ie/
reports/pilist.html). - Shim, W. et al. (2000): ARL E-metrics project: developing statistics and performance measures to describe electronic information services and resources for ARL libraries.
(http://www.arl.org/stats/newmeas/emetrics/phaseone.pdf).
objects in digital collections and the staff figures for electronic library services.
However, data at an aggregate country level is not available for either of the indicators.
The users’ perspective was taken in the SIBIS R&D survey and scientists were asked whether they could access the most important information sources via computer networks.
2.2.2 Attitude towards Internet applications and Internet skills
Awareness of its potential is one of the most important of the less strict factors which shape the readiness for using the Internet in science. It determines when a scientist will turn to the Internet and use network-based applications. The EC research policy also aims to increase scientists’ awareness of the potential of computer networks and encourage their use. The present indicator can be considered as an operationalisation of the awareness construct. We developed a question which assesses whether the Internet is perceived as a common tool that supports the selection of research problems. It should be pointed out that it does not matter whether the idea for a new R&D project was the result of browsing the WWW or debating an issue with a colleague. The benchmarking value of the indicator does not rest in the outward Internet usage, but in the attitude towards the Internet which it reveals. This attitude may change the topics of research and the approaches that are pursued.23
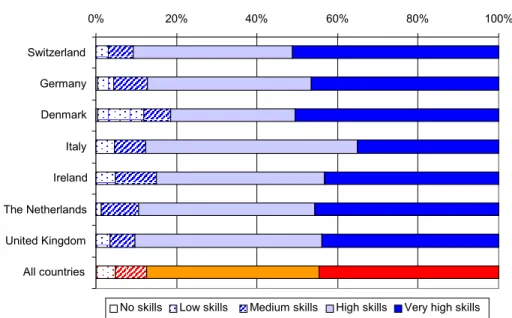
Another determinant of the use of computers and Internet applications are the skills of the users. A skills gap may form an important barrier to the effective use of computer/Internet applications, particularly if the potential user is familiar with other methods for carrying out the task. Also the acquisition of skills is an investment which must be made before the application can be used efficiently.24 We developed two rather general indicators which are related to scientists’ Internet skills: one that measures the computer skills of scientists in general and another one that looks directly at their Internet skills. Both indicators employ a similar methodology: the respondents are asked what type of computer applications/Internet tools they use. The more software they use – in regard to computer software in general an additional weighting scheme is included that differentiates between three levels of sophistication – the higher their skills level (see Methodological table M-3). For both indicators data was gathered in the SIBIS R&D survey.
We would expect that these indicators differ markedly between scientific disciplines and only to a lesser extent between countries. Top-level science is very much a global undertaking and we should expect similar awareness of the potential of the Internet and similar computer and Internet skills, in particular among the well developed countries of our European sample (if the country sample included less developed countries, however, this would not be the case). As computers and the Internet have attained different roles in different disciplines, we expect more variation between the disciplines with regard to the Internet.
2.3 Use of the Internet in science
This section includes indicators on a variety of tasks in science for which computer networks are employed. Internet-based applications have become integrated into such
23 Cf. Nentwich, M. (2001), op. cit. - In regard to ethnographic research: Dicks, B.; Mason, B. (1998):
Hypermedia and Ethnography: Reflections on the Construction of a Research Approach, in: Sociological Research Online, vol. 3, no. 3. (http://www.socresonline.org.uk/ 3/3/3.html). – Kircz, J.G. (1998):
Changing Presentations! Changing Science? Colloquium “L'écrit de la science/Writing Science”
organised by the journal “Alliage” for The European Science & Technology Forum of the European Commission (DG XII), Nice 12-14 March 1998. (http://www.science.uva.nl/projects/commphys/
papers/nicem.htm).
24 Skills have been discussed in a more general context in another topic of the SIBIS project, cf. Gareis, K.;
empirica (2002): SIBIS Topic Report No. 5 on Work, Skills and Employment. (Available at:
http://www.sibis-eu.org).
diverse activities as data collection and analysis, information retrieval, publishing, communication and collaboration. Some of the applications are especially useful in a certain phase of a research project, i.e. during planning and definition, implementation or dissemination, whereas others are used during the entire duration of a project. In the present section we distinguish between information and publishing, social communication and R&D collaboration. We expect rather little variation in the use indicators between countries and more variation between scientific disciplines for the same reasons as for the above-mentioned indicators on Internet awareness and computer skills.
2.3.1 Information and publishing via the Internet
Information denotes the process of a one-way transmission of data – defined as the unstructured results of measurement, observation and other forms of evidence collection; collected directly at the source or from secondary sources (e.g. statistics) – or information objects – defined as data that have been organized and communicated.25 Internet applications can be used for different purposes: collecting data and processing it into information, for retrieving existing information and for disseminating data or information. The first two look at information from a demand side whereas the latter takes a supply-side perspective.
The collection and processing of data is a genuine task in empirical research. In many disciplines it is also among the most expensive tasks. The Internet has the potential to reduce costs, e.g. as the data sources can be accessed more easily or expensive equipment is used at levels closer to its capacity. The latter is one target of European research policy, expressed for instance in the FP5 programme “Access to Research Infrastructures” and in the ERA communications. Methods of on-line and off-line data collection vary between the sciences (where usually some sort of instrument or apparatus is used to collect data from nature, experiments or simulations) and the social sciences (where human beings are often used for collecting human-related data). However, accessing existing databases in order to retrieve secondary data is a common method in both the sciences and the social sciences. The processing and analysis of the data was historically a highly localised undertaking. On-line access to software installed on other servers, distributed computing and other network-based tools have broadened the influence of the Internet on data analysis. These effects are quantified by means of an indicator on the use of the Internet for data collection and analysis (see Methodological table M-4 in the annex for the details).
In order to carry out up-to-date research which advances the current state of knowledge, in addition to raw data scientists also need the results of previous research contained in research papers, journals, books etc. and contextual information. The Internet and particularly the World Wide Web have changed the way scientists access this sort of information:26 Whereas visits to libraries, conference attendance and conversations with colleagues were the most important sources of information, the World Wide Web has moved many sources to the electronic sphere and this has improved the availability of information. In the past, only a few scientists had the chance of talking to an MIT colleague; nowadays everybody can visit his or her homepage. As not every scientist has the same information requirement, an indicator which assesses the use of the Internet for information retrieval must take the general need for information into account.
Scientists not only require information for their work, they are also suppliers of information. Traditionally this was achieved through the publication of research results
25 Prorat, M. U. (1977): The Information economy: Definition and Measurement. U.S. Department of Commerce, Office of Telecommunications, p. 2.
26 Cf. Day, J.; Bartle, C. (1998): The Internet as an Electronic Information Service: Its Impact on Academic Staff in Higher Education. Proceedings IRISS '98 International Conference: 25-27 March 1998, Bristol, UK. (http://sosig.ac.uk/iriss/papers/paper06.htm).
in working papers, scientific journals, books, and other publication media. With the spread of the Internet, the speed and sequence of traditional publication processes have started to change.27 Furthermore, new publication forms have been developed and many scientists consider the change in the publication process as one of the major ICT-induced changes in science.28 We referred to the new types of “formal”
publications (such as preprint archives, electronic journals) and some of the issues that are discussed in their context (such as the problem of quality control) in a previous report of the SIBIS project.29 While it is still possible to benchmark “formal” publications by taking data from the publishers (i.e. the database and archive administrators or the publishers of an e-journal) this is not possible with more informal methods of publication and self-publishing via the World Wide Web. Therefore we include in the indicator system, and in the benchmarking exercise, two indicators which are based on data collected at the sources of the new scientific information, the scientists themselves: 1) the web penetration rate is the percentage of scientists that have a homepage outlining their professional activities; 2) the most important content for readers with a background in science are the results of scientific work reported in scientific publications.
2.3.2 Social communication via the Internet
A rather broad understanding of communication is often used in science studies.
Garvey (1977) speaks of communication as the “essence of science”,30 meaning, however, the publication, dissemination, discussion and verification of new knowledge communicated to the scientific community by the scientific author. We have included this understanding of communicating scientific results in the previous section on the use of the Internet for disseminating scientific information (2.3.1) and we will take it up again in Section 3.3 which deals with impact assessment. However, in the present section we employ a narrower definition of communication which we label ‘social communication’. The term is used here for the intended transmission of information among human beings in which the receiver has been personally addressed by the sender. The term ‘computer-mediated communication’ (CMC) was coined to describe the new methods of social communication which have emerged since the beginning of the network revolution. Sudweeks and Allbritton (1996) define CMC as:
“… human communication between two or more individuals through the use of central computers that store and process message content, and are connected to users in a communication network.”31
For our purposes we would have to add to this definition that CMC is ‘intended human communication between two or more individuals in which the receiver has been personally addressed by the sender through the use of central computers…’
27 Cf. for instance OECD (1998): The Global research village: How information and communication technologies affect the science system. Paris. (http://www.oecd.org/dsti/sti/s_t/scs/prod/global.pdf). - Butterworth, I. (1998): The impact of electronic publishing on the academic community - an international workshop org. by the Academia Europaea and the Wenner-Gren Foundation. London [etc.]: Portland Press.
28 Cf. Lievrouw, L.A.; Carley, K. (1991): Changing patterns of communication among scientists in an era of
"telescience.", in: Technology in Society, vol. 12, pp. 457-477. - Hilgartner, S. (1995), op. cit. - Crawford, S.Y.; Hurd, J.M.; Weller, A.C. (1996): From print to electronic: the transformation of scientific communication, Medford NJ.
29 Cf. Barjak, F.; Harabi, N. (2002): Topic research report on the Internet for R&D. SIBIS Deliverable 2.1.
Olten, Switzerland, pp. 40-42. (Available at: http://www.sibis-eu.org/sibis/files/D2- 2/SIBIS_WP2_R_and_D.pdf).
30 Garvey, W. D. (1977): Communication: the essence of science. Facilitating information exchange among librarians, scientists, engineers and students. Pergamon Press: Oxford.
31 Sudweeks, F.; Allbritton, M. (1996): Working together apart: Communication and Collaboration in a Networked Group. (http://www.it.murdoch.edu.au/~sudweeks/papers/acis96.html), also published in: C.
D. Keen, C. Urquhart and J. Lamp (eds), Proceedings of the 7th Australasian Conference of Information Systems (ACIS96), Vol. 2, Department of Computer Science, University of Tasmania, pp. 701-712.