Institut für Landschaftsökologie
Diploma Thesis
Effects of combined ozone and nitrogen deposition on the early stage of leaf litter and root decomposition in
a subalpine grassland
Presented by Ulrike Zell
Münster, March 2011
Robert-Koch-Str. 26-28
- Diploma Thesis -
Effects of combined ozone and nitrogen deposition on the early stage of leaf litter and root decomposition in
a subalpine grassland
Presented by
Ulrike Zell
Münster, March 2011
Supervisor:
Dr. Seraina Bassin, Air Pollution and Climate Group, Agroscope Reckenholz-Tänikon Research Station ART, Zürich, Switzerland
Examiner:
Dr. Andreas Vogel, WWU Münster, Germany
Co-Examiner:
Prof. Dr. Jürg Fuhrer, Air Pollution and Climate Group, Agroscope Reckenholz-Tänikon Research Station ART, Zürich, Switzerland
Table of Contents
Abstract ... I Zusammenfassung ... II
1. Introduction ... 1
2. Materials and Methods ... 3
2.1 Study site ... 3
2.2 Experimental design ... 4
2.3 Litterbag experiment ... 4
2.4 Litter quality analyses ... 5
2.5 Plant functional groups ... 5
2.6 Microbial biomass and soil properties ... 5
2.7 Statistical analyses ... 6
3. Results ... 6
3.1 Decomposition ... 6
3.2 Litter quality ... 9
3.3 Litter quality and decomposition ... 11
3.4 Microbial biomass ... 12
4. Discussion ... 13
4.1 Decay rate aboveground vs. belowground ... 13
4.2 Treatment effects on litter quality ... 13
4.3 Litter quality and decomposition ... 14
4.4 Microbial biomass ... 16
4.5 Relevance of results and implications for future studies ... 16
5. Conclusion ... 17
Acknowledgments ... 17
References ... 18
Appendix ... 22
Statement ... 25
I Abstract
Elevated ozone (O3) and nitrogen (N) deposition are known to affect plant growth and development in grassland ecosystems and in turn may alter the decomposition process of plant residues, with far reaching consequences for carbon (C) and nitrogen (N) cycling. This investigation aimed at expanding the limited understanding of this topic by examining the effects of tropospheric O3 (1.6 x ambient), reactive N (+ 50 kg ha-1 yr-1) and of their interaction on aboveground litter and belowground root quality (lignin, C, N, P, K, Mg, Ca), soil microbial biomass and subsequent consequences on short term leaf and root decomposition in a subalpine pasture community. Mass loss was determined by a three month period of in situ litterbag incubation and microbial biomass C and N were assessed by chloroform fumigation-extraction. A reciprocal litterbag transplanting between fertilized and unfertilized plots allowed differentiation between effects on litter decomposition through litter quality from effects mediated by changes in environmental conditions. Even though litter quality was significantly altered due to N and O3 addition, and could best predict variation in decay rates, treatment effects on decomposition were very slight, but were stronger for root material than for leaf litter. Leaf litter decomposition patterns were best explained by Ca, the only nutrient remaining unaffected by N and O3 deposition. Root decomposition was positively correlated to the concentrations of P and K that were both decreased with added N, leading to a reduced mass loss of roots from fertilized monoliths. An increase in the proportion of sedges, favored by N supply, might have been the cause for the lower root quality on fertilized plots. O3 alone had no significant effect on decomposition, but apparently compensated in part the negative effect of N on root quality, by a slight rise of the substrate K concentration. This resulted in an equal decomposition rate of root indifferent to their origin in fumigated rings. Microbial biomass was slightly increased by the combined addition of O3 and N, but could not explain variation in mass loss rates. Although O3 and N only slightly affected decomposition in its early stage, the significant changes in litter quality that may gain in importance in later decay stages, stress the importance for long-term studies on O3 and N deposition effects on decomposition in alpine ecosystems.
Keywords: decomposition, grassland, litter quality, microbial biomass, nitrogen, ozone, root and leaf decomposition, subalpine zone
II Zusammenfassung
Es ist bekannt, dass sich erhöhte Depositionen von Ozon (O3) und Stickstoff (N) auf Pflanzenwachstum und -entwicklung in Grasland auswirken, was wiederum einen potentiellen Effekt auf den Streuabbau, mit weit reichenden Konsequenzen für den Kohlenstoff- und N-Kreislauf haben könnte. Das Ziel dieser Studie war die Erweiterung des geringen Kenntnisstands zu diesem Thema, indem die Effekte von troposphärischem O3 (1.6 x ambient), reaktivem N (+ 50 kg ha-1 yr-1) und ihrer Interaktion auf oberirdische Streu- und unterirdische Wurzelqualität (lignin, C, N, P, K, Mg, Ca), mikrobielle Biomasse und daraus resultierende Effekte auf die frühe Phase des Abbaus von Blattstreu und Wurzelbiomasse untersucht wurden. Der Streuabbau wurde durch eine dreimonatige Litterbag Inkubation bestimmt und die mikrobielle Biomasse mittels der Chloroform Fumigations-Extraktion erfasst. Ein reziprokes Transplantieren der Litterbags in gedüngte und ungedüngte Flächen, erlaubte eine Unterscheidung zwischen Effekten, die durch die Streuqualität verursacht wurden, von Effekten, die durch Veränderungen in Umweltbedingungen hervortraten. Obwohl die Streuqualität signifikant durch die Zugabe von O3 und N verändert wurde und am Besten die Varianz in den Abbauraten vorhersagen konnte, waren die Behandlungseffekte auf die Abbaurate von Wurzeln schwach und für Blattstreu nicht vorhanden. Die Varianz im Abbau der Blattstreu konnte am präzisesten durch die Ca- Konzentration erklärt werden, dem einzigen Nährstoff, der durch die Zugabe von O3 und N nicht verändert wurde. Der Wurzelabbau korrelierte positiv mit P und K, deren Konzentrationen beide durch Zugabe von N verringert wurden, was zu einer verlangsamten Abbaurate von Wurzeln aus gedüngten Monolithen führte. Vermutlich hat die durch den N-Eintrag begünstigte Zunahme an Seggen, zu der schlechteren Streuqualität in gedüngten Monolithen geführt. O3 alleine zeigte keinen signifikanten Effekt auf den Abbau, kompensierte aber dem Anschein nach durch eine Erhöhung der K- Konzentration teilweise die negativen Effekte von N auf die Streuqualität. Dies resultierte in begasten Flächen in gleichschnellen Abbauraten, unabhängig von der Wurzelherkunft. Mikrobielle Biomasse wurde leicht durch die Interaktionswirkung von O3 und N erhöht, korrelierte jedoch nicht mit den Abbauraten. Trotz sehr moderater Effekte von O3 und N auf die frühe Phase des Streuabbaus, zeigt die starke Veränderung in der Streuqualität, die in späteren Abbauphasen an Bedeutung gewinnen könnte, dass Langzeituntersuchungen zum Streuabbau in alpinen Ökosystemen wichtig sind.
1 1. Introduction
Since the beginning of the industrial revolution, human activities have dramatically altered element cycles, with fundamental changes in the regulation of ecosystem processes (Chapin et al.
2002). Even ecosystems that are commonly far away from urban agglomerations and industrial emissions can be affected (Körner 2003), caused by the deposition of transboundary air pollutants (Bobbink 1998). Tropospheric ozone (O3), one of the most phytotoxic of the major air pollutants, is estimated to have increased by approximately 30% since the pre-industrial era, with some regions experiencing larger inputs than others (IPCC 2001, Vingarzan 2004). Time series of O3 measurements in Arosa, Switzerland, even indicate an approximate doubling of median O3 concentrations in the Alps from 1950 to 1990 (Staehelin et al. 1994).
An equivalent increase, parallel to industrial development, is reported for the trace nitrogen gases nitric oxide (NO), resulting mainly from fossil fuel combustion and ammonia (NH3), emitted by agricultural activities (Vitousek et al.
1997, Galloway et al. 2004). As a consequence, current rates of N deposition in Switzerland are around 5 kg N ha–1yr–1 in remote mountain areas, but reach up to 60 kg N ha–1yr–1 in regions with intensive livestock farming (Rihm and Kurz 2001).
To assess the impact of air pollutants on ecosystem function, a holistic view is needed, that requires the link of biochemical cycles (Gruber and Galloway 2008), including above- and belowground processes (Wardle et al. 2004).
Decomposition is an important process for the understanding of carbon (C) and N cycling, as it controls the quantity of available nutrients, the formation of humic substances stored in the soil and the amount of CO2 that is released to the atmosphere (Berg and McClaugherty 2003).
Therefore changes in decomposition rates that
could be caused by elevated deposition of O3 or N, could have significant and long-lived effects on soil nutrient and global C cycles. Apart from the fact that most C in grasslands is stored in the soil (Hall et al. 2000), belowground processes, especially those concerning the N and C cycling are not yet fully understood (Liu and Greaver 2010).
To address the impact of O3, N and their interaction on ecosystem properties and element cycles, a multiyear free-air fumigation system experiment was conducted on extensively managed grassland in the Swiss Alps (Bassin et al. 2007). So far, scientific findings include an enhanced above-ground productivity due to N- fertilization and accelerated leaf senescence as a reaction to O3 fumigation (Bassin et al. 2007).
Hypothetically, both changes would lead to a higher amount of litter input and a potential increase of the carbon stored in the soil.
However, whether the carbon balance is modified in this way by pollutant deposition depends on alterations in the decomposition process. The three main factors that regulate litter decomposition are the environment, litter quality and the decomposer community (Swift et al. 1979), whereas their relative importance varies between ecosystems (Sanderman and Amundson 2003). Effects of O3- and N- enrichment could thus occur by altering site conditions or via changes in the decomposing substrate. Environmental factors on a micro-site scale such as moisture, soil temperature and pH, are tightly linked to the abundance and activity of microbial biomass (Blume et al. 2010), which in turn might influence the decay rate of litter (Keeler et al. 2009). N-fertilization can affect microbes directly by a greater availability of soil N, as well as indirectly by changes in the plant species composition and subsequent changes in litter quality that reaches the soil (Bardgett et al.
1999). A review on N addition studies, including
2 grassland sites among others, reveals a decline in the microbial abundance by 15% on average (Treseder 2008). Unlike both pathways evident with N, O3 only acts on the vegetation and the soil surface, as it does not penetrate into the soil directly (Blum and Tingey 1977). Suppressing effects of O3 on the microbial biomass (Islam et al. 2000, Kanerva et al. 2008, Manninen et al.
2010), might therefore be caused by changes in litter quality and quantity and altered rhizodeposition (Andersen 2003). Whether N and O3 in combination would intensify their effect on the soil microbial biomass still needs to be investigated.
Regarding litter quality, decomposition is often negatively correlated to the substrate lignin concentration (Bontti et al. 2009) and the C: N ratio (Taylor et al. 1989, Rubatscher 2008), whereas high concentrations of N and P have been shown to accelerate decay rates (Moretto and Distel 2003, Liu et al. 2009). The traits crucial for decomposition rates of leaves or roots might vary in relation to the different environmental conditions above- and belowground (Ostertag and Hobbie 1999).
Numerous studies investigating the effect of N on decomposition revealed controversial results:
Knorr et al. (2005) conducted a meta-analysis in which he found the litter decay response to N ranging from a 38% inhibition to a 64%
stimulation. Inconsistencies were explained by differences in fertilization rate, site-specific ambient N deposition and litter quality. A low ambient N deposition in combination with high N-fertilization rates would stimulate the decomposition process, but only if the decomposing substrate is of “high quality” (i.e.
high nutrient and low lignin concentration). The latter can most likely be explained by an enhanced cellulase activity due to N addition accompanied by a decline in the lignin- degrading phenol oxidase (Carreiro et al. 2000).
An alteration in the concentration of nutrients in litter can either occur within plant species or indirectly by a shift in the vegetation composition (Berg and McClaugherty 2003).
Previous studies suggest that plants from productive sites contain higher concentrations of labile compounds and consequently decompose faster than species of less fertile sites (Hobbie and Vitousek 2000, Chapin et al. 2002).
Conversely in the “Alp Flix experiment” sedges over-proportionally increased with N addition, resulting in relatively fewer forbs (Bassin et al.
2007), which would rather suggest a lower litter decomposability (Cornelissen et al. 2007).
However, not only the litter’s quality, but also the relative quantity of leave and root turnover is essential to be addressed, as root mass loss has been demonstrated to be slower than leaf litter in some studies (Gorissen and Cotrufo 2000, Bontti et al. 2009), but faster in others (Ostertag and Hobbie 1999, Liu et al. 2009). Evidence indicating the potential for N to alter the shoot:
root ratio of subalpine plants (Wahl in preparation), highlights the need to account for this effect.
O3 has also been reported to change litter quality through a rise in foliar N concentration in cottonwood leaves that experienced early- abscise. This retarded their decomposition, though other changes in litter chemistry might have been responsible for this (Findlay and Jones 1990). Recent research conducted in wetland suggests that O3 effects on decomposition depend on plant functional traits, accelerating the decay rate of forbs, whereas graminoids remain unaffected (Williamson et al.
2010). However, previous findings on the study site did not include a change in the species composition due to fumigation, so indirect effects of O3 on litter quality can be excluded.
The majority of the few studies conducted on O3
effects on decomposition so far focussed on
3 forest trees or croplands, which emphasizes the need for similar research in grassland.
The inconsistent results of N manipulation studies on decomposition, accompanied by insufficient availability of O3 experiments and a lack of knowledge on the interaction of O3 and N on decomposition in general, raises the following question: (1) Will decomposition rates of leaf litter or roots of a subalpine pasture community be altered due to O3-fumigation and N-fertilization alone or in combination (2) and can potential changes be explained by litter quality (3) or the abundance of the microbial biomass?
Hypothetically, the increase in sedges would lower the litter quality in N-fertilized monoliths, with negative effects on above- and to a lesser extent belowground decomposition. O3 may affect litter quality less severe, but owing to results of Williamson et al. (2010) might slightly stimulate decomposition. In addition both O3
and N would possibly decrease the abundance of microbial biomass that would lead to a reduced capability for litter decomposition. As a theoretical consequence, the dominant effect of N on litter quality and changes in the environmental conditions would amplify each other to slow down the decomposition process.
To test these hypotheses, a litterbag study addressing leaf litter and root decomposition in a multi-treatment field experiment was conducted.
Grass monoliths of a subalpine pasture were exposed to elevated O3 and N deposition and litterbags were reciprocally transplanted between fertilized and control plots. This allowed differentiation between litter quality effects on decomposition and effects mediated by changes in environmental conditions. To verify observations, initial litter nutrient and lignin concentrations and soil microbial biomass C and N were assessed.
2. Materials and Methods 2.1 Study site
The study was part of a multi-treatment field experiment, established in 2003 by the “Air Pollution and Climate Group, Agroscope Research Station” at Alp Flix Sur, Switzerland (2000 m asl, N 9° 39’/E 46° 32’). Situated on a high plateau in the Central Alps, 100 metres below the climatic tree line, the climatic conditions are characterized by cold winters with permanent snow cover and a growing season from April to October. Average daily mean temperature during the growing season (2003–2008) was 8.8°C and mean April–
October precipitation (2003–2008) was 771 mm (Volk et al. 2011). The soil is a slightly acidic cambisol (pH 3.9–4.9) developed on serpentinic bedrock. Soil depth varies between 20 and 40 cm, but rooting depth is limited to a maximum of 20 cm (Bassin et al. 2007). The vegetation is a Geo-Montani-Nardetum that counts a total of more than 110 species. The most frequently occurring species are Festuca rubra, Nardus stricta and Carex sempervirens, which together cover approximately one-half of the study site.
The most frequently occurring forb species (Ranunculus villarsii, Leontondon helveticus, Ligusticum mutellina, Potentilla aurea, Arnica montana, and Gentiana acaulis) and a single legume species (Trifolium alpinum) each contribute approximately 2–3% to the total cover (Bassin et al. 2007). This vegetation community is typical for pastures (Ellenberg and Leuschner 2010) and arises from the previously low intensity management of cattle grazing. To replace grazing, plants were cut once a year 2 cm above the soil surface at peak canopy development (Volk et al. 2011).
4 2.2 Experimental design
The litterbag study was set up within the free-air fumigation system installed in spring 2004 on the Alp Flix, described precisely in Bassin et al.
(2007). It comprised 180 grass monoliths in drained plastic boxes (L x W x D = 30 x 40 x 20 cm) that were placed in groups of twenty in the centre of nine fumigation rings (Ø 7 m), that were aligned in a row on a ridge orientated east- west. Three levels of O3 fumigation (ambient (control), 1.2 x ambient, 1.6 x ambient) were randomly assigned to three rings each, making up one block. Mean O3 ambient concentrations during the growing season are approximately 45-47 ppb. For details of the O3 fumigation system see Volk et al. (2003). To simulate different levels of atmospheric N deposition, the monoliths were watered with 12 bi-weekly applications of ammonium nitrate dissolved in 200 mL of well water, equivalent to 0, 5, 10, 25, 50 kg N ha-1 yr-1. The site receives an estimated background deposition of ca. 4 kg N ha-1 yr-1 (Bassin et al. 2007).
For the decomposition experiment only the ambient (O3 ambient, N0) and the highest deposition levels (O3++, N50) were included, leaving six rings with six monoliths each. This enabled a higher replication and the ability to detect more easily small changes that might accumulate to significant effects in the long term.
2.3 Litterbag experiment
To separate litter quality effects on decomposition from effects mediated by environmental conditions, the litterbag study was set up in a reciprocal design. Half of the litterbags, containing identical litter mixture (N0 or N50), were incubated in the three fertilized and the other half in the three control monoliths within one ring. Plant material for litterbags
sampled in the two different N treatments (N0, N50) in each ring, was pooled separately for leaf litter and root material, providing 24 litter mixtures. Litter mixtures were analyzed for initial litter quality (lignin, C, N, phosphorus [P], potassium [K], calcium [Ca] and magnesium [Mg]). Six litterbags per mixture were filled, to place one per monolith within one ring. This added up to four litterbags (leaf litter N0/ N50, roots N0/ N50) allocated on every of the 36 selected monoliths and a total sum of 144 litterbags in the experiment (for the design of the litterbag study see Appendix Fig. A1).
To obtain a sufficient amount of coeval aboveground plant material, litter that had recently senesced, but was still connected to the plant was collected in August 2009 and in spring 2010 and mixed in a mass ratio of 2.5:1. Root material was sampled on 12th of May by taking two soil cores (0–10 cm, 6 cm diameter) per monolith. The holes were stuffed with a moist white fleece until the litterbags were returned.
Soil cores were divided, whereas one half was refrigerated to preserve for litterbag installation and the other part was sieved (2 mm mesh) to separate soil from roots. Roots were washed with deionised water and pooled unsorted within treatment, such that root material consisted of both fine and coarse roots. The methodical difference in sampling leaves that had already senesced, but living roots can be tolerated, as there is evidence that there is no nutrient resorption in roots before their die-back (Aerts et al. 1992, Ostertag and Hobbie 1999). Leaf litter and roots were cut into 2–5 mm long pieces, mixed thoroughly to ensure representativeness of the plant community and dried until constant mass was attained (60°C). Litterbags (6 cm x 7 cm) were constructed of nylon fabric with a mesh size of 100 µm (SEFAR PETEX 07- 100/32). The mesh size excludes meso- and makrofauna (Blume et al. 2010) and thus
5 allowed investigation of the microbial impact on litter decomposition. They were filled with 0.8 g oven dried leaf litter or root material and closed by sewing with polyester yarn.
Litterbags with root material were inserted vertically in the ground with the top edge just under the soil surface and covered with the preserved part of the soil core. The remaining gap was filled up with sterilised substrate composed of sand and soil originating from the site (1:1) and covered with the initial top of the soil core and litter from the surrounding monolith. This served as a “bed” for the leaf litterbags, which were then placed horizontally on the soil surface and secured with wire bows to prevent being blown away by wind.
Litterbags were installed on the 25th of March and harvested on the 24th of August. At the end of the field exposure litterbags were cleaned of adhering earth with a brush. Leaf litter and roots were removed from bags, oven-dried (60°C) and weighed. Litter mass loss (%) was expressed on the basis of initial dry mass.
2.4 Litter quality analysis
All analyses of leaf and root litter were conducted prior to field exposure of the litterbags and followed the reference methods of the Swiss Federal Agricultural Research Institutions. Altogether 24 litter mixtures, 12 each for leaf litter and root material, were dried (60°C) and ground to pass a 0.5 mm sieve.
Lignin concentration was determined by sequential extraction using the Van Soest acid detergent method (Van Soest 1963): Soluble compounds and hemicellulose are removed by successive treatments with neutral and acid dissolutions. This is followed by an extraction with cold 72% sulphuric acid (H2SO4) to remove cellulose, leaving lignin and related recalcitrant materials as the final fraction.
Concentrations of C and N in leaf litter and roots were assessed with an elemental analyzer (Modell Euro EA 3000, Euro Vector, Instruments & Software, Milano, Italy), K via emission and Ca and Mg by atomic absorption spectrometry (Spektrometer 1100B, Perkin Elmer, Schwerzenbach, Switzerland). Total P was analyzed photometrically using the Vanado- molybdenum-method (Model “Spekol 1100”, Analytik Jena AG, Jena, Germany).
2.5 Plant functional groups
To assess the proportion of plant functional groups on each monolith, plants were cut at 2 cm above the surface in the first week of August 2009 and 2010, separated into four functional groups (grasses, forbs, sedges and legumes), which were dried (60°C) and weighed (Bassin, unpublished data). Measurements of 2009 and 2010 were averaged to represent the litter mixtures that were incubated as well as the current development on the decomposition plots.
2.6 Microbial biomass and soil properties The soil of two cores (0–10 cm, 6 cm diameter) per monolith, taken three times during the growing season (13 May, 12 July, 30 August), was analyzed for microbial C (mg C kg-1 soil) and N (mg N kg-1 soil) by chloroform fumigation-extraction (Vance et.al 1987). This method is based on the comparison of extractable C and N by 0.5 mol K2SO4, between soil subsamples subjected to a 24h chloroform fumigation with unfumigated subsamples.
To examine important environmental effects between decomposition plots, soil water content (SWC) of each monolith was recorded using a Time Domain Reflectrometer (TRIME-EZ/-HD, Imko, Ettlingen, Germany) that was already installed in the monoliths. As measurements in
6 2010 were only taken after plants were cut in August, data for SWC of 2010 were averaged with the mean value of each monolith obtained during the whole growing season in 2007. Not the absolute SWC in the season, but the microclimatic differences between the monoliths were of importance. The pH value of each monolith was determined in CaCl2- suspension.
2.7 Statistical analysis
To test the treatment effects on decay rate, litter quality and microbial biomass, a linear mixed effect model (LME) from the NLME package for R (Pinheiro et al. 2010) was used. The advantage of the LME is that it handles spatial or temporal pseudoreplication like it occurs in split-plot experiments or when measurements are repeated temporally (Crawley 2007).
Treatment effects on litter mass loss were analyzed by fitting block, O3, N and litter origin as fixed factors, whereas ring was nested within the block and fitted as a random factor. SWC and pH were included as continuous covariables to estimate differences in soil environmental conditions between monoliths. The model was conducted in the same manner for the test of effects on litter quality, but litter origin and the covariables were omitted. For the determination of effects on microbial biomass on the three sampling dates a repeated measure LME was fitted with the fixed factors block, O3, N and time, including the covariables SWC and pH.
Inference on the significance of variables was done using likelihood ratio tests. Results were discussed as significant at P < 0.05 and considered as showing a trend at P < 0.1.
To test if litter chemistry predicts variability in litter decomposition, quality parameters (lignin, C, N, P, K, Mg, Ca) and ratios between them were correlated with litter mass loss, separately for leaf litter and roots. This was first
done by pooling decomposition plots and subsequently analysed per treatment to detect nutrient demands for decomposer communities in differing environments. Proportions of functional groups were correlated with litter quality and decay rates. To overcome problems of nonnormal distribution Spearman's rank correlation coefficients were used for all correlations. Furthermore regression analysis was used to determine whether the amount of soil microbial biomass C and N and litter mass loss were related. All statistical analyses were conducted in R 2.12.0 (R Development Core Team 2010).
3. Results 3.1 Decomposition
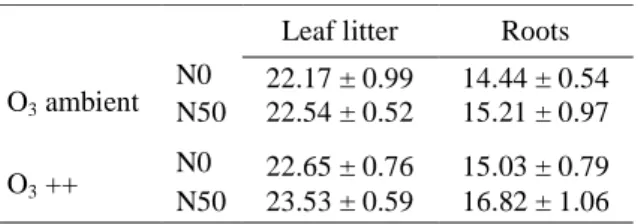
Litter mass loss after an incubation period of three months varied between 16.4 and 29.3% for leaf litter (median 22.8%) and between 7.1 and 23.5% for root material (median 15.4%). Effects of increased O3 and N deposition were stronger on root than on leaf litter decomposition, but were in general very modest (Table 1, Table 2).
Table 1 Leaf litter and root mass loss (%) in the four different treatment combinations of ambient nitrogen deposition (N0), nitrogen fertilized (N50), ambient ozone deposition (O3 ambient) and ozone fumigated (O3 ++).Values are means ± SE (n=18).
Leaf litter Roots
O3 ambient N0 22.17 ± 0.99 14.44 ± 0.54 N50 22.54 ± 0.52 15.21 ± 0.97 O3 ++ N0 22.65 ± 0.76 15.03 ± 0.79 N50 23.53 ± 0.59 16.82 ± 1.06
7
Nitrogen addition on decomposition plot (kg N ha-1 yr-1)
0 50
Litter mass loss (%)
0 5 10 15 20 25 30 35
Leaf litter N0 Leaf litter N50 Roots N0 Roots N50
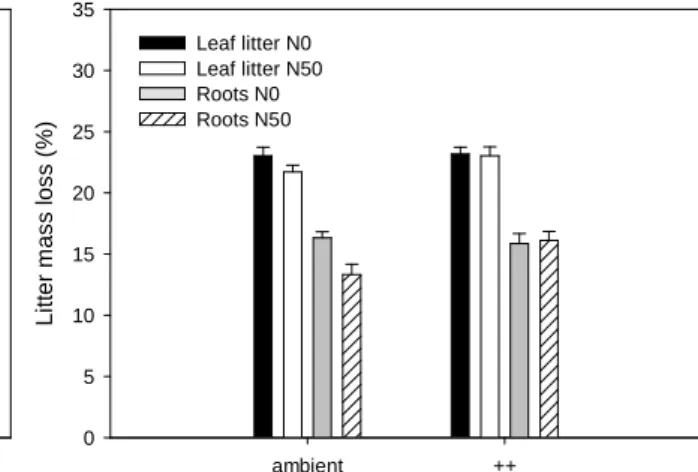
Fig. 1a Mass loss (%) of leaf litter and root material originating from N-fertilized (N50) and control plots (N0) introduced into plots subjected either to 0 or 50 kg N ha-1 y-1 addition.
Ozone level on decomposition plot
ambient ++
Litter mass loss (%)
0 5 10 15 20 25 30 35
Leaf litter N0 Leaf litter N50 Roots N0 Roots N50
Fig. 1b Mass loss (%) of leaf litter and root material originating from N-fertilized (N50) and control plots (N0) introduced into plots subjected either to ambient or increased O3 (O3++) concentrations.
Table 2 Effects of block, ozone (O3), nitrogen (N), litter origin and their interactions on leaf and root decomposition tested with a linear mixed effect model. Inference on the variables was done using likelihood ratio tests. The pH and soil water content (SWC) were treated as continuous covariables.
Leaf litter Roots
N d.f.
D d.f.
Likelihood ratio
P N
d.f.
D d.f.
Likelihood ratio
P
Block 2 2 2.70 0.259 2 2 1.19 0.550
O3 1 2 0.94 0.331 1 2 2.26 0.133
N 1 59 1.13 0.288 1 58 3.17 0.075
Litter origin 1 59 1.62 0.204 1 58 3.69 0.055
O3 x N 1 59 0.04 0.839 1 58 0.71 0.401
O3 x Litter origin 1 59 1.09 0.296 1 58 5.44 0.020
N x Litter origin 1 59 3.11 0.078 1 58 3.10 0.078
pH 1 59 1.20 0.274 1 58 0.09 0.764
SWC 1 59 0.01 0.924 1 58 0.09 0.761
Numerator (N d.f.) and denumerator degrees of freedom (D d.f.) are displayed. Significant effects (P < 0.05) and trends (P < 0.1) are indicated in bold.
8 The only significant effect observed for variation in decomposition rates, is the O3 x litter origin effect (P = 0.020, Table 2, Fig. 1b) seen for root material. This interaction describes a 22% faster decay for root material taken from unfertilized in comparison to roots from fertilized monoliths on plots with ambient O3
deposition, but an equal decomposition rate for root material on fumigated plots. In other words, changes in litter quality caused by increased N supply that would lead to different decomposition rates between roots from fertilized and unfertilized plots were compensated by O3 fumigation. When pooling decomposition plots, a trend was evident whereby the decay rate of root material taken from unfertilized monoliths was about 10%
higher (Litter origin (P = 0.055)) compared with roots that grew in the N-fertilized environment.
A consistent decay pattern was observed for leaf litter, but with results not even indicating a trend (~ 3%). A further trend for root decomposition (N (P = 0.075)), was the generally faster decay in N-fertilized monoliths, when litter was pooled on its origin. The interaction of O3 and N was
not significant, still decomposition of leaf litter and root material was 1.4% and 1.8% higher in monoliths that were exposed to O3 and N in comparison to the lowest decay rates in monoliths that received no additional treatment (Table 1). Fertilization lowered the substrates decomposability, but had a slight positive effect on the decomposition plot. This observation supports the trend, indicated by the N x litter origin effect (P = 0.078, Fig. 1a), in which decay of root from unfertilized monoliths was stimulated when incubated in fertilized decomposition plots. The only trend observed for variations in leaf litter decomposition was the N x litter origin effect (P = 0.078), which however resulted in a contrary decomposition pattern to that seen for root material.
Decomposition of leaf litter was highest in the monoliths of the litters’ origin in comparison to litter outwith their native monoliths. Variations in environmental factors between the decomposition plots, measured as SWC and pH had no influence on leaf litter or root decomposition, when tested as covariables.
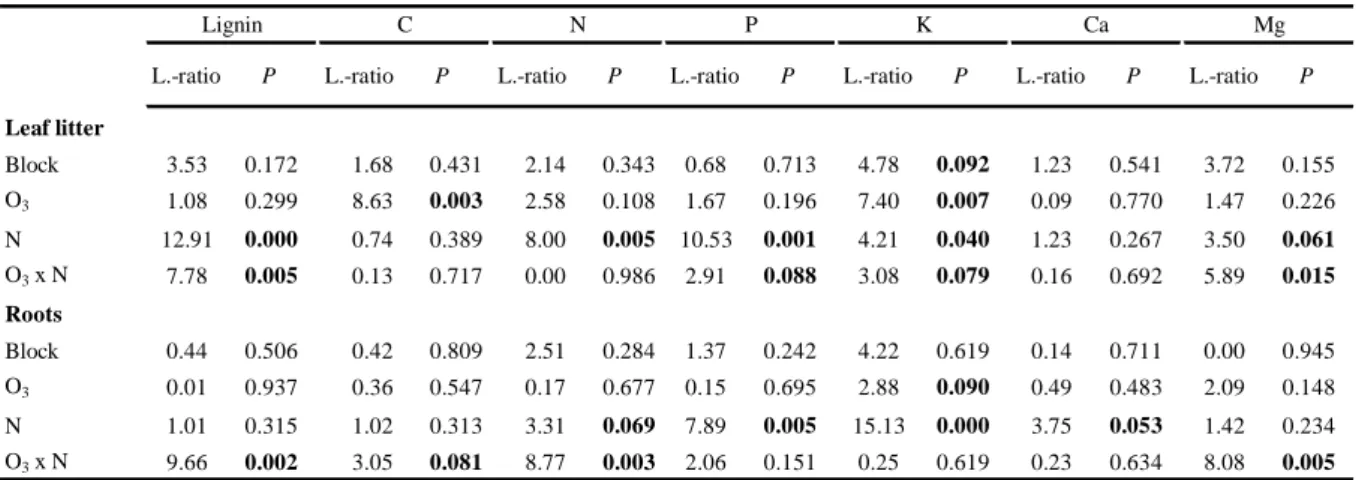
Table 3 Effects of block, ozone (O3), nitrogen (N) and the interaction of ozone and nitrogen (O3 x N) on leaf litter and root material on various litter quality parameters tested with a linear mixed effect model. Inference on the variables was done using likelihood ratio tests (L.-ratio = Likelihood ratio).
Significant effects (P < 0.05) and trends (P < 0.1) are indicated in bold.
L.-ratio P L.-ratio P L.-ratio P L.-ratio P L.-ratio P L.-ratio P L.-ratio P
Leaf litter
Block 3.53 0.172 1.68 0.431 2.14 0.343 0.68 0.713 4.78 0.092 1.23 0.541 3.72 0.155
O3 1.08 0.299 8.63 0.003 2.58 0.108 1.67 0.196 7.40 0.007 0.09 0.770 1.47 0.226
N 12.91 0.000 0.74 0.389 8.00 0.005 10.53 0.001 4.21 0.040 1.23 0.267 3.50 0.061
O3 x N 7.78 0.005 0.13 0.717 0.00 0.986 2.91 0.088 3.08 0.079 0.16 0.692 5.89 0.015 Roots
Block 0.44 0.506 0.42 0.809 2.51 0.284 1.37 0.242 4.22 0.619 0.14 0.711 0.00 0.945
O3 0.01 0.937 0.36 0.547 0.17 0.677 0.15 0.695 2.88 0.090 0.49 0.483 2.09 0.148
N 1.01 0.315 1.02 0.313 3.31 0.069 7.89 0.005 15.13 0.000 3.75 0.053 1.42 0.234
O3 x N 9.66 0.002 3.05 0.081 8.77 0.003 2.06 0.151 0.25 0.619 0.23 0.634 8.08 0.005
C Ca Mg
Lignin N P K
9
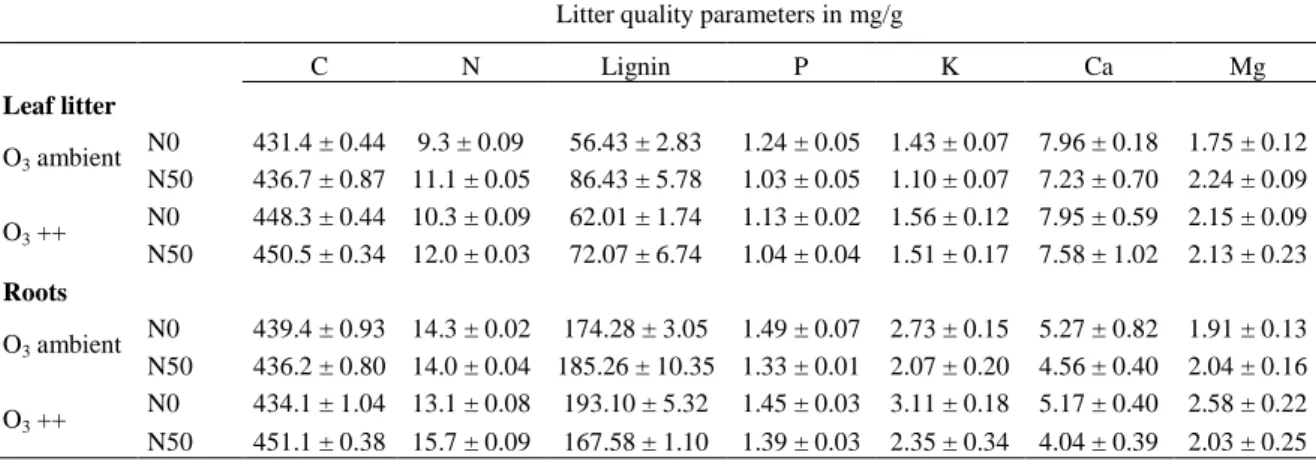
Table 4 Nutrient concentration in leaf litter and roots used as substrates for the litterbags. Treatments were ambient nitrogen deposition (N0), nitrogen fertilized (N50), ambient ozone deposition (O3 ambient) and ozone fumigated (O3 ++). Values are means with ± SE (n=3).
Litter quality parameters in mg/g
C N Lignin P K Ca Mg
Leaf litter
O3 ambient N0 431.4 ± 0.44 9.3 ± 0.09 56.43 ± 2.83 1.24 ± 0.05 1.43 ± 0.07 7.96 ± 0.18 1.75 ± 0.12 N50 436.7 ± 0.87 11.1 ± 0.05 86.43 ± 5.78 1.03 ± 0.05 1.10 ± 0.07 7.23 ± 0.70 2.24 ± 0.09 O3 ++ N0 448.3 ± 0.44 10.3 ± 0.09 62.01 ± 1.74 1.13 ± 0.02 1.56 ± 0.12 7.95 ± 0.59 2.15 ± 0.09 N50 450.5 ± 0.34 12.0 ± 0.03 72.07 ± 6.74 1.04 ± 0.04 1.51 ± 0.17 7.58 ± 1.02 2.13 ± 0.23 Roots
O3 ambient N0 439.4 ± 0.93 14.3 ± 0.02 174.28 ± 3.05 1.49 ± 0.07 2.73 ± 0.15 5.27 ± 0.82 1.91 ± 0.13 N50 436.2 ± 0.80 14.0 ± 0.04 185.26 ± 10.35 1.33 ± 0.01 2.07 ± 0.20 4.56 ± 0.40 2.04 ± 0.16 O3 ++ N0 434.1 ± 1.04 13.1 ± 0.08 193.10 ± 5.32 1.45 ± 0.03 3.11 ± 0.18 5.17 ± 0.40 2.58 ± 0.22 N50 451.1 ± 0.38 15.7 ± 0.09 167.58 ± 1.10 1.39 ± 0.03 2.35 ± 0.34 4.04 ± 0.39 2.03 ± 0.25
3.2 Litter quality
O3 and N either alone or in their interaction had strong impact on litter quality, by changing the proportions of all nutrients except of Ca significantly (Table 3). This resulted in clear differences in litter quality parameters between treatments (Table 4). N-fertilization increased the concentration of lignin and N in leaf litter (+34%, P < 0.0001; +18%, P = 0.005; compared to controls respectively), though it had no significant influence on the nutrient concentration of lignin and N in roots. Decreases in the concentration of P (leaf litter: -15%, P = 0.001; roots: -8%, P = 0.005) and K (leaf litter: - 14%, P = 0.040; roots: -32%, P < 0.0001) caused by N addition were similar for both leaf litter and roots. O3 had a positive effect on C (+4%, P = 0.003) and K (+21%, P = 0.007) in leaf litter, and a slightly positive, but not significant effect on the K concentration in root material (P = 0.090). The interaction of O3 and N deposition changed the nutrient concentrations
of lignin and Mg in both leaf litter (P = 0.005; P
= 0.015, respectively) and root material (P = 0.002; P = 0.005, respectively) and furthermore had a positive impact on the substrate N concentration in roots (P = 0.003), with the highest concentration in O3 fumigated plots that were combined with N-fertilization.
When the proportion of functional groups was related to the nutrient concentration in the litter mixtures, sedges showed noticeable impacts (Appendix Table A2). In leaf litter the proportion of sedges was positively correlated to the lignin concentration (rs= 0.69, P < 0.05, n = 12), but negatively correlated to P (rs = -0.74, P
< 0.01). Both nutrients, P (rs = -0.78, P < 0.01) and K (rs = -0.75, P < 0.01) in root material were negatively correlated to sedges. Although sedges and grasses were positively correlated (rs = 0.71, P < 0.05), grasses showed only an equivalent correlation for lignin in leaf litter (rs = 0.71, P <
0.05), but did not correlate to P or K. The proportion of forbs or legumes did not correlate with any of the litter nutrient concentrations.
10
Table 3 Spearman rank correlation coefficients between mass loss rates and initial litter quality parameters for leaf litter and roots. Correlations are shown for mass loss pooled on litter origin and subjected into both decomposition plots together (N0 + N50) and divided in decomposition plots of fertilized (N50) and control plots (N0). Sample sizes are 12 for all decomposition plots (N0 + N50) and 6 for N0, and N50 each.
Decomposition plot
Lignin (mg/g) P (mg/ g) K (mg/ g) Ca (mg/ g) Lignin : P Lignin : K C : N
Leaf litter
N0 + N50 -0.08 -0.01 0.43 0.62 * 0.02 -0.35 -0.08
N0 -0.13 0.02 0.41 0.77 ** -0.05 -0.44 -0.07
N50 0.11 -0.14 0.52 0.43 0.17 -0.23 -0.13
Roots
N0 + N50 -0.28 0.61 * 0.71 ** 0.21 -0.71 * -0.73 ** 0.01
N0 -0.64 * 0.17 0.34 -0.34 -0.55 -0.59 * -0.08
N50 0.08 0.81 ** 0.85 *** 0.57 -0.55 -0.82 ** 0.08
Significant correlations (P < 0.05) and trends (P < 0.1) are indicated in bold. *P < 0.05, **P < 0.01, ***P < 0.001
N0 N50
Ca (mg/ g)
0 5 10 15 20
Ca (mg/g)
5 6 7 8 9 10
Leaf litter mass loss (%)
18 20 22 24 26 28
N0 N50
N0 N50
K (mg/ g)
0 1 2 3 4 5 6 7
K (mg/g) 0.8 1.0 1.2 1.4 1.6 1.8
Leaf litter mass loss (%)
18 20 22 24 26
28 N0
N50
N0 N50
Lignin : P
0 50 100 150 200 250 300
Lignin : P 40 50 60 70 80 90 100
Leaf litter mass loss (%)
18 20 22 24 26
28 N0
N50
N0 N50
Ca (mg/g)
0 5 10 15 20
Ca (mg/ g)
3 4 5 6 7 8
Root mass loss (%)
10 12 14 16 18 20
N0 N50
N0 N50
K (mg/ g)
0 1 2 3 4 5 6 7
K (mg/ g) 1.6 2.0 2.4 2.8 3.2 3.6
Root mass loss (%)
10 12 14 16 18
20 N0
N50
N0 N50
Lignin : P
0 50 100 150 200 250 300
Lignin : P 110 120 130 140 150 160
Root mass loss (%)
10 12 14 16 18 20
N0 N50
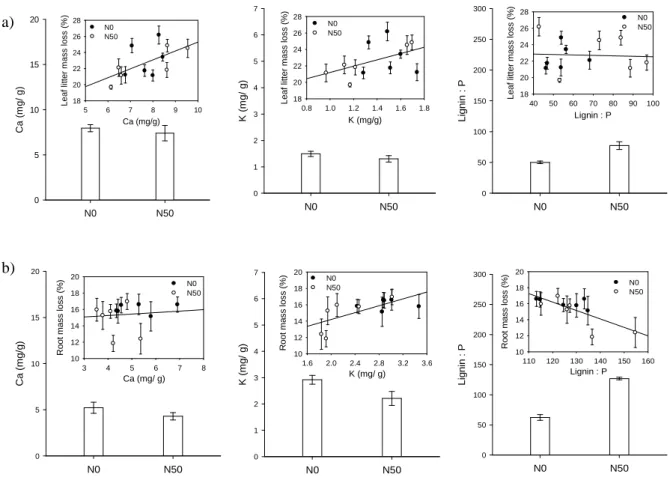
Fig. 2 Selection of data listed in Table 3, 4, and 5. Bar charts: a) Leaf litter and b) root quality responses to increased nitrogen (N50) in comparison to control monoliths (N0). Bars are means with ± SE (n = 6). Scatter plots: Correlation between litter quality (mg/g) and litter mass loss (%), black dots show unfertilized and white dots fertilized litter. Dots are means with ± SE (n = 6). For correlation coefficients and significance levels see Table 5.
a)
b)
11 3.3 Litter quality and decomposition
Considering litter mass loss regardless of it’s origin or treatment on decomposition plots, leaf litter was best explained by the substrate Ca concentration (rs = 0.62, P < 0.05, Table 5, Fig.
2a), while decomposition of root material was positively correlated to the K (rs = 0.71, P <
0.01, Fig. 2b) and P (rs = 0.61, P < 0.05) concentration and negatively correlated to the lignin: K (rs = -0.73, P < 0.01) and the lignin: P ratios (rs = -0.71, P < 0.05). Leaf or root C or N concentration or the C: N ratio could not explain
variations in decomposition rates. Influence of litter quality on litter mass loss varied according to the treatment of the decomposition plot. The correlation between Ca and decomposition rate of leaf litter was strong in unfertilized monoliths (rs = 0.77, P < 0.01), whereas it was of minor importance on fertilized plots. Nevertheless none of the litter quality parameters measured could significantly explain variation in decomposition rate of leaf litter on fertilized decomposition plots.
Sampling date Microbial biomass (mg C kg-1)
2400 2500 2600 2700 2800 2900 3000
N0 N50
13 May 12 July 30 August
O3 ambient O3++
13 May 12 July 30 August
Microbial biomass (mg N kg-1)
340 360 380 400 420 440 460
N0 N50
O3 ambient O3++
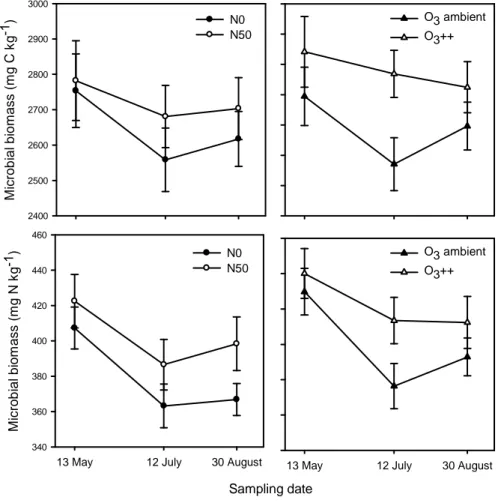
Fig. 3 Effects of increased nitrogen (N50) and ozone (O3++) on microbial biomass C (mg C kg-1 soil) and N (mg N kg-1 soil) on three sampling dates during the growing season. Data are pooled across treatments (n = 18), for significance levels see Table 6.
12
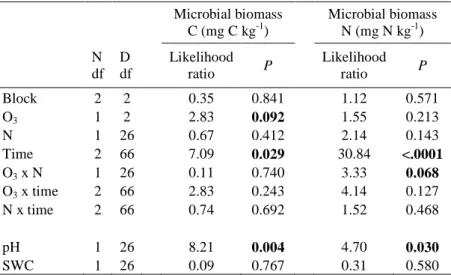
Table 4 Effects of block, ozone (O3), nitrogen (N), and time on microbial biomass C (mg C kg-1 soil) and microbial biomass N (mg N kg-1 soil) tested with a linear mixed effect model. Inference on the variables was done using likelihood ratio tests. PH and soil water content (SWC) were treated as continuous covariables.
Microbial biomass
C (mg C kg-1) Microbial biomass N (mg N kg-1)
N df
D
df Likelihood
ratio P Likelihood
ratio P
Block 2 2 0.35 0.841 1.12 0.571
O3 1 2 2.83 0.092 1.55 0.213
N 1 26 0.67 0.412 2.14 0.143
Time 2 66 7.09 0.029 30.84 <.0001
O3 x N 1 26 0.11 0.740 3.33 0.068
O3 x time 2 66 2.83 0.243 4.14 0.127
N x time 2 66 0.74 0.692 1.52 0.468
pH 1 26 8.21 0.004 4.70 0.030
SWC 1 26 0.09 0.767 0.31 0.580
Numerator (N d.f.) and denumerator degrees of freedom (D d.f.) are displayed.
Significant effects (P < 0.05) and trends (P < 0.1) are indicated in bold.
The most important nutrients observed for total root decomposition, K and P, only correlate to decomposition in fertilized monoliths (rs = 0.85, P < 0.001; rs = 0.81, P < 0.01, respectively), whereas decomposition in unfertilized monoliths was best described by the lignin concentration (rs = -0.64, P < 0.05).
3.4 Microbial biomass
Microbial biomass, measured three times during the growing season, showed a significant change in time with a low point in mid July (Microbial biomass C (P = 0.029); Microbial biomass N (P
< 0.0001), Table 6). This low point appeared at the same time as the lowest content of soil water during the summer (SWC = 15.3% on July 15th, Enderle in preparation). In spite of the relation of microbial biomass to changes in soil moisture during the season, differences in SWC (variation
of 35% to 58%) could not explain differences in the amount of microbial biomass between the monoliths. In contrast the pH value ranging between 3.9 and 4.9, was an important variable for explaining variations in microbial C (P = 0.004) and N (P = 0.030).
The combination of elevated O3 and N deposition tended to increase microbial biomass N by 12% (P = 0.068). Furthermore monoliths fumigated with O3 contained slightly higher amounts of microbial biomass C than untreated decomposition plots (~7% increase; P = 0.092;
Fig. 3). N or O3 alone neither altered significantly microbial biomass N (both ~6%
increase) nor did N affect microbial biomass C (~3% increase). There was no correlation between soil microbial biomass and decomposition of leaf litter or root material within a monolith.
13 4. Discussion
4.1 Decay rate aboveground vs.
belowground
The mean mass loss rates of 23% for leaf litter and 15% for roots found in this study are in the range of results reported for mass loss of grassland species after three month of litterbag incubation (Aerts et al. 2003, Moretto and Distel 2003), though studies conducted in subalpine or alpine grassland with a similar incubation period were not available for a direct comparison.
In this study, leaf litter decomposed significantly faster than roots, indicating the importance of the relative contribution of above- and belowground plant material to the litter pool.
This dissimilarity could be due to the radically different environment on the soil surface, with its large daily changes in temperature and moisture, in contrast to the consistent surrounding of the mineral soil (Chapin et al.
2002). The, in general better, litter quality of leaves might be another likely explanation that arises from experiments that report faster decay rates when incubating standard or aboveground litter belowground (Vivanco and Austin 2006, Bontti et al. 2009). However, in this study the nutrient concentrations of P, K and N, but also lignin were higher in roots than in leaf litter.
This was probably due to the relatively higher nutrient investment in roots of alpine plants in general (Körner 2003) or because root material was sampled in spring by the time of the highest nutrient allocation belowground. Thus the explanation of a better leaf litter quality would only hold for the lignin concentration, even though this was not a good predictor for mass loss in this study. Nevertheless, differences in above- and belowground decomposition rates underline the importance not to allow conclusions to be drawn from investigations of solely aboveground traits on whole ecosystem
processes. This especially has to be taken in consideration in alpine grassland ecosystems, where the majority of biomass is allocated belowground (Jackson et al. 1996, Fisk et al.
1998).
4.2 Treatment effects on litter quality
Results of litter quality measurements demonstrate a strong influence of N on nutrient composition of leaf litter and roots, which to a lesser extent also holds for O3 and the O3 x N interaction. This generally agrees with the assumption that N affects litter quality more severely than does O3, though the direction of single nutrient effects was hardly predictable. In contrast to other studies reporting an improved litter quality with N addition (Aerts 2009, Liu et al. 2010), the recalcitrant cell-wall component lignin in leaf litter increased and the concentrations of P and K in both leaf litter and roots decreased with fertilization, indicating a lower litter quality. Indeed, in line with common observations (Knops et al. 2007, Papanikolaou et al. 2010) the concentration of leaf litter N also increased, but this can be neglected, as it showed no correlation to decomposition patterns in this study. The inconsistent effects on litter quality in different studies due to N-fertilization may arise, because of the importance of the species composition for litter chemistry (Vivanco and Austin 2006, Cornwell et al. 2008). The shift in functional groups to a higher proportion of sedges that took place on fertilized plots after several years of increased N deposition, seem to be the reason for the observed nutrient change in leaf litter and roots. This is indicated by the positive correlation of the proportion of sedges to lignin in leaf litter and the negative correlation to P and K especially in roots.
Alterations in the chemical composition of plant species themselves due to increased N supply
14 seem to be of minor importance, compared to the predominant influence that a shift in the species composition can have on litter quality. In previous studies it has been observed that leaves and roots of graminoids generally decompose up to 2-3 times slower than forbs (Soudzilovskaia et al. 2007, Fornara et al. 2009). This coincides with the combination of a slower decay rate of root material and an increased proportion of graminoids in fertilized monoliths. Results emphasize that the species functional group composition in subalpine grassland can strongly influence belowground processes. Furthermore, observations may provide a predictive basis for potential changes in the decomposition process in mountain ecosystems, as sedges in alpine plant communities have often been shown to benefit from fertilization (Theodose and Bowman 1997, Soudzilovskaia and Onipchenko 2005).
As expected, effects of O3 on litter quality were in general weaker than that of N addition.
Fumigation did not lead to a shift in the species composition, which as discussed in the above section can be a principal cause for alterations in the litter quality. Still, small changes in leaf litter chemistry were detected. A potential effect of O3
is an alteration in the source-sink balance in plants, which leads to a carbon retention in shoots and a decreased carbon allocation belowground (Andersen 2003). This could be an explanation for the increased C concentration in leaf litter due to O3 fumigation, though the C concentration in roots did not significantly decrease. In addition O3 had a significant positive effect on the concentration of K in leaf litter and a trend also showed an increased K concentration in roots. This had no effect on leaf litter mass loss, but presumably led to the interaction of O3 and litter origin in root decomposition. Thus O3 partly compensated the negative effect of N fertilization on root quality.
4.3 Litter quality and decomposition
Consistent with common findings, litter quality was the best predictor for variations in decomposition rates of leaf litter and root material (e.g. Zhang et al. 2008). However, despite considerable changes in litter quality due to O3 and N addition, treatment effects on root decay appeared to be very slight and leaf litter decomposition was not significantly affected.
The combination of strong effects of N on litter quality, but not on decomposition has been demonstrated in earlier studies and might express the self-regulating effect that a plant community can have on internal nutrient cycling (Knops et al. 2007, Soudzilovskaia et al. 2007).
Substrate lignin and N concentrations have often been shown to be the best predictors for the determination of leaf litter or root mass loss (Melillo et al. 1982, Bontti et al. 2009), though this assumption is not universal (Aerts et al.
2003) and not applicable to this study. Referring to the “three stage model” of Berg and McClaugherty (2003) lignin is only a good predictor of mass loss in the second stage of decomposition which is reached with a LignocelluloseIndex (LCI) higher than 0.7-0.8 (Melillo et al. 1989). Comparing this value with the initial LCI of leaf litter (0.1–0.2) and roots (0.4–0.5) in combination with the short incubation period of the litterbags, might explain why lignin did not play a role in this stage of the experiment for leaf litter, but started to suppress the decomposition of root material. Because of large effects of N on the lignin concentration in litter, it can be expected that treatment effects on decomposition may occur more severely in the long term.
Why, contrary to expectations, effects of O3 and N were stronger on root than on leaf litter decomposition, will be discussed in the following section. Despite partly consistent changes in the litter chemistry, quality
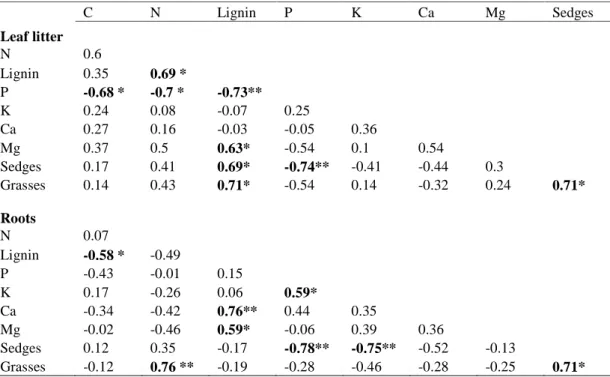
![Fig. A1 Reciprocal litterbag set up: 6 fumigation rings (3 with ambient ozone deposition and 3 ozone fumigated [O 3 ++]) with six monolith each (3 unfertilized [N0] and 3 fertilized [N50])](https://thumb-eu.123doks.com/thumbv2/1library_info/3947010.1534717/30.892.142.787.176.591/reciprocal-litterbag-fumigation-deposition-fumigated-monolith-unfertilized-fertilized.webp)
