Method development for scanning electrochemical microscopy and its application for material
characterization
Dissertation
Zur Erlangung des Doktorgrades der Naturwissenschaften (Dr. rer. nat.) der Fakultät für Chemie und Pharmazie
der Universität Regensburg
vorgelegt von Christian Iffelsberger
aus Münsing
14. Juni 2018
Die vorgelegte Dissertation entstand in der Zeit von Juni 2014 bis Juni 2018 am Institut für Analytische Chemie, Chemo- und Biosensorik der naturwissenschaftlichen Fakultät IV- Chemie und Pharmazie - der Universität Regensburg.
Die Arbeit wurde angeleitet von: Prof. Dr. Frank-Michael Matysik Das Promotionsgesuch wurde eingereicht am: 14. Juni 2018
Termin des Kolloquiums: 27. Juli 2018
Dem Prüfungsausschuss saß Prof. Dr. Arno Pfitzner vor. Erstgutachter war Prof. Dr. Frank-
Michael Matysik, Zweitgutachter war Assoc. Prof. RNDr. Vlastimil Vyskočil, Ph.D. und
Drittprüfer war PD Dr. Hans-Heiner Gorris.
Für meine Eltern
Ich danke allen Personen, die mich auf dem Weg zur Promotion begleitet und
unterstützt haben. Danke, für die stete Förderung und die vielen Diskussionen in
allen Lebenslagen!
I
List of content
List of content ... I List of publications ... IV Conference contributions ... VIII Declaration of collaborations ... XII List of abbreviations ... XIV
1. Introduction ... 1
2. Fundamentals ... 6
2.1 Electrochemical fundamentals ... 6
2.1.1 Electrochemical reaction ... 6
2.1.2 Current ... 6
2.1.3 Reaction rate ... 7
2.1.4 Diffusion layer ... 8
2.1.5 Mass transport ... 9
2.1.6 Diffusion limited electrochemical reaction ... 10
2.1.7 Electrochemical reaction with convection ... 12
2.2 Scanning electrochemical microscope ... 14
2.3 Ultramicroelectrode ... 15
2.4 Measuring modes ... 17
2.4.1 Feedback mode ... 17
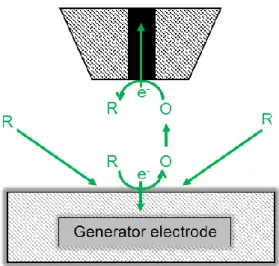
2.4.2 Substrate generation/tip collection mode ... 20
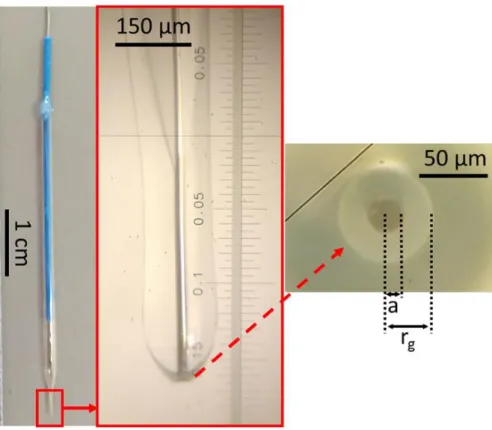
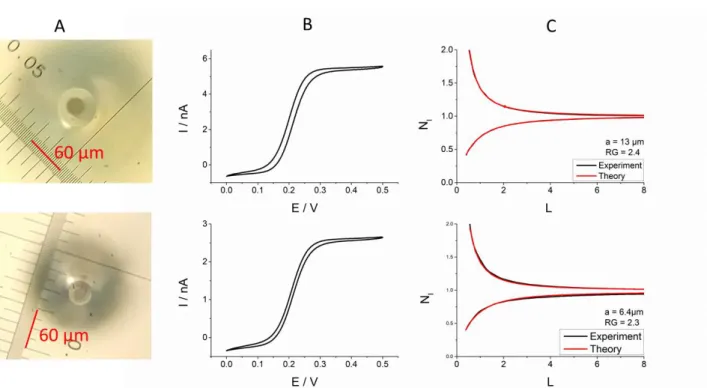
2.5 Probe characterization ... 21
3. Experimental ... 25
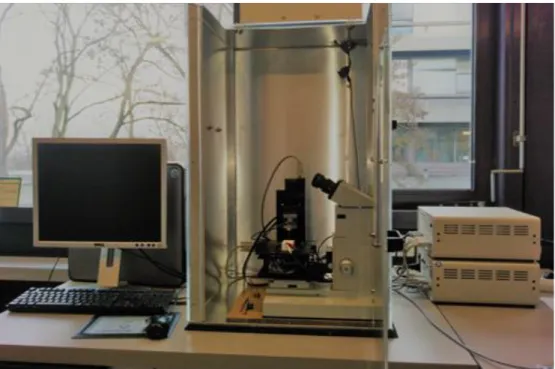
3.1 SECM Instrumentation ... 25
3.2 Ultramicroelectrode fabrication ... 26
3.2.1 Chemicals, materials & instrumentation ... 26
3.2.2 Fabrication of Pt ultramicroelectrodes ... 26
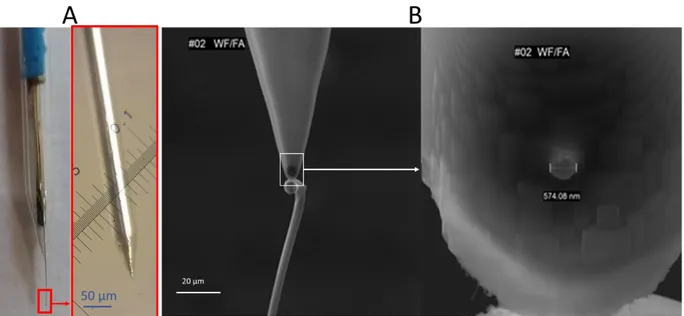
3.2.3 Fabrication of Wollaston-based Pt ultramicroelectrodes... 28
3.2.4 Ultramicroelectrode characterization ... 29
3.3 Substrate leveling and imaging ... 29
II
4. Results and discussion ... 31
4.1 Ultramicroelectrode characterization ... 31
4.1.1 Pt ultramicroelectrodes ... 31
4.1.2 Weight-force sealed etched Pt ultramicroelectrodes ... 32
4.1.3 Wollaston-based Pt ultramicroelectrodes ... 33
4.1.4 Conclusion ... 36
4.2 Scanning electrochemical microscopy with forced convection introduced by high- precision stirring ... 37
4.2.1 Introduction ... 38
4.2.2 Experimental ... 40
4.2.3 Results and discussion ... 44
4.2.4 Conclusion ... 52
4.3. Numerical simulation and characterization of the convection for hydrodynamic scanning electrochemical microscopy ... 56
4.3.1 Introduction ... 56
4.3.2 Computational Setup ... 56
4.3.3 Results and discussion ... 60
4.3.4 Conclusion ... 64
4.4 Detection and imaging of reactive oxygen species associated with the electrochemical oxygen evolution by hydrodynamic scanning electrochemical microscopy ... 66
4.4.1 Introduction ... 67
4.4.2 Experimental ... 69
4.4.3 Results and discussion ... 72
4.4.4 Conclusions ... 80
4.5 Imaging of localized enzymatic peroxidase activity over unbiased individual gold nanowires by scanning electrochemical microscopy ... 84
4.5.1 Introduction ... 85
4.5.2. Materials and Methods ... 87
4.5.3 Results and discussion ... 89
III
4.5.4 Conclusion ... 98
4.5.5 Supporting information ... 98
4.6 Complementary analytical imaging techniques for the characterization of pretreated carbon fiber reinforced plastics ... 102
4.6.1 Introduction ... 103
4.6.2 Experimental ... 105
4.6.3 Results and discussion ... 108
4.6.4 Conclusion ... 116
4.6.5 Supporting information ... 117
5. Summary ... 119
6. Zusammenfassung in deutscher Sprache ... 121
IV
List of publications
Peer reviewed articles
Imaging of localized enzymatic peroxidase activity over unbiased individual gold nanowires by scanning electrochemical microscopy
Preety Vatsyayan, Christian Iffelsberger, Carmen C. Mayorga-Martinez and Frank-Michael Matysik,
Analytical Methods 8 (2016) 6847-6855
Abstract
Scanning electrochemical microscopy (SECM) in constant-height mode was used to image individual gold nanowires (AuNWs, 2-3 µm long and ~140 nm diameter). High-resolution negative and positive feedback current images of individual AuNWs immobilized on glass and gold-coated glass slides, respectively were recorded with a Wollaston-based platinum disk ultramicroelectrode (UME) of radius 300 nm at 0.3 V probe potential using ferrocene methanol as mediator. The negative and positive feedback current responses were dependent on the effective recycling of mediator on the unbiased AuNWs.
Scanning electrochemical microscopy with forced convection introduced by high- precision stirring
Christian Iffelsberger, Preety Vatsyayan and Frank-Michael Matysik, Analytical Chemistry 89 (2017) 1658–1664
Abstract
In the present report the well-known advantages of hydrodynamic mass transport in
electrochemical systems are used in combination with scanning electrochemical microscopy
(SECM). The hydrodynamic SECM system integrates a high-precision stirring device into
the experimental setup. The well-defined stirring of the SECM electrolyte results in steady-
state diffusion layer characteristics in the vicinity of large substrate electrodes operated in
V
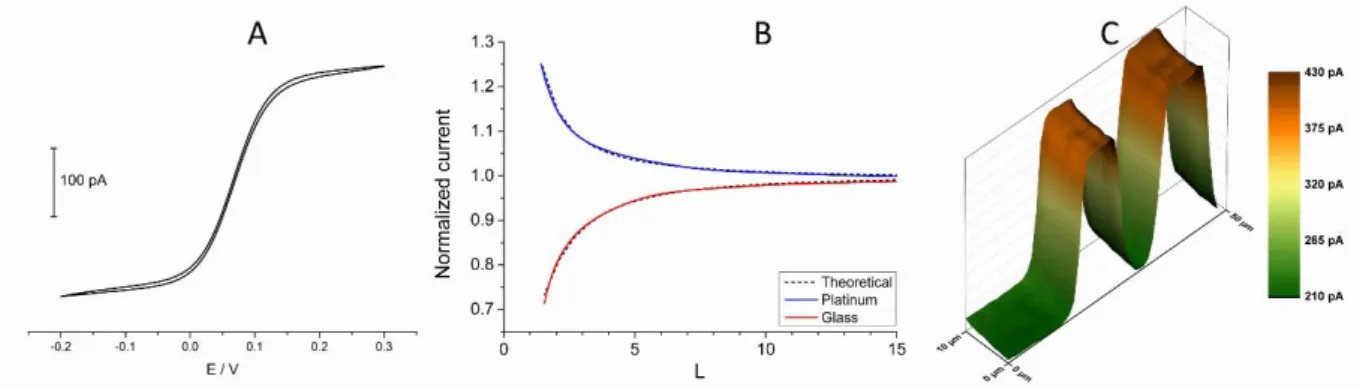
chronoamperometric measuring mode. For a range of rotation frequencies of a rotating cylinder the thickness and the stability of the diffusion layer was studied by hydrodynamic SECM in the substrate generation/tip collection (SG/TC) as well as in the competition mode using ferrocene methanol as redox mediator. Different UME probe dimensions ranging from Pt diameters of 20 µm down to 0.6 µm were used. The smallest probe with 0.6 µm electrode diameter was found most suitable for these studies due to the almost convection-independent amperometric response associated with sub-µm electrodes. Additionally, preliminary studies of hydrodynamic SECM imaging of a 2 mm Pt disk electrode surface in the SG/TC mode based on in-situ produced hydrogen as mediator are presented. Comparative images measured in the conventional positive feedback mode in quiescent solution show that hydrodynamic SECM offers attractive complementary information.
Development and characterization of electrochemical flow cells for hydrodynamic scanning electrochemical microscopy
Timo Raith, Stefan Wert, Christian Iffelsberger and Frank-Michael Matysik Accepted for publication.
Monatshefte für Chemie (Chemical Monthly).
Abstract
In the frame of the contribution, the effects of forced convection on scanning electrochemical microscopy (SECM) experiments are presented. The convection is generated by a flow of the mediator solution through electrochemical flow cells, developed especially for this purpose. A description of the mandatory design aspects of the experimental flow cell setups is included.
Using a macroscopic working electrode, the flow of the SECM electrolyte leads to the
formation of a stable diffusion layer during chronoamperometric measurements in contrast
to a growing diffusion layer in quiescent solution. To characterize the effects of the forced
convection, the diffusion layer around an inserted platinum substrate electrode was
investigated utilizing chronoamperometric measurements and hydrodynamic SECM
imaging. Mathematical simulations using COMSOL Multiphysics were computed in order
VI
to investigate the flow profile generated by the flowing mediator solution in the area of the substrate electrode. The flow profile predicted by the simulations was compared to probe line scans in feedback mode.
In summary, two different cell design prototypes of an electrochemical flow cell for SECM were developed and characterized. Both enable steady-state diffusion layer characteristics at a macroscopic working electrode offering interesting possibilities for future applications.
Detection and imaging of reactive oxygen species associated with the electrochemical oxygen evolution by hydrodynamic scanning electrochemical microscopy
Christian Iffelsberger, Timo Raith, Preety Vatsyayan, Vlastimil Vyskočil and Frank-Michael Matysik
Electrochimica Acta 281 (2018) 494-501
Abstract
Hydrodynamic scanning electrochemical microscopy (SECM) was applied for the characterization of Pt and boron-doped diamond (BDD) macroelectrodes operated in a potential region producing reactive oxygen species (ROS) during oxygen evolution reaction (OER). Forced convection introduced by high-precision stirring enabled the formation of a stable diffusion layer of electrochemically produced species and tip-substrate voltammetry was used for the detection of different ROS species produced during OER at BDD.
Hydrodynamic SECM imaging in substrate generation/tip collection mode revealed local differences in the production of the ROS species across the BDD electrode surface.
Complementary analytical imaging techniques for the characterization of pretreated carbon fiber reinforced plastics
Stefan Viehbeck, Christian Iffelsberger and Frank-Michael Matysik Composite Part A 113 (2018) 32–39
Abstract
In this work the complementary characterization of pretreatment techniques for adhesive
bonding of carbon fiber reinforced plastics (CFRP) is presented. Industrial CFRP plates were
VII
pretreated with laser, plasma and corundum blasting abrasive techniques followed by chemical activation. The combined use of atomic force microscopy and chemical force microscopy enabled the characterization of the surface morphology and the specific adhesion force between a chemically functionalized cantilever and the pretreated surfaces simulating the adhesive bond. Complementary measurements with scanning electrochemical microscopy and X-ray photoelectron spectroscopy supported the experimental findings and delivered additional information about the chemical structure of the surfaces. A comparison of experimental data of mechanical tensile shear strength measurements and the applied analytical methods revealed a valid correlation of microscopic and macroscopic techniques.
Non-Peer reviewed article
Trends in der elektrochemischen Rastermikroskopie
Christian Iffelsberger, Timo Raith, Patrick J. Hanekamp, Preety Vatsayayan und Frank-
Michael Matysik, chrom+food FORUM 4 (2017) 20-22
VIII
Conference contributions
Oral presentations
ANAKON 2017, 3.-6.4.2017, Tübingen
Scanning electrochemical microscopy with forced convection introduced by high-precision stirring
Christian Iffelsberger and Frank-Michael Matysik
In electroanalytical chemistry, the introduction of forced convection into the electrochemical system is a common and elegant way of enhancing the analytical performance. It gives a lot of advantages such as a quickly attained steady state, a greater current or a higher precision.
In the past, several techniques and methods for the convective mass transport were developed. These methods are often called hydrodynamic methods. [1]
Scanning electrochemical microscopic (SECM) measurements are usually performed in a static solution with the movement of the probe as the only origin for convection [2]. The absence of forced convection can be a serious limitation in several experimental studies, for example using the so-called substrate generation/tip collection (SG/TC) mode. The growing diffusion layer above a potentiostatically controlled large substrate electrode results in poor reproducibility of tip collection SECM measurements. In order to overcome this limitation, we added a high precision stirrer to the electrochemical cell to establish a steady- state diffusion layer and to control the thickness of the diffusion layer of the substrate electrode.
In this contribution, we present the home-built set up for the hydrodynamic SECM and its experimental characterization, especially in the context of the shape of the steady-state diffusion layers with respect to the rotation speed of the stirrer. The hydrodynamic characteristics within the electrochemical cell are verified by computer simulation. The application of this novel technique for imaging of reactive chemical species will be included.
Literature:
[1] A.J. Bard, L.R. Faulkner, Electrochemical methods: Fundamentals and applications, Vol.
2. Wiley, New York, 1980.
[2] A.J. Bard, M.V. Mirkin, Scanning electrochemical microscopy, 2nd edition, CRC Press
Boca Raton, 2012.
IX
Electrochemistry 2016, 26.-28.9.2016, Goslar, Germany Scanning electrochemical microscopy with forced convection Christian Iffelsberger and Frank-Michael Matysik
In electroanalytical chemistry, the introduction of forced convection into the electrochemical system is a common and elegant way for enhancing the analytical performance. It is associated with advantages such as considerably increased mass transport under steady-state conditions. In the past, several techniques and methods for convective mass transport were developed. These methods are often called hydrodynamic methods [1].
Scanning electrochemical microscopic (SECM) measurements are usually performed in a static solution with the movement of the probe as the only origin for convection [2]. The absence of forced convection can be a serious limitation in several experimental studies, for example using the so-called substrate generation/tip collection (SG/TC) mode. The growing diffusion layer above a potentiostatically controlled large substrate electrode results in poor reproducibility of tip collection SECM measurements. In order to overcome this limitation, we added a high precision stirrer to the electrochemical cell to establish a steady-state diffusion layer and to control the thickness of the diffusion layer of the substrate electrode.
In this contribution, we present the home-built set up for the hydrodynamic SECM and its characterization. Highly reproducible SECM experiments under forced convection will be shown using SG/TC or competition measuring modes.
Literature:
[1] A.J. Bard, L.R. Faulkner, Electrochemical methods: fundamentals and applications. Vol.
2. Wiley, New York, 1980.
[2] C. Combellas, M. Fermigier, A. Fuchs, F. Kanoufi, Scanning electrochemical
microscopy. Hydrodynamics generated by the motion of a scanning tip and its consequences
on the tip current, Anal. Chem., 2005, 77, 7966-7975.
X
10. Interdisziplinäres Doktorandenseminar, 28.2-1.3 2016, Berlin
Scanning electrochemical microscopy for the characterization of micro-structured electrode surfaces
Christian Iffelsberger, Preety Vatsyayan and Frank-Michael Matysik
Scanning electrochemical microscopy (SECM) is a scanning probe technique where an ultramicroelectrode (UME) is used as probe to image the morphology and the chemical activity of a substrate by scanning across its surface. The technique is attractive for the investigation of the heterogeneity of electrochemically active electrode surfaces. In order to image electrode surfaces with a spatial resolution in the sub-µm range the careful preparation of small probes with comparable dimensions is required [1].
In this work we present our results using SECM in constant height mode as tool for the characterization of different micro-structured electrodes, like interdigitated thin film electrodes and carbon film electrodes [2]. To understand the overall context, a short overview of SECM instrumentation and principles is included.
Literature:
[1] S. Bergner, P. Vatsayayan, F.-M. Matysik, Recent advances in high resolution scanning electrochemical microscopy of living cells–a review, Anal. Chim. Acta, 2013, 775, 1-13.
[2] V. Vyskočil, J. Barek, Voltammetric DNA biosensor based on a microcrystalline
natural graphite–polystyrene composite transducer, Procedia Chemistry, 2012, 6, 52–59.
XI
Poster presentations
11 th Biosensors & Bioanalytical Microtechniques in Environmental, Food & Clinical Analysis (BBMEC), 26.-30.9.2015, Regensburg, Germany
PbO 2 modified screen-printed titanium as a novel electrode material for bioanalytical studies Christian Iffelsberger, Marija Grundmann, Vlastimil Vyskočil and Frank-Michael Matysik
ANAKON 2015, 23.-26.3 2015, Graz, Austria
PbO 2 modified screen-printed titanium as a novel electrode material for bioanalytical studies Christian Iffelsberger, Marija Grundmann, Vlastimil Vyskočil and Frank-Michael Matysik
Electrochemistry 2014, 22-24.9 2014, Mainz, Germany
High-resolution scanning electrochemical microscopy for the characterization of electrode structures
Christian Iffelsberger and Frank-Michael Matysik
15th International Conference on Electroanalysis (ESEAC), 2014, 11–15.6.2014, Malmö, Sweden
High-resolution scanning electrochemical microscopy for the characterization of thin and thick film electrode materials
Christian Iffelsberger, Vlastimil Vyskočil, Jiri Barek and Frank-Michael Matysik
XII
Declaration of collaborations
Most of the theoretical and experimental works presented in this thesis were carried out solely by the author. Some of the results, however, were obtained in collaboration with other researchers and individuals. In accordance with § 8 Abs. 1 Satz 2 Punkt 7 of the Ordnung zum Erwerb des akademischen Grades eines Doktors der Naturwissenschaften (Dr. rer. nat.) an der Universität Regensburg vom 18. Juni 2009, this section details the nature of these collaborations. The following list describes these collaborations in the sequence of their appearance in this thesis.
4.1 UME characterization
Wollaston-based UMEs were fabricated and characterized in collaboration with Preety Vatsyayan. Focused ion beam milling, SEM imaging and PAC fitting was done in collaboration with Patrick J. Hanekamp. All other work steps of the UME fabrication and characterization was solely performed by the author.
4.2 Scanning Electrochemical Microscopy with Forced Convection Introduced by High-Precision Stirring
The experimental work was solely performed by the author. Preety Vatsyayan was involved with discussions. The work was done under supervision of Prof. Dr. Frank-Michael Matysik.
4.3. Numerical simulation and characterization of the convection for hydrodynamic scanning electrochemical microscopy
Numerical simulations were carried out solely by the author. Moritz Wetzel performed the electrochemical measurements under the guidance of the author.
4.4 Detection and imaging of reactive oxygen species associated with the electrochemical oxygen evolution by hydrodynamic scanning electrochemical microscopy
Timo Raith, Preety Vatsyayan and Vlastimil Vyskočil were involved with discussions and
with writing. The artwork was done in collaboration with Thomas Herl. Scanning electron
XIII
microscopy was performed in collaboration with Korbinian Pürckhauer. All other experimental work was solely performed by the author. The work was done under supervision of Prof. Dr. Frank-Michael Matysik.
4.5 Imaging of localized enzymatic peroxidase activity over unbiased individual gold nanowires by scanning electrochemical microscopy
The experimental work and writing were carried out in collaboration with Preety Vatsyayan.
Gold nanowires were synthesized and characterized by Carmen C. Mayorga-Martinez with support from Professor Merkoçi research group (Catalan Institute of Nanotechnology, Barcelona, Spain). The work was done under supervision of Prof. Dr. Frank-Michael Matysik.
4.6 Complementary analytical imaging techniques for the characterization of pretreated carbon fiber reinforced plastics
Experimental work including AFM, CFM, XPS, macroscopic tests and optical microscopy
was done in collaboration with Stefan Viehbeck. The measurements and experiments with
the SECM were done solely by the author. Stefan Viehbeck and the author contributed
equally towards the conception of the project, sample preparation and writing. The work was
done under supervision and guidance of Prof. Dr. Frank-Michael Matysik.
XIV
List of abbreviations
Abbreviation Meaning Value /unit
A Electrode area [m 2 ]
a Electrode radius [m]
a i Activity of species i AFM Atomic force microscopy AuNP Gold-nanoparticle
AuNW Gold-nanowire
BDD Boron-doped diamond
C Capacity [F]
CE Counter electrode
CFRP Carbon fiber reinforced plastic CFM Chemical force microscopy
c Concentration [mol L -1 = M]
CV Cyclic voltammetry
d Tip-to-substrate distance [m]
D Diffusions coefficient [cm 2 s -1 ]
DC Dual current
DNA Desoxyribonucleic acid
E Potential [V]
E 0 Standard potential [V]
E 0’ Formal standard potential [V]
e - Electron
e elementary charge [1.60218 ∙10 -19 C]
EDC N-(3-Dimethylaminopropyl)-N’
-ethylcarbodimide hydrochloride
E start Starting potential [V]
E vertex Vertex potential [V]
F Faraday constant [9.64853∙10 -4 C mol -1 ]
FcMeOH Ferrocene methanol (Hydroxymethylferrocene) FcMeOH + oxidized species of ferrocene methanol
FIB Focused ion beam
Fig. Figure
f rot Rotational speed [s -1 ]
F v Volume force vector [N]
HRP Horseradish peroxidase
I Current [A]
I M Measured current [A]
I ∞ Current measured in bulk phase [A]
i a) Index for certain species
XV b) Unit vector
I C Non-Faradaic current [A]
I D Mass transport limited current [A]
I F Faradaic current [A]
I l Diffusion limited current [A]
I L Limiting current [A]
ID Inner diameter [m]
J Flux [mol cm -2 s -1 ]
k a) Reaction rate [mol m -2 s -1 ]
b) Unit vector
k r Electrochemical reaction rate [mol s -1 ]
l Unit vector
L Normalized tip-to-substrate distance MPTES (3-mercaptopropyl)triethoxysilane
n Amount of substance [mol]
N Number of repetitions NHE Normal hydrogen electrode NHS N-hydroxysuccinimide
O oxidized species
N I Normalized feedback current
OD Outer diameter
OER Oxygen evolution reaction PAC Probe approach curve PEEK Polyether ether ketone PTFE Polytetrafluoroethylene
Q Charge [C]
R a) Universal gas constant [8.31447 J mol -1 K -1 ]
b) Resistance [Ω]
c) Reduced species RE Reference electrode
r g Radius of ultramicroelectrode tip [m]
RRDE Rotating ring disc electrode ROS Reactive oxygen species
SECM Scanning electrochemical microscope SECCM Scanning electrochemical cell microscope SEM Scanning electron microscope
SG/TC Substrate generation/tip collection mode SHE Standard hydrogen electrode
SPB Sodium phosphate buffer
T Temperature [K]
t Time [s]
TEM Transmissions electron microscopy
XVI TG/SC Tip generation/substrate collection
ToF-SIMS Time of flight-secondary ion mass spectrometry TSV Tip-substrate voltammetry
u Velocity vector [m s -1 ]
UME Ultramicroelectrode
WE Working electrode
XPS X-ray photoelectron spectroscopy
X, Y, Z Axis in three-dimensional Cartesian space
x, y, z Distances in three-dimensional Cartesian space [m]
z Stochiometric number
Correction function
δ Diffusion layer thickness [m]
μ a) Chemical potential
b) Dynamic viscosity [Pa s]
υ Flow velocity [m s -1 ]
υ A Velocity of the stirrer surface [m s -1 ]
Fluid density [kg m -3 ]
Electric potential [V]
1
1. Introduction
The scanning electrochemical microscope (SECM) was developed by Bard and coworkers in the late 80’s. It is a scanning probe technique where a small electrode is used as probe [1,2].
Since then it has evolved to a versatile and powerful electroanalytical tool [3]. Today SECM has many applications in biology, material science and for kinetic studies of chemical reactions [3–5]. It is used to generate images which provide analytical information on the topography of the scanned substrate and its local (electro)chemical reactivities with a high resolution in a noninvasive way [6]. It is also used to characterize and modify surfaces and to study interactions of chemical compounds [6–10]. The substrate in SECM is usually fixed in an electrochemical cell and immersed in an electrolyte solution. The diversity of these substrates ranges from organic to inorganic materials [11], living cells or liquid/liquid interfaces to just name a few examples [11–17]. Analogous to other scanning probe techniques the local resolution depends on the size of the probe and ranges from tens of µm to a few nm in SECM [18–20].
Even though amperometry [6] is the commonly used measuring technique, SECM can be operated with a number of different electroanalytical techniques, like voltammetry [21], potentiometry [22] or by the use of an alternating current [22–26]. The versatility of the SECM is however reflected in the number of different modes of operation developed with time [27–
31]. Some prominent examples of measuring modes are the feedback mode, the
generation/collection mode and the redox competition mode. The feedback mode is the most
common mode and is used for imaging the topography and electrochemical activity of the
substrate [32]. The generation/collection mode includes a variety of experiments in which the
signal mediating chemical species is generated in-situ at the substrate or the tip and respectively
collected at the tip or the substrate at a diffusion-limited rate [33]. In the redox competition
mode, the tip and the substrate compete for the same mediator species. This mode is used to
study corrosion and the catalytic activity of a surface. In addition to recent developments in
operational modes, continuous instrumental developments including novel probes, substrate
holders, the precise control of environmental parameters like temperature or the surrounding
atmosphere led to increased possible applications of the SECM [10,34–37]. The combination
of the SECM with other techniques like atomic force microscopy (AFM), scanning ion
2
conductance microscopy, optical and fluorescence microscopy etc. increased the amount of accessible information obtained with SECM [38–45].
The priority of this work was the application of the SECM for studies involving the formation of highly reactive and unstable chemical species produced alongside the electrochemical solvent combustion at substrate electrodes of diameters greater than or equal to 2 mm. As a model system, the generation of reactive oxygen species (ROS) during the electrochemical oxygen evolution reaction (OER) in the substrate generation/tip collection mode was chosen.
Preliminary studies identified the application of hydrodynamics as the most promising strategy to overcome the limitation of a transient signal caused by diffusion during imaging in the generation/collection mode. The application of forced convection to generate hydrodynamics in SECM required the construction of suitable experimental equipment in collaboration with the mechanical, electrical and glassware workshops of the University of Regensburg. The integration of these additional units into the present setup of SECM as well as the characterization of the effects of forced convection on the different measurement modes were an important part of this work. The progress of the project required a detailed characterization of the hydrodynamic conditions within the electrochemical cell with numerical simulations performed with COMSOL Multiphysics. The modified SECM was later used to study the evolution of ROS at macroscopic Pt and boron-doped diamond electrodes during OER. The classical application of the SECM to image and characterize novel materials was a second fundamental aspect which was also addressed in this work. For all objectives of this work the fabrication of high-quality ultramicroelectrodes was a prerequisite, thus a detailed account of the same is also included.
References
[1] J. Kwak, A.J. Bard, Scanning electrochemical microscopy. Apparatus and two- dimensional scans of conductive and insulating substrates, Anal. Chem. 61 (1989) 1794–
1799.
[2] A.J. Bard, F.R. Fan, D.T. Pierce, P.R. Unwin, D.O. Wipf, F. Zhou, Chemical imaging of surfaces with the scanning electrochemical microscope., Science 254 (1991) 68–74.
[3] M.V. Mirkin, W. Nogala, J. Velmurugan, Y. Wang, Scanning electrochemical microscopy in the 21st century. Update 1: Five years after, Phys. Chem. Chem. Phys. 13 (2011) 21196–212.
[4] D. Polcari, P. Dauphin-Ducharme, J. Mauzeroll, Scanning electrochemical microscopy:
A comprehensive review of experimental parameters from 1989 to 2015, Chem. Rev.
3 116 (2016) 13234–13278.
[5] S. Bergner, P. Vatsyayan, F.-M. Matysik, Recent advances in high resolution scanning electrochemical microscopy of living cells-a review, Anal. Chim. Acta 775 (2013) 1–13.
[6] A.J. Bard, M.V. Mirkin, Scanning electrochemical microscopy, 2nd edition,CRC Press, Boca Raton, 2012.
[7] T.J. Stockmann, J.-M. Noël, S. Ristori, C. Combellas, A. Abou-Hassan, F. Rossi, F.
Kanoufi, Scanning electrochemical microscopy of Belousov–Zhabotinsky reaction: How confined oscillations reveal short lived radicals and auto-catalytic species, Anal. Chem.
87 (2015) 9621–9630.
[8] A. Fiorani, S. Rapino, G. Fioravanti, G. Valenti, M. Marcaccio, F. Paolucci, Local desorption of thiols by scanning electrochemical microscopy: patterning and tuning the reactivity of self-assembled monolayers, J. Solid State Electrochem. 20 (2016) 1037–
1042.
[9] D. Zhan, L. Han, J. Zhang, Q. He, Z.-W. Tian, Z. Tian, Electrochemical micro/nano- machining: principles and practices, Chem. Soc. Rev. 46 (2017) 1526–1544.
[10] M. Zhou, Y. Yu, P. Blanchard, M.V. Mirkin, Surface patterning using diazonium ink filled nanopipette, Anal. Chem. 87 (2015) 10956–10962.
[11] S. Bergner, P. Palatzky, J. Wegener, F.-M. Matysik, High-resolution imaging of nanostructured Si/SiO 2 substrates and cell monolayers using scanning electrochemical microscopy, Electroanalysis 23 (2011) 196–200.
[12] E.R. Scott, H.S. White, J.B. Phipps, Scanning electrochemical microscopy of a porous membrane, J. Memb. Sci. 58 (1991) 71–87.
[13] S. Bergner, J. Wegener, F.-M. Matysik, Monitoring passive transport of redox mediators across a confluent cell monolayer with single-cell resolution by means of scanning electrochemical microscopy, Anal. Methods 4 (2012) 623–629.
[14] S. Bergner, J. Wegener, F.-M. Matysik, Simultaneous imaging and chemical attack of a single living cell within a confluent cell monolayer by means of scanning electrochemical microscopy, Anal. Chem. 83 (2011) 169–174.
[15] C. Wei, A.J. Bard, M.V. Mirkin, Scanning electrochemical microscopy. 31. Application of SECM to the study of charge transfer processes at the liquid/liquid interface, J. Phys.
Chem. 99 (1995) 16033–16042.
[16] Y. Shao, M.V. Mirkin, Probing ion transfer at the liquid/liquid interface by scanning electrochemical microscopy (SECM), J. Phys. Chem. B. 102 (1998) 9915–9921.
[17] J.-M. Noël, Y. Yu, M.V. Mirkin, Dissolution of Pt at moderately negative potentials during oxygen reduction in water and organic media, Langmuir 29 (2013) 1346–1350.
[18] Y. Yu, Y. Gao, K. Hu, P.Y. Blanchard, J.M. Noël, T. Nareshkumar, K.L. Phani, G.
Friedman, Y. Gogotsi, M.V. Mirkin, Electrochemistry and electrocatalysis at single gold nanoparticles attached to carbon nanoelectrodes, ChemElectroChem. 2 (2015) 58–63.
[19] M.A. Mezour, R. Cornut, E.M. Hussien, M. Morin, J. Mauzeroll, Detection of hydrogen peroxide produced during the oxygen reduction reaction at self-assembled thiol- porphyrin monolayers on gold using SECM and nanoelectrodes, Langmuir 26 (2010) 13000–13006.
[20] T. Sun, Y. Yu, B.J. Zacher, M.V. Mirkin, Scanning electrochemical microscopy of individual catalytic nanoparticles, Angew. Chem. Int. Ed. 53 (2014) 14120–14123.
[21] J.A. Koch, M.B. Baur, E.L. Woodall, J.E. Baur, Alternating current scanning electrochemical microscopy with simultaneous fast-scan cyclic voltammetry, Anal.
Chem. 84 (2012) 9537–9543.
[22] A. Kiss, G. Nagy, New SECM scanning algorithms for improved potentiometric imaging
4
of circularly symmetric targets, Electrochim. Acta 119 (2014) 169–174.
[23] K. Eckhard, W. Schuhmann, Alternating current techniques in scanning electrochemical microscopy (AC-SECM), Analyst 133 (2008) 1486–97.
[24] D. Trinh, M. Keddam, X.R. Novoa, V. Vivier, Alternating-current measurements in scanning electrochemical microscopy, part 1: Principle and theory, ChemPhysChem. 12 (2011) 2169–2176.
[25] D. Filotás, B.M. Fernández-pérez, J. Izquierdo, A. Kiss, L. Nagy, G. Nagy, Improved potentiometric SECM imaging of galvanic corrosion reactions, Corros. Sci. 129 (2017) 136-145.
[26] D. Filotás, B.M. Fernández-Pérez, A. Kiss, L. Nagy, G. Nagy, R.M. Souto, Double barrel microelectrode assembly to prevent electrical field effects in potentiometric SECM imaging of galvanic corrosion processes, J. Electrochem. Soc. 165 (2018) C270–C277.
[27] K. Eckhard, X. Chen, F. Turcu, W. Schuhmann, Redox competition mode of scanning electrochemical microscopy (RC-SECM) for visualisation of local catalytic activity, Phys. Chem. Chem. Phys. 8 (2006) 5359–5365.
[28] C.M. Sánchez-Sánchez, J. Rodríguez-López, A.J. Bard, Quantitative calibration of the SECM substrate generation/tip collection mode and its use for the study of the oxygen reduction mechanism, Anal. Chem. 80 (2008) 3254–3260.
[29] J. Rodríguez-López, M.A. Alpuche-Avilés, A.J. Bard, Interrogation of surfaces for the quantification of adsorbed species on electrodes: Oxygen on gold and platinum in neutral media, J. Am. Chem. Soc. 130 (2008) 16985–16995.
[30] L. Stratmann, J. Clausmeyer, W. Schuhmann, Non-destructive patterning of carbon electrodes by using the direct mode of scanning electrochemical microscopy, ChemPhysChem. 16 (2015) 3477–3482.
[31] T. Sun, D. Wang, M.V. Mirkin, Tunneling mode of scanning electrochemical microscopy (SECM): Probing electrochemical processes at single nanoparticles, Angew.
Chem. Int. Ed. 57 (2018) 7463–7467.
[32] J. Kwak, A.J. Bard, Scanning electrochemical microscopy. Theory of the feedback mode, Anal. Chem. 61 (1989) 1221–1227.
[33] R.D. Martin, P.R. Unwin, Theory and experiment for the substrate generation tip collection mode of the scanning electrochemical microscope: Application as an approach for measuring the diffusion coefficient ratio of a redox couple, Anal. Chem. 70 (1998) 276–284.
[34] J. Clausmeyer, D. Schäfer, M. Nebel, W. Schuhmann, Temperature-induced modulation of the sample position in scanning electrochemical microscopy, ChemElectroChem. 2 (2015) 946–948.
[35] P. Hanekamp, W. Robl, F.-M. Matysik, Development and application of a multipurpose electrodeposition cell configuration for studying plating processes on wafer specimen and for characterizing surface films by scanning electrochemical microscopy, J. Appl.
Electrochem. 47 (2017) 1305–1312.
[36] W. Nogala, K. Szot, M. Burchardt, F. Roelfs, J. Rogalski, M. Opallo, G. Wittstock, Feedback mode SECM study of laccase and bilirubin oxidase immobilised in a sol–gel processed silicate film, Analyst 135 (2010) 2051–2058.
[37] D. Momotenko, F. Cortes-Salazar, A. Lesch, G. Wittstock, H.H. Girault, Microfluidic push-pull probe for scanning electrochemical microscopy, Anal. Chem. 83 (2011) 5275–
5282.
[38] Y. Takahashi, H. Shiku, T. Murata, T. Yasukawa, T. Matsue, Transfected single-cell
imaging by scanning electrochemical optical microscopy with shear force feedback
5 regulation, Anal. Chem. 81 (2009) 9674–9681.
[39] S. Szunerits, S.E. Pust, G. Wittstock, Multidimensional electrochemical imaging in materials science, Anal. Bioanal. Chem. 389 (2007) 1103–1120.
[40] C. Kranz, Recent advancements in nanoelectrodes and nanopipettes used in combined scanning electrochemical microscopy techniques, Analyst 139 (2014) 336–352.
[41] J. Velmurugan, A. Agrawal, S. An, E. Choudhary, V.A. Szalai, Fabrication of scanning electrochemical microscopy - atomic force microscopy probes to image surface topography and reactivity at the nanoscale, Anal. Chem. 89 (2017) 2687–2691.
[42] R. Hao, B. Zhang, Nanopipette-based electroplated nanoelectrodes, Anal. Chem. 88 (2016) 614–620.
[43] M. Şen, Y. Takahashi, Y. Matsumae, Y. Horiguchi, A. Kumatani, K. Ino, H. Shiku, T.
Matsue, Improving the electrochemical imaging sensitivity of scanning electrochemical microscopy-scanning ion conductance microscopy by using electrochemical Pt deposition, Anal. Chem. 87 (2015) 3484–3489.
[44] P. Knittel, M.J. Higgins, C. Kranz, Nanoscopic polypyrrole AFM–SECM probes enabling force measurements under potential control, Nanoscale 6 (2014) 2255.
[45] H.V. Patten, S.C.S. Lai, J.V. MacPherson, P.R. Unwin, Active sites for outer-sphere,
inner-sphere, and complex multistage electrochemical reactions at polycrystalline boron-
doped diamond electrodes (pBDD) revealed with scanning electrochemical cell
microscopy (SECCM), Anal. Chem. 84 (2012) 5427–5432.
6
2. Fundamentals
2.1 Electrochemical fundamentals
2.1.1 Electrochemical reaction
An electrochemical reaction can be described as a transfer of n numbers of electrons (e - ) between two chemical species. The reaction is located at the electrode/electrolyte interface and can be written as eq. 1. [1]
O + n ∙ e − ⇌ R (1)
The electron accepting species (O) gets reduced and the electron donating species (R) gets oxidized during the electrochemical reaction. The Nernst equation (eq. 2), delivers the relation of the potential E [V] of the O/R-system and the standard electrode potential E 0 as a function of the activities of oxidized species a Ox and the reduced species a Red . The standard electrode potential of an electrochemical reaction refers to the standard hydrogen electrode (SHE).
𝐸 = 𝐸 0 + 𝑅𝑇
𝑧𝐹 𝑙𝑛 𝑎
𝑂𝑎
𝑅(2)
R is the ideal gas constant (R= 8.3145 J mol -1 K -1 ), T is temperature [K], z is the stochiometric number of transferred electrons and F is the Faraday Constant. The Faraday constant gives the charge of one mole (N a ) elementary charges (e).
𝐹 = 𝑒 ∙ 𝑁 𝑎 = 96485.3 𝐶
𝑚𝑜𝑙 (3)
Since the activities of the considered species are often unknown, a formal standard potential E 0’
was introduced to use the bulk concentrations of the oxidized [O] and reduced species [R]
instead of the activities. [1–3]
𝐸 = 𝐸 0’ + 𝑅𝑇
𝑧𝐹 𝑙𝑛 [𝑂]
[𝑅] (4)
2.1.2 Current
The current I [A] is defined as change in charge Q [C] per time t [s].
𝐼 = 𝑑𝑄
𝑑𝑡 (5)
At an electrode, two types of processes contribute to I measured in an electrochemical cell.
They are faradaic (I F ) and non-faradaic processes (I C ). The total measured current is the sum of both.
𝐼 = 𝐼 𝐹 + 𝐼 𝑐 (6)
7
Faradaic processes are charge transfer processes governed by Faraday’s law which correlates the charge passed through the electrochemical cell, to the amount of product n [mol] and the number of electrons transferred per reaction (z) during a chemical reaction.
𝑄 = 𝑛𝐹𝑧 (7)
Non-faradaic processes summarize all processes that occur at the electrode excluding chemical reactions. Such processes follow Ohm’s law however adsorption and desorption can occur, and the structure of the electrode/electrolyte interface, the so-called double layer, can change with changing potential or solution composition. The charging of the double layer can be described as charging of a capacitator with a capacity C dl [F] and the conversion of a substance as Faraday- impedance Z f. Fig. 2.1 shows the equivalent circuit diagram of a schematic electrochemical cell.
Figure 2.1: Schematic representation of the electrochemical cell (A) and the equivalent circuit diagram (B). R s represents the ohmic resistance of the solution, Z f the substance conversion as faraday-impedance and C dl the capacitance of the electrode/electrolyte interface. Adapted from [1].
The resulting charging current I c for a potential step at an electrode is transient with time and is described by eq. 8 where E is the applied potential, R s [] the ohmic resistance of the solution, t the time and C dl the capacity of the electrode/electrolyte interface. [1,3]
𝐼 𝑐 = 𝐸
𝑅
𝑠𝑒 −
𝑡
𝑅𝑠𝐶𝑑𝑙
(8)
2.1.3 Reaction rate
A homogenous reaction occurs everywhere within the medium at a uniform rate k [mol m -2 s -1 ]
given by the change of the amount of substance per time.
8 𝑘 = 𝑑𝑛
𝑑𝑡 (9)
In contrast to a homogenous reaction, the electrochemical reaction is a heterogenous reaction located at the electrode surface with a finite surface area (A [m 2 ]). According to Faraday’s law, the reaction rate of an electrochemical reaction k r [mol s -1 ] can be written as
𝑘 𝑟 = 𝑑𝑛
𝑑𝑡𝐴 = 𝐼
𝑧𝐹𝐴 (10)
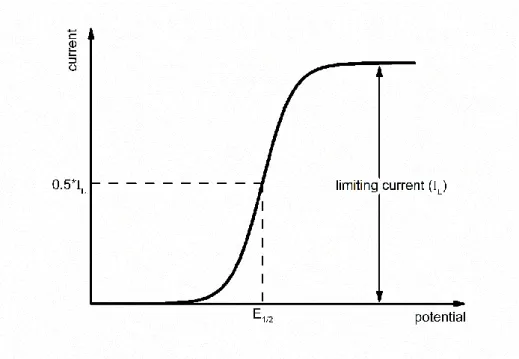
The potential-current curve for a Nernstian reaction (Fig. 2.2) shows the relationship between an applied potential and the reaction rate. Initially only the oxidant is present in solution. With increasing potential, the reaction starts until a complete conversion of the oxidant occurs and a limiting current I L can be measured.
Figure 2.2: Current-potential curve for a Nernstian reaction with only one reactant present initially in solution. Adapted from [1].
The half-wave potential E 1/2 is independent of the concentration of the reactants and is characteristic for the specific O/R-system.[1,3]
2.1.4 Diffusion layer
As a consequence of an electrochemical reaction the concentration of the reactant changes at the electrode/electrolyte interface and forms a concentration gradient.
𝑑𝑐
𝑖𝑑𝑥 = (𝑐
𝑖∗
−𝑐
𝑖(𝑥=0))
𝑑𝑥 (11)
9
The difference of the concentration (dc i ) between the concentration in bulk solution (𝑐 𝑖 ∗ [mol l -1 = M]) and the concentration at the electrode surface c i (x=0) reaches a certain distance (dx) into the bulk solution and forms a diffusion layer. The diffusion layer thickness depends on the time scale of the experiment as shown in Fig. 2.3 and the rate of the diffusion described by a proportionality factor called diffusion coefficient D [m 2 s -1 ]. Even though the diffusion layer has no definite thickness it is useful to think about the diffusion layer thickness
i [m] it in terms of
𝑑𝑥 = 𝛿 𝑖 = 2√𝐷 𝑖 𝑡. (12)
With this equation the calculated distance contains the complete diffusion layer with an error of 0.005 [1]. For an experimental time of 1 ms, i is about 2 µm and for 1s the layer has grown to 63 µm (with D i = 5·10 -9 m 2 s -1 ). [1]
Figure 2.3: Schematic representation of concentration profiles for several times after the start of an electrochemical experiment. Adapted from [4].
2.1.5 Mass transport
If the other processes affecting the reaction rate (e.g.: rate of electron transfer, chemical reactions preceding or following or surface reactions like adsorption, desorption) are ignored then the reaction rate is proportional to the concentration gradient and only limited by the mass transport of the reactant towards the surface.
𝑘 𝑟 ∝ 𝑑𝑐
𝑖𝑑𝑥 ∝ 𝐽 𝑖 (𝑥) (13)
10
The mass transport is the flux J i of a mass or species i [mol s -1 m -2 ] at a distance x from one compartment of the solution to another along the x axis. The mass transport is described by the Nernst-Planck equation (eq. 14) and is categorized into three modes. The flux arises from differences in electrical potential (migration), chemical potential (diffusion) and from the movement of a volume element of solution (convection).
𝐽 𝑖 (𝑥) = −𝐷 𝑖 𝜕𝑐
𝑖(𝑥)
𝜕𝑥 − 𝑧
𝑗𝐹
𝑅𝑇 𝐷 𝑖 𝑐 𝑖 𝜕𝜙(𝑥)
𝜕𝑥 + 𝑐 𝑖 𝑣(𝑥) (14) 𝐷 𝑖 , 𝑐 𝑖 , 𝜙, 𝑣 are the diffusion coefficient, the concentration, the electric potential and the velocity, respectively. The first term of the Nernst-Planck equation represents the mass transport by diffusion along a concentration gradient. The second term describes the mass transport by migration. The third term describes the mass transport by convection. To simplify the mathematical solution of the Nernst-Planck equation electrochemical systems are designed to neglect one or two contributions to the mass transport. Migration can be neglected by the addition of an inert supporting electrolyte at much higher concentrations than the electroactive species and convection is avoided by preventing stirring and vibrations. Under such conditions the mass transport becomes diffusion limited. [1,5]
2.1.6 Diffusion limited electrochemical reaction
For a diffusion limited electrochemical reaction the reaction rate is given by the first term of the Nernst-Planck equation.
𝑘 𝑟 = 𝐽 𝑖 (𝑥) = 𝐷 𝑖 𝜕𝑐
𝑖(𝑥)
𝜕𝑥 = 𝐷 𝑖 (𝑐
𝑖∗
−𝑐
𝑖(𝑥=0))
𝛿
𝑖= 𝑚 𝑖 (𝑐 𝑖 ∗ − 𝑐 𝑖 (𝑥 = 0)) (15) Since the diffusion layer thickness is often unknown the combination of i with the diffusion coefficient D i to a single constant, called the mass transport coefficient m i [m s -1 ] is convenient.
𝑚 𝑖 = 𝐷
𝑖𝛿
𝑖(16)
In the case of a complete conversion of the reactant at the electrode its concentration at the electrode becomes c i (x = 0) = 0 and the reaction rate is given by the product of the mass transport coefficient m i and the concentration of the electrochemical active species in bulk solution 𝑐 𝑖 ∗ . The diffusion limited current I l can be calculated with eq. 17.
𝐼 𝑙 = 𝑛𝐹𝐴𝑐 𝑖 ∗ 𝑚 𝑖 (17)
11
In the defined system the mass transport is limited only by diffusion according to Fick’s laws of diffusion. The first law describes the flux J of a species i [mol s -1 m -2 ] as a function of the change in its concentration, with distance x from an electrode.
−𝐽 𝑖 (𝑥) = 𝐷 𝑖 𝜕𝑐
𝑖(𝑥)
𝜕𝑥 (18)
The second law relates the change in concentration with time, to the change in flux with position.
𝜕𝑐
𝑗(𝑥,𝑡)
𝜕𝑡 = 𝐷 𝑗 𝜕
2
𝑐
𝑗(𝑥,𝑡)
𝜕𝑥
2(19)
The solution of this equations for a potential step experiment results in the Cottrell equation (eq. 20).
𝐼 𝑙 (𝑡) = 𝑛𝐹𝐴𝐷
𝑖1/2

![Figure 2.8: Schematic illustration of the instrumental SECM setup. Adapted from [7].](https://thumb-eu.123doks.com/thumbv2/1library_info/3737291.1509085/33.892.146.742.761.1076/figure-schematic-illustration-instrumental-secm-setup-adapted.webp)