Interferon beta signaling and microglial activation in a murine model for age-related macular degeneration
I n a u g u r a l - D i s s e r t a t i o n
zur
Erlangung des Doktorgrades
der Mathematisch-Naturwissenschaftlichen Fakultät der Universität zu Köln
vorgelegt von
Die vorliegende Dissertation wurde in der Zeit von Juni 2012 bis Mai 2016 in der Arbeitsgruppe Experimentelle Immunologie des Auges an der Augenklinik der Univeristätsklinik Köln unter der Anleitung von Prof. Dr. Thomas Langmann durchgeführt.
Berichterstatter:
Erste Prüferin: Prof. Dr. Elena Rugarli
Zweiter Prüfer: Prof. Dr. Thomas Langmann
Tag der mündlichen Prüfung: 29. Juni 2016
Les Ricochets
Am Ende gibt es einen Stein, der jault Wenn er beim Spiel über das Wasser springt Das Wasser zieht bei jedem Aufprall Kreise Als ob es ruhig rauchend Ringe bliese
Am Ende dieser abgeschliffne Stein, der jault
Wenn er vier-, fünfmal aufzuckt, untergeht
Die Ringe schwappen langsam an das Ufer
Contents
Summary 1
Zusammenfassung 2
1 Introduction 3
1.1 The mammalian retina . . . . 4
1.1.1 Degenerative diseases of the retina . . . . 5
1.1.2 Age-related macular degeneration . . . . 6
1.2 Microglia cells . . . . 8
1.2.1 Origin of microglia . . . . 8
1.2.2 Function of microglia . . . . 9
1.2.3 Microglia activation . . . . 10
1.2.4 Microglia in AMD . . . . 10
1.2.5 Microglia as therapeutic targets . . . . 12
1.3 Type I interferons . . . . 12
1.3.1 Interferon-beta . . . . 13
1.3.2 IFN-β as therapeutic agent . . . . 14
1.3.3 Effect of IFN-β on microglia . . . . 15
1.4 Aim of the thesis . . . . 17
2 Material and Methods 18 2.1 Material . . . . 19
2.1.1 Antibodies and Stains . . . . 19
2.1.2 Enzymes . . . . 19
2.1.3 Buffers and Solutions . . . . 20
2.1.4 Cell culture and qRT-PCR primers . . . . 21
2.1.5 Kit systems, Reagents and Chemicals . . . . 22
2.1.6 General consumables . . . . 24
2.1.7 Mouse Models . . . . 25
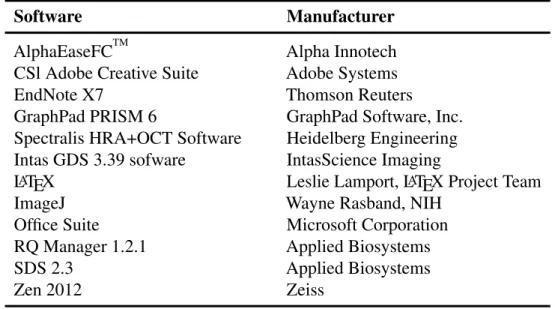
2.1.8 Software and Devices . . . . 26
iv
Contents
2.2 Methods . . . . 28
2.2.1 Mice . . . . 28
2.2.1.1 Mouse husbandry . . . . 28
2.2.1.2 Genotyping . . . . 28
2.2.1.3 Tamoxifen administration . . . . 29
2.2.1.4 Interferon beta treatment . . . . 29
2.2.1.5 Anesthesia . . . . 29
2.2.1.6 Laser-coagulation . . . . 29
2.2.1.7 Fundus fluorescein angiography . . . . 30
2.2.1.8 Spectral domain optical coherence tomography . . 30
2.2.2 Histological methods . . . . 30
2.2.2.1 Cryo sectioning . . . . 30
2.2.2.2 Flat mount preparation . . . . 31
2.2.2.3 Staining of cryo sections . . . . 31
2.2.2.4 Staining of flat mounts . . . . 31
2.2.2.5 Fluorescence microscopy . . . . 31
2.2.3 Cell culture . . . . 32
2.2.3.1 Maintaining and subculturing cells . . . . 32
2.2.3.2 Interferon beta stimulation . . . . 32
2.2.4 Molecular methods . . . . 32
2.2.4.1 RNA isolation . . . . 32
2.2.4.2 Determination of RNA concentration . . . . 32
2.2.4.3 Reverse transcription . . . . 33
2.2.4.4 Quantitative real-time PCR . . . . 33
2.2.4.5 Protein isolation . . . . 34
2.2.4.6 Determination of protein concentration . . . . 34
2.2.4.7 Western Blot . . . . 35
2.2.5 Statistical analysis . . . . 35
3 Results 36 3.1 Effect of IFNAR knockdown in laser-coagulation model . . . . 37
3.1.1 Microglia activation . . . . 37
3.1.2 Fluorescein leakage . . . . 39
Contents
3.3.2 Fluorescein leakage . . . . 45
3.3.3 Choroidal neovascularization . . . . 45
3.3.4 Edema formation . . . . 48
3.4 Microglia-specific knockdown of Ifnar1 . . . . 49
3.4.1 Microglia specificity of Cx3cr1 controlled Cre recombinase 49 3.4.2 Specific knockdown of Ifnar1 . . . . 50
3.5 Effect of microglia-specific IFNAR knockdown in laser-coagulation model . . . . 52
3.5.1 Microglia activation . . . . 52
3.5.2 Fluorescein leakage . . . . 54
3.5.3 Choroidal neovascularization . . . . 54
4 Discussion 58 4.1 Laser-induced photocoagulation as model for wet AMD . . . . 59
4.2 The murine and human type I interferon system . . . . 60
4.3 The protective effect of IFNAR on laser-induced AMD-like pathology 61 4.4 The beneficial effect of IFN-β therapy on disease symptoms . . . . 63
4.5 Perspectives . . . . 65
Bibliography . . . . 77
Abbreviations . . . . 78
List of Figures . . . . 81
List of Tables . . . . 82
5 Attachments i Danksagung . . . . iii
Erklärung . . . . iii
Lebenslauf . . . . iv
vi
Summary
Age-related macular degeneration (AMD) is a disease of the retina and the leading cause of vision loss among the elderly in industrial countries. It is characterized by progressive impairment of the visual perception and can be categorized into two distinct forms; wet and dry AMD. Typical hallmarks of wet AMD are chronic activation of the innate immune system in the retina and the ingrowth of blood ves- sels from the choroid into the retina termed as choroidal neovascularization (CNV).
Microglia, the immune competent cells of the retina, play a major role in the in- duction and advancement of chronic inflammation and CNV development observed during AMD pathogenesis regulating the immune answer and tissue homeostasis.
Therefore, strategies to dampen microgliosis present attractive therapeutic options in the treatment of AMD and other retinal degenerative disorders.
Interferon beta (IFN-β ), an endogenous cytokine and signaling molecule, is responsi- ble for essential regulatory functions of the innate immune system and is well known for its anti-angiogenic and immunomodulatory properties. Consequently, IFN-β is used as first line treatment of multiple sclerosis, a neuroinflammatory autoimmune disease of the brain.
However, it was previously unknown whether the protective effect is transferable to the retina. Hence, to fill this gap the current study endeavored to determine the effects of IFN-β signaling on microglial activation and choroidal neovascularization using a reproducible murine laser-coagulation model of wet AMD.
The results presented in this study reveal a crucial role of IFN-β signaling in regulat- ing microglial reactivity and pathological angiogenesis. Global as well as microglia specific interferon-α /-β receptor (IFNAR) deletion fortified disease severity and progression as evidenced by enhanced microglia reactivity, vessel leakage and CNV development. In contrast, IFN-β therapy resulted in a significant reduction of the clinical features associated with the murine laser-coagulation model of wet AMD.
In conclusion, this work indicates a protective role of IFNAR signaling in retinal
Zusammenfassung
Die altersabhängige Makuladegeneration (AMD) ist eine Erkrankung der Netzhaut, die zu einer progressiven Beeinträchtigung des visuellen Wahrnehmungsvermögens führt. In Industrieländern sind fast 70% der Erblindungen auf AMD zurückzuführen, wobei zwischen der feuchten und trockenen Form unterschieden wird. Zwei typische Merkmale der feuchten AMD sind zum einen das Einwachsen von choroidalen Blutgefäßen in die Netzhaut, auch Neovaskularisierung genannt, und zum anderen die Aktivierung des Immunsystems in Form einer Mikrogliose. Mikrogliazellen, die immunkompetenten Zellen der Netzhaut, sind in beiden Prozessen maßgeblich beteiligt, indem sie die Immunantwort und die Homöostase im Gewebe regulieren.
Eine potentielle Behandlungsmöglichkeit der AMD ist das Eindämmen der Mikro- gliose mit einer immunmodulatorischen Substanz. Auf diese Weise sollen die neuroprotektiven Eigenschaften der Mikrogliazellen wieder hergestellt werden, um so der Netzhautdegeneration entgegen zu wirken.
Interferon beta (IFN-β ) ist ein körpereigenes Zytokin und Signalmolekül das für grundlegende Funktionen im angeborenen Immunsystem verantwortlich ist und dessen anti-angiogene, als auch immunmodulierende Wirkung bekannt ist. Auf- grund letzterer Eigenschaft findet IFN-β zum Beispiel Einsatz bei der Behandlung von Multiple Sklerose, eine neurodegenerative Autoimmunerkrankung des Gehirns.
Bisher unbekannt ist, ob sich diese therapeutischen Eigenschaften von IFN-β auch auf die Netzhaut übertragen lassen. Das Ziel dieser Arbeit war es daher, den Effekt von IFN-β auf die Mikrogliaaktivierung und Angiogenese in vivo zu analysieren.
Mithilfe des murinen Laserkoagulation-Modells für feuchte AMD konnte in dieser Arbeit gezeigt werden, dass der Interferon-α /-β Rezeptor (IFNAR) erheblichen Ein- fluss auf die Gefäßneubildung und Mikrogliaaktivierung hat. So entwickeln Mäuse, die kein IFNAR exprimieren bzw. deren IFNAR auf Mikrogliazellen ausgeschaltet wurde, eine deutlich verstärkte Mikrogliose und choroidale Neovaskularisierung. Im Gegensatz dazu konnten, im gleichen Modell, größere Schäden der Netzhaut durch die systemische Behandlung von Mäusen mit IFN-β verhindert werden. Nach einer 14-tägigen IFN-β Therapie sind beide Krankheitssymptome signifikant zurückge- gangen.
Zusammenfassend lassen die Ergebnisse dieser Arbeit den Schluss zu, dass der IFNAR-Signalweg eine protektive Wirkung auf die Netzhaut hat. Besonders im Hinblick auf neue Therapieansätze ist IFN-β damit eine vielversprechende Substanz, die Anwendung in der Therapie degenerativer Netzhauterkrankungen finden könnte.
2
1 Introduction
1.1 The mammalian retina
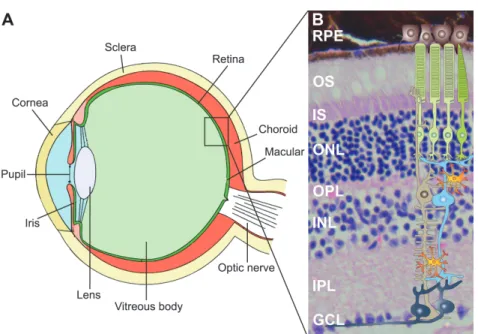
Figure 1.1: Anatomy of the mammalian eye and structure of the retina. The retina is the light- sensitive neuronal layer coating the posterior part of the eye. H&E staining of retinal cross sec- tion demonstrating distinct structures with schematic overview of different retinal cell types.
Layers - RPE: retinal pigment epithelium, OS: outer segments, IS: inner segments, ONL:
outer nuclear layer, OPL: outer plexiform layer, INL: inner nuclear layer, IPL: inner plexiform layer and GCL: ganglion cell layer. Cells - black: retinal pigment epithelial cells, green: rod and cone photoreceptor cells, blue: bipolar cell, grey: ganglion cells, brown: Müller glia cell, orange: microglia cells. (Eye ball modified from: https://upload.wikimedia.org/wikipedia/
commons/thumb/a/a5/Eye_scheme.svg/220px-Eye_scheme.svg.png, retinal cross section modified from http://experimentica.com/wp-content/uploads/2013/12/Mouse-retina.-HE.jpg, schematic retinal cells modified from Karlstetter et al. (2010).)
The retina is an approximately 0.2 mm thick neuronal tissue at the posterior part of the eye (Fig. 1.1 A). Compared to the rest of the eye, the retina and the optic nerve evolve during embryonic development from outgrowths of the mesencephalon so that both structures belong next to the brain and the spinal cord to the central nervous system (CNS). When light passes through the cornea and lens, the light-sensitive tissue initiates nerve impulses, which are forwarded by the optic nerve to the visual centers of the brain (Sung and Chuang, 2010).
The retina is organized in several anatomically distinct layers (Fig. 1.1 B). The outer part of the retina, the photoreceptor layer, contains two types of photoreceptor cells, rods and cones, which are both directly light sensitive. Rods support mainly scotopic vision as they function under low light conditions, whereas cones provide photopic vision including a high visual acuity with color perception. The photoreceptors,
4
1 Introduction
which are subdivided in outer (OS) and inner segments (IS), are connected in the outer plexiform layer (OPL) with the bipolar cells, which make synapses with the ganglion cells in the inner plexiform layer (IPL). The optic nerve fibers are formed by the axons of the ganglion cells and process the visual information towards the midbrain and thalamus, where it becomes converted into a picture. Next to the vertical signal transduction, there are laterally arranged horizontal and amacrine cells, providing side-to-side connection. The cell bodies of the above described cell types are either collected in the inner nuclear layer (INL), the outer nuclear layer (ONL) or the ganglien cell layer (GCL) (Nicholls et al., 2001, From Neuron to Brain).
The retinal pigment epithelial (RPE) cells form a monolayer which encloses the photoreceptor outer segments at the apical side and absorbs scattered or unabsorbed light. Additionally, the RPE is known for several other crucial functions including epithelial transport of ions and metabolic end products, phagocytosis of photorecep- tor debris and secretion of immunosuppressive factors (Strauss, 2005). Beyond that is the RPE involved in the formation of the blood retina barrier (BRB), a physio- logical border separating the inner retinal tissue from the blood stream and thereby establishing an immune privileged area.
Apart from that, two more cell types are part of the retina but do not directly con- tribute to the neuronal signal processing. Müller glia cells span across the whole retina, supporting the neuronal survival and maintaining the homeostasis in the retinal extracellular microenvironment (Bringmann et al., 2006). In contrast, mi- croglia cells are located in the plexiform layers of a healthy retina and monitor their microenvironment as they are the immune competent cells of the tissue (Sung and Chuang, 2010) (see section 1.2 for further information).
1.1.1 Degenerative diseases of the retina
The retina is a complex tissue composed of several specialized components, all with
a certain susceptibility to genetic defects. For that reason retinal dystrophies are a
heterogeneous group of disorders where inherited gene alterations lead to disorga-
nization of the retinal structure causing a defective signal transduction and visual
1 Introduction
photoreceptors (Portera-Cailliau et al., 1994). On the other hand, multifactorial dys- trophies become more important as they are the leading cause of visual impairment in industrialized countries. For instance, age-related macular degeneration (AMD) is a complex disease caused by genetic and environmental risk factors as well as aging processes (Jager et al., 2008).
In the past years, various animal models have been developed facilitating research to understand the pathology of degenerative processes but also to develop new thera- peutic approaches. There are two fundamentally different types of in vivo models:
Hereditary models develop retinal tissue degeneration due to genetic manipulation such as the retinoschisin-deficient Rs1h
-/Y(Weber et al., 2002) or the Fam161
GT/GTmouse (Karlstetter et al., 2014). In Rs1h
-/Ymice, retinoschisin knock out leads to a splitting of the inner retinal layers followed by photoreceptor loss. In Fam161
GT/GTmice, the truncated Fam161a protein initiates shortened connecting photorecep- tor cilia leading to progressive thinning and degeneration of the retina. Secondly, inducible models are used to recapitulate morphological and functional changes of retinal diseases. For example, the laser-coagulation model uses laser injury to disrupt Bruch’s membrane leading to choroidal neovascularization (CNV) and strong inflammation of the tissue (Pennesi et al., 2012). Since this model is suitable for animals at different age, genetic background or therapy applications, it is possible to test a broad variety of AMD-influencing factors (Lambert et al., 2013).
1.1.2 Age-related macular degeneration
Age-related macular degeneration is a multifactorial degenerative disease of the retina leading to progressive vision impairment up to blindness in the final stage. In 2013, AMD was next to cataracts and glaucoma the most common reason of vision loss (Global burden of disease study, 2015). Due to a continuously aging society, it is expectable that the prevalence of AMD increases in the coming decades.
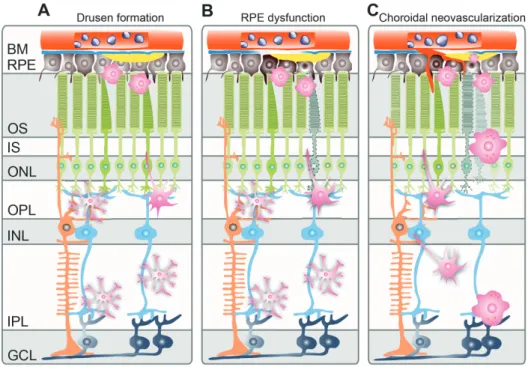
The disease is subdivided into early and advanced stages. Early age-related macular degeneration is characterized by pigmentation changes and the formation of drusen, an accumulation of intra- and extracellular metabolic debris in the subretinal space of the central retina (Fig. 1.2 A). Later stages of the disease can be classified into either dry AMD with retinal atrophy in the macula or wet AMD with choroidal neovascularization. Although only 10 to 15% of patients suffer from the wet form of AMD, it causes more than 80% of severe visual impairment (Jager et al., 2008). In severe stages of wet AMD, a dysfunctional RPE can cause the detachment of the retina, also called retinal atrophy, which is often accompanied by the expression of
6
1 Introduction
vascular endothelial growth factor (VEGF) and an increased vascular permeability occurring as subretinal hemorrhage or edema exudation (Fig. 1.2 B). Since the release of VEGF stimulates the development of neovessels, choroidal neovascularization proliferates and expands through a porous Bruchs’s membrane into the retinal tissue (Fig. 1.2 C) (reviewed in de Jong, 2006).The pathological changes of the retina additionally comes along with a chronic inflammation, which mediates the activation and recruitment of microglia cells from the plexiform layers towards the affected tissue (Karlstetter and Langmann, 2014).
Figure 1.2: Schematic development of wet AMD. In early stages of age-related macular
degeneration drusen accumulate in the subretinal space. Microglia cells become activated,
leave the plexiform layers and migrate towards the outer retina. The dysfunctional RPE
promotes in severe stages the ingrowth of choroidal blood vessels into the retina. Layers
- BM: Bruch’s membrane, RPE: retinal pigment epithelium, OS: outer segments, IS: inner
segments, ONL: outer nuclear layer, OPL: outer plexiform layer, INL: inner nuclear layer,
IPL: inner plexiform layer, GCL: ganglion cell layer. (Scheme modified from Karlstetter
et al., 2010).
1 Introduction
maculopathy susceptibility 2 (ARMS2) genes as risk factors known to predispose their carrier to AMD (Jager et al., 2008).
However, there is currently no effective cure for AMD, but the treatment of isolated clinical symptoms like managing the expansion of CNV can partially restore vision in patients with wet AMD. The most common therapy to attenuate the neovessel sprouting are intravitreal antibody injections inhibiting the vascular endothelial growth factor (VEGF) (Jager et al., 2008). Therefore, potential new therapy options for the management of both, atrophic and neovascular AMD, are of great interest.
1.2 Microglia cells
Microglia belong among others to the glia cells and are located in the central ner- vous system (CNS) consisting of the brain, the spinal cord and the retina. Like macrophages, microglia are mononuclear phagocytes and form the active immune defense in the CNS. They recognize small potentially pathogenic insults and maintain the tissue homeostasis by their phagocytic activity. As resident macrophages of the CNS, they are associated with the pathogenesis of neurodegenerative and inflamma- tory diseases of the brain and retina (Ginhoux et al., 2010). Approximately 10% of all cells found in the retina are microglia cells, which are typically distributed all over the tissue in large non-overlapping regions, monitoring their microenvironment (Ransohoff and Cardona, 2010).
1.2.1 Origin of microglia
Microglia were first described by del Rio-Hortega as cellular element of the CNS using silver staining methods. Back then, he already predicted that microglia enter the brain during early development and that they are of mesodermal origin (del Rio Hortega, 1932).
By now, it is generally accepted that microglia are distinct tissue-specific mononu- clear phagocytic cells. They origin from myeloid precursors and represent a distinct cellular entity, different from other cells in the CNS such as neurons, macroglia or vascular cells (Kettenmann et al., 2011; Karlstetter et al., 2015). In contrast to cerebral cells that arise from the primitive neuroepithelium, microglia invade from the yolk sac into the CNS during very early embryonic development before the blood- brain (BBB) and blood-retina barrier (BRB) arise (Ginhoux et al., 2010; Schulz et al., 2012). Both, BBB and BRB are physiological borders formed by endothelial cells,
8
1 Introduction
which separate the CNS from the peripheral tissue and tightly control the intracellular cross-talk and exchange between both compartments (Engelhardt and Liebner, 2014).
Because BBB and BRB prevent an unlimited exchange of blood-derived peripheral leukocytes protecting the CNS from a potentially harmful immune response (Streit, 2002), the barrier function is essential for maintaining tissue homeostasis (Liebner et al., 2011). From this the question arises whether microglia cells are a stable, self- maintaining cell population or rather replaced by blood-derived myeloid precursors passing the BBB/BRB for cell renewal. For clarification, parabiosis experiments, in which chimeric mice with differently labeled bone marrow cells share one blood flow, have been performed (Ajami et al., 2007). The results revealed that bone marrow-derived progenitor cells from the periphery do not enter the CNS under both, homeostatic as well as diseased conditions, indicating a slow microglial turnover rate (Gehrmann et al., 1995).
Meanwhile it is widely accepted that microglia are a self-sustaining cell popula- tion with a remarkable longevity, which discriminates these cells from peripheral bone-marrow derived cells (Goldmann et al., 2013).
1.2.2 Function of microglia
Microglia have different physiological functions within the adult CNS primarily related to immune response as well as maintaining tissue homeostasis. In order to prevent potentially fatal tissue damage, microglia are equally distributed in the plexiform layers of the retina, monitor their microenvironment and react to smallest alterations (see Fig. 1.1 B) (Karlstetter et al., 2010).
Since microglia are the first cerebral immune effector cells, they phagocyte cellular debris and apoptotic cell material, release pro- and anti-inflammatory factors for extracellular signaling and act as important antigen presenting cell in the CNS (Nim- merjahn et al., 2005; van Rossum and Hanisch, 2004; Gehrmann et al., 1995). Once involved in CNS injury, cytotoxic substances like nitric oxigen (NO) and reactive oxygen species (ROS) are released to fight infectious triggers (Banati et al., 1993;
Langmann, 2007).
To control microglial neurotoxicity, regulatory ligands like CD200 and C-X3-C motif
chemokine ligand 1 (CX3CL1, also named fractalkine) are expressed by neurons
1 Introduction
et al., 2011). Furthermore, microglia are involved in healing processes as they secrete anti-inflammatory mediators and promote synaptic stripping as well as neuronal regrowth (Gehrmann et al., 1995).
1.2.3 Microglia activation
Microglia are highly dynamic cells which are not only characterized by their diverse responsibilities but also by their morphological plasticity. They undergo struc- tural changes and adapt different phenotypes according to their activation status (Gehrmann et al., 1995; Nimmerjahn et al., 2005). In respond to local conditions or detected damage/danger-associated molecular patterns (DAMPs) (Kettenmann et al., 2011; Gao et al., 2011), microglial activation occurs in a graded process (Kreutzberg, 1996). Ramified cells with its small somata and long branching processes transform into activated, round shaped cells, also referred as reactive microglia (Fig. 1.3 from left to right). Once activated, the local density of microglia gain by proliferation to protect and restore tissue homeostasis and the phagocytic activity of the cells increases (Kettenmann et al., 2011). In the retina, reactivate microglia leave the plexiform layers and migrate towards site of damage (Gupta et al., 2003).
Apart from that, activated microglia cells also upregulate the expression of various cell surface molecules such as, major histocompatibility complex proteins II (MHC class II), cluster of differentiation molecule 11b (CD11b, also named integrin alpha- M beta-2 (α
Mβ
2)) or ionized calcium binding adaptor molecule 1 (Iba1, also named allograft inflammatory factor 1(AIF1)) (Dick et al., 1995; Xu et al., 2007; Ito et al., 1998; Autieri, 1996), which are amongst others used to immunohistochemistrally distinguish microglia cells from other cerebral/retinal cells. Especially the classical microglial marker protein Iba1 is used to image their morphology in detail (Ketten- mann et al., 2011).
1.2.4 Microglia in AMD
In human AMD it has been reported that a large amount of activated microglia cells are detectable in the subretinal space as well as the outer nuclear layer. A closer view displayed numerous engulfed photoreceptor particles in these microglia cells (Gupta et al., 2003). During earlier phases of AMD, enlarged phagocytes, either microglia
10
1 Introduction
Figure 1.3: Different microglia morphology. From left to right: Ramified microglia cells form long branched protrusions around a small cell soma to monitor their microenvironment.
Alterations in the tissue homeostasis cause graded morphological changes towards a amoe- boid shape, characterized by a rounded cell with an enlarged cell body. (Scheme modified from Kreutzberg, 1996).
or invading macrophages, are also related to subretinal drusen, indicating that they are attracted by the accumulation of lipids and deposits (Killingsworth et al., 1990;
Penfold et al., 1985).
Furthermore, transcriptome analysis of donor retinas of previously characterized AMD patients revealed an over-expression of wound response, complement, and gliogenesis genes. Especially the up-regulation of complement and major his- tocompatibility complex I genes like human leukocyte antigen (HLA)-A/B/C or beta-2 microglobulin (B2M) indicates an activation and contribution of microglia/
macrophages during AMD (Newman et al., 2012).
In murine AMD-models, the induction of retinal damage triggers a quick recruitment
and accumulation of monocytes and microglia towards the site of damage before first
indications of CNV are visible (Eter et al., 2008; Ebert et al., 2012). Interestingly,
depleting these cells with a monoclonal MC-21 antibody results in the suppression
of CNV (Liu et al., 2013). The same study reports an enhanced expression of vas-
cular endothelial growth factor in microglia cells accumulated in the lesions sites
compared to adjacent RPE cells. It has not yet been clarified whether microglia
contribute to the overall VEGF production but their drift towards sprouting vessels
is associated with an exacerbation of experimental CNV (Combadiere et al., 2007;
1 Introduction
1.2.5 Microglia as therapeutic targets
The previous section 1.2.4 mentioned the multifaceted contribution of microglia cells to AMD. Limiting the disease-driven destructive changes by targeting microglia may therefore decelerate the progression of degeneration (Schuetz and Thanos, 2004).
There is growing interest on modulating microglial reactivity towards a regulatory, homeostatic cell phenotype due to their frequent involvement in those neurode- generative processes. According to this, one strategy to prevent degeneration is to counter-regulate the harmful microglia over-activation with immunomodulatory pharmaceuticals. These include for example the antibiotic minocycline that has also potent anti-inflammatory capacity or the translocator protein (18 kDA) (TSPO) ligand XBD173 (Scholz et al., 2015b,a). Furthermore, natural compounds like the polyunsaturated fatty acid docosahexaenoic acid (DHA), the flavonoid luteolin or the turmeric component curcumin have been shown to modulate microglia gene expres- sion profiles towards an anti-inflammatory phenotype without complete blockade of their functions (Ebert et al., 2009; Dirscherl et al., 2010; Karlstetter et al., 2011).
Microglia targeting with such compounds may dampen the production of diverse proinflammatory mediators, eventually inhibiting the damaging microglial reactivity.
Also the identification of protective endogenous proteins and their mechanisms of action are valuable findings, potentially providing new strategies for neuroprotection (Aslanidis et al., 2015; Karlstetter et al., 2010; Cardona et al., 2006).
In conclusion, the common aim of these therapeutic strategies is rather to modulate the microglial mode of action to keep its beneficial homeostatic properties than completely preventing the microglia response (Karlstetter et al., 2015).
1.3 Type I interferons
Type I interferons (IFN) were discovered more than 50 years ago by Isaacs and Lindenmann as body own signaling molecules inhibiting virus replication in cell culture (Isaacs and Lindenmann, 1987). They belong, next to chemokines, inter- leukins, tumor necrosis factors and colony stimulating factors, to the large cytokine family (Tilg and Diehl, 2000). Acting on regulatory cell surface glycoproteins they transmit intracellular signaling and communication mechanisms (Tracey and Cerami, 1993). IFNs are especially released in response to viruses, bacteria, parasites, other cytokines and growth factors triggering the protective immune defense (Parkin and Cohen, 2001).
The family of IFNs includes 13 different interferon proteins subdivided in three
12
1 Introduction
groups: Type I IFN, Type II IFN and IFN-like cytokines (Pestka et al., 2004). This thesis concentrates exclusively on the type I interferon IFN-β .
1.3.1 Interferon-beta
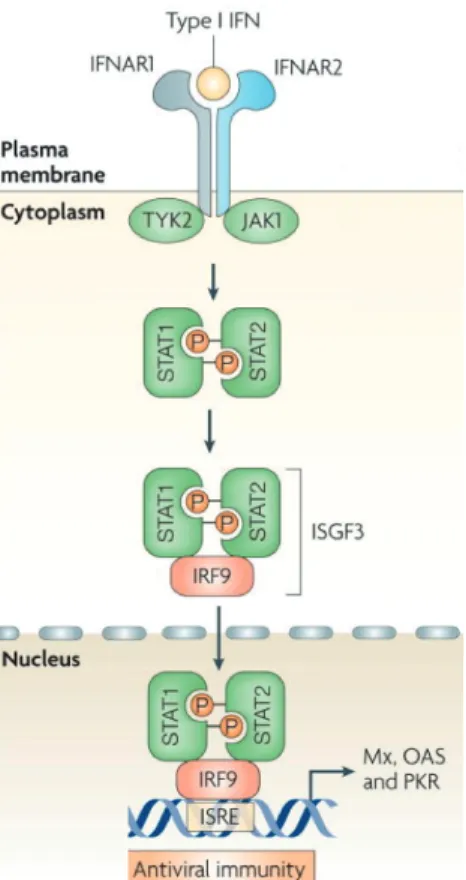
Figure 1.4: Activation of the JAK-STAT pathway. Type I interferon IFN-β binds to the Interferon-α /β receptor and activates the Janus kinase-signal transducer and activator of transcription pathway. IFNAR1- and IFNAR2 associated TYK2 and JAK1 phosphorylate STAT1 and STAT2, which in result heterodimerize forming together with IFR9 the interferon- stimulated gene factor 3. This complex translocates into the nucleus and activates the transcription of interferon-stimulated genes by binding the interferon-stimulated response element. (Scheme modified from Sadler and Williams, 2008).
Interferon beta (IFN-β ) is one out of seven type I interferons (Pestka et al., 2004)
and particularly recognized as a key regulator of the innate immune system (Sadler
and Williams, 2008). The IFN-β gene contains no introns and is in mammalian
1 Introduction
nucleated cell is capable to produce IFNs (Pestka et al., 2004) but IFN-β is predomi- nantly produced by precursors of dendritic cells and fibroblasts (Foster et al., 2000;
Stark et al., 1998).
IFN-β interacts as type I IFN with the Interferon-α /β receptor (IFNAR), a het- eromeric cell surface receptor, in an auto- as well as paracrine manner (Uze et al., 2007) and activates the classical JAK-STAT pathway (Fig. 1.4). IFNAR is composed of two subunits, IFNAR1 and IFNAR2, which are associated with Tyrosine kinase (TYK) 2 and Janus kinase (JAK) 1, respectively. Signaling downstream, signal trans- ducer and activator of transcription (STAT) proteins 1 and 2 become phosphorylated by TYK2 and JAK1 and form a heterodimer. The heterodimer associates with a DNA binding protein (IFR-9) and forms a complex called IFN-stimulated gene factor 3 (ISGF3). After formation, the ISGF3 complex translocates into the nucleus and binds to the IFN-stimulated response element (ISRE), which is located upstream of IFN stimulated genes (ISG) and regulates their transcription (reviewed in Bekisz et al., 2004).
There are more than 300 different ISGs induced by IFNAR-signaling mediating biological effects involved in immunity, differentiation, proliferation, apoptosis and angiogenesis. However, only a few interferon-induced genes have direct anti-viral, anti-proliferative or immunomodulatory effect. Instead, other effector pathways like the Mx GTPase pathway, 2’5’oligoadenylate-synthetase-directed ribonuclease L (OAS RNaseL) pathway or the protein kinase R (PKR) pathway have been identified to transduce the IFN-β -induced mode of action (reviewed in Sadler and Williams, 2008; Friedman, 2008).
1.3.2 IFN-β as therapeutic agent
Based on their anti-viral, anti-proliferative and immunomodulatory properties IFN-β have been used for different clinical applications since the early 1970s. Soon after their discovery by Isaacs and Lindenmann in 1957, it was the antiviral activity of interferons that made them to promising antiviral drugs. IFN-α was used with suc- cess to treat chronic hepatitis B virus (HVB) and hepatitis C virus (HVC (Cooksley, 2004; Shepherd et al., 2000). In 1983, Fiblaferon (Rentschler) was the first approved anti-viral drug on the market.
Soon after type I interferon application showed anti-tumor effects in mice, ex- periments to treat human tumors including renal cancers (Quesada et al., 1983), malignant melanomas (Krown et al., 1984), lymphomas, and leukaemias (Louie et al., 1981) came up (Gresser and Bourali, 1970). Due to the anti-angiogenic effect
14
1 Introduction
mediated by IFNs, the proliferation rate of the tumor cells was attenuated. Roferon A (Roche), the first cancer drug was launched 1987.
Of note, interferon was rare and expensive until 1980s and clinical investigations have been limited. Since the use of recombinant DNA technologies, there are two main variants of recombinant IFN. IFN-β -1a is produced by mammalian Chinese hamster ovary (CHO) cells, whereas IFN-β -1b is purified from genetically modified Escherichia coli cultures. As a consequence, IFN-β -1a is essentially identical to the natural IFN-β due to its glycosylation pattern, while IFN-β -1b differs from the native protein structure (Taniguchi et al., 1980) .
The first steps to clinically use the immunomodulatory properties of IFN-β did Jacobs et al. in 1982 (Jacobs et al., 1982). IFN-β was administered intrathecally to ten MS patients and then the clinical course was monitored and compared to untreated MS patients for two years. This was the first time a beneficial effect of IFN-β on disease progression of MS was shown. Shortly after, IFN-β became the first line treatment for relapsing-remitting MS, when Betaseron (Bayer) was launched in 1993.
However, the exact mechanisms of action remain unclear. There are indications that IFN-β shapes the T-cell function by regulating their activity, proliferation and migration (Yong et al., 1998). Furthermore, it may modulate the cytokine production profile towards an anti-inflammatory milieu, which is thought to reduce the neuronal inflammation (Kieseier, 2011). Finally, IFN-β may inhibit the proliferation of leuko- cytes and modify their antigen presentation pattern (Yong et al., 1998).
There are several adverse effects induced by IFN-β as the endogenous protein is produced in order to fight infections. The temporary increase of cytokine expression causes typical flu-like symptoms, muscle pain, depression, leukopenia, lymphopenia, injection-site reactions and inflammation (Nikfar et al., 2010).
As described in section 1.3.1, the biological function of IFN-β is mediated by the
expression of ISGs. Of these known functions, the immunomodulatory properties of
IFN-β are considered to be the most relevant transmitting the therapeutic action in
MS.
1 Introduction
innate immune system. In 1997, Chabot and colleges could show in cell culture studies that IFN-β modulates the interaction between activated T-lymphocytes and microglia cell, resulting in a reduced production of the proinflammatory cytokine TNF-α (Chabot et al., 1997). Beyond that, an in vivo study revealed attenuated experimental autoimmune encephalomyelitis (EAE), a model disease for multiple sclerosis, with excessive microglia activation in mice lacking the IFN-β gene (Teige et al., 2003). Prinz and colleagues could show a similar correlation of IFN-β and the disease severity of EAE: Animals without IFNAR expression developed provoked clinical disease symptoms characterized by higher inflammation, demyelination and lethality of the mice. While the IFN-β concentration in the CNS was increased during EAE, the absence of IFNAR on myeloid cells caused impaired disease symptoms.
Furthermore, the results of recent studies point towards a pivotal role of IFN-β - signaling during neurodegenerative autoimmune diseases. In vivo studies revealed that endogenous IFN-β is mainly produced and secreted by microglia cells, which are additionally associated with the clearance of myelin debris (Kocur et al., 2015).
Also the endogenous induction of IFN-β secretion by intrathecal administration of polyinosinic-polycytidylic acid (poly I:C), had a protective effect during EAE (Khorooshi et al., 2015).
So far, there is little known about the regulation of IFNAR-signaling. A recent study describes ubiquitin-specific protease (USP) 18, an interferon-stimulated gene, as negative regulator of the IFNAR signaling pathway attenuating microglia activation.
USP18 terminates the IFNAR-signaling by deactivating Stat1 proteins and therewith inhibiting interferon-induced gene expression (Goldmann et al., 2015).
While the functional results indicate a protective role of IFN-β during cerebral inflammation, the precise mode of action of IFN-β on microglia remains unclear.
Along with that, the question arises whether the results are readily transferable to retinal microglia and neurodegenerative conditions. Therefore, the leading topic of this thesis is the relation between microglia activation and IFN-β signaling during AMD-like retinal degeneration.
16
1 Introduction
1.4 Aim of the thesis
It is generally accepted that microglia reactivity as well as pathological angiogenesis are deconstructive events in the wet form of AMD promoting degenerative processes leading sooner or later to irreversible vision loss. Thus, understanding the disease formation on the one hand and attenuating excessive immune response on the other hand display a promising strategy to diminish disease burden.
It is postulated that a lack of IFNAR signaling in experimental autoimmune en- cephalomyelitis, a murine model disease for the cerebral disorder multiple sclerosis (MS), intensifies disease symptoms accompanied by a higher inflammation, demyeli- nation and lethality. Furthermore, IFN-β treatment is used as immunomodulatory drug treating MS in humans, without entirely understanding its mode of action.
Therefore there were two aims in this study:
1. Investigating the influence of IFNAR signaling on angiogenesis and microglia reactivity in the retina, both typical hallmarks of AMD pathogenesis, using the laser coagulation model in constitutive and conditional Ifnar1 knock out mice.
2. Analyzing the potential immunomodulatory effect of IFN-β on disease symptoms
by treating laser coagulated mice with IFN-β .
2 Material and Methods
2 Material and Methods
2.1 Material
2.1.1 Antibodies and Stains
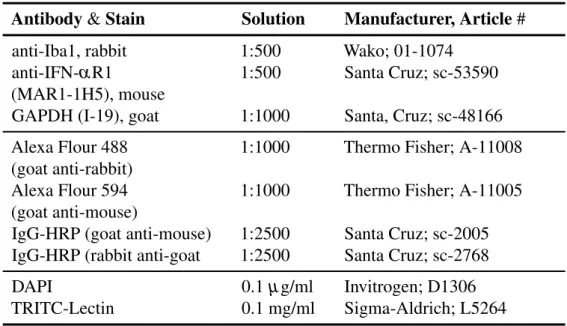
Table 2.1: List of primary and secondary antibodies as well as other staining reagents used for the experiments.
Table 2.1: Antibodies and Stains
Antibody & Stain Solution Manufacturer, Article #
anti-Iba1, rabbit 1:500 Wako; 01-1074
anti-IFN-α R1 1:500 Santa Cruz; sc-53590
(MAR1-1H5), mouse
GAPDH (I-19), goat 1:1000 Santa, Cruz; sc-48166 Alexa Flour 488 1:1000 Thermo Fisher; A-11008 (goat anti-rabbit)
Alexa Flour 594 1:1000 Thermo Fisher; A-11005 (goat anti-mouse)
IgG-HRP (goat anti-mouse) 1:2500 Santa Cruz; sc-2005 IgG-HRP (rabbit anti-goat 1:2500 Santa Cruz; sc-2768
DAPI 0.1 µ g/ml Invitrogen; D1306
TRITC-Lectin 0.1 mg/ml Sigma-Aldrich; L5264
2.1.2 Enzymes
Table 2.2: List of the used enzymes.
Table 2.2: Enzymes
Enzyme Manufacturer, Article #
DNAseI, RNase-free Qiagen, 1010394
RevertAid
TMM-MulLV Thermo Scientifitc, EPO441 Taq Polymerase (PCR) Genaxxon; M3454
Taq Polymerase (qRT-PCR) Qiagen; 105476
Proteinase K Applichem; A3459
2 Material and Methods
2.1.3 Buffers and Solutions
Table 2.3: List of self-prepared buffers and solutions.
Table 2.3: Buffers and Solutions Buffer/Solution Formula
1x Running gel 10% 3.0 ml 30% Acrylamide, 2.25 ml 1.5 M Tris pH 8.8, 60 µ l 10% APS, 90 µ l 10% SDS, 20 µ l TEMED in 10 ml dH
2O
1x Stacking gel 5 % 500 µ l 30% Acrylamide, 380 µ l 0.5 M Tris pH 6.8, 32 µ l 10% APS, 32 µ l 10% SDS, 6 µ l TEMED in 3 ml dH
2O
10x DNA loading buffer
10mM Tris-HCL (pH 7,5), 5 mM Sodium Acetate, 2 mM EDTA 10% Glycerin, 0,001% Bromphenol blue, 0,001% Xylencyanol
10x Running buffer 29.0 g TRIS, 144.0 g Glycine, 10.0 g SDS in 1 liter dH
2O
10x Transfer buffer 144.0 g Glycine, 30 g TRIS in 1 liter dH
2O
10x TBE 1 M Tris, 1 M boric acid, 20 mM, EDTA (pH7.5) in dH
2O
10x TBS-T 24.2 g TRIS, 80.0 g NaCL, 10 ml Tween-20 in 1 liter dH
2O
30% Sucrose 30% Sucrose in dH
2O Antibody blocking
solution
2% BSA, 0.2% NaN3, 0.1% Triton X-100 in 1x PBS
Agarose gel 1.5% Agarose in 1x TBE buffer BLOTTO 1% milk, 0.1% Tween 20 in 1xPBS DAPI solution 0.1 µ g in 1x PBS
Permeabilization buffer
5% Triton X-100, 5% Tween 20 in 1x PBS
RIPA buffer 150 mM NaCl, 1% NP-40, 0.5% Na-DCA, 0.1%
SDS, 50 mM Tris-HCL pH 7.4, 2 mM PMSF, Pro- tease Inhibitor in 10 ml dH
2O
20
2 Material and Methods
2.1.4 Cell culture and qRT-PCR primers
Tables 2.4: Lists of all cell lines, cell culture reagents and media as well as qRT-PCR probes and primer pairs used for the experiments.
Table 2.4: Cell culture consumables
Cell line Origin
BV-2 Prof. Dr. Lucius; Blasi et al. (1990)
SV40 Reiner et al. (2015)
Cell culture reagent Manufacturer, Article # DMEM High Glucose Sigma-Aldrich, D5796 Fetal calf serum (FCS) Gibco, 10270-106 Interferon beta (human) AbD Serotec, PMP28Z Interferon beta (murine) PBL; 12400-1
L-glutamin Gibco, 25030-024
Penicillin/Streptomycin Gibco, 15140-122 RPMI 1640 medium Gibco, 31870 Cell culture media Formula
BV-2 medium RPMI 1640 medium, 2mN L-glutamin, 1%
Penicillin/Streptomycin, 5% FCS and 0.01% β - Mercaptoethanol
SV40 medium DMEM High Glucose, 10% FCS and 10% Peni-
cillin/Streptomycin
2 Material and Methods
Table 2.5: List of Roche Library probe numbers and primer pairs used for qRT-PCR .
Table 2.5: Probes and Primers for qRT-PCR
Gene Probe # Primer Sequence
Atp5b #77 F 5’-ggcacaatgcaggaaagg-3’
R 5’-tcagcaggcacatagatagcc-3’
GAPDH #60 F 5’-gcccaatacgaccaaatcc-3’
R 5’-agccacatcgctcagaca-3’
MX1, human #79 F 5’-ttcagcacctgatggccta-3’
R 5’-aaagggatgtggctggagat-3’
Mx1, murine #53 F 5’-ttcaaggatcactcatacttcagc-3’
R 5’-gggaggtgagctcctcagt-3’
Mx2, murine #11 F 5’-cagttcctctcagtcccaagat-3’
R 5’-tgcggttgtgagcctctt-3’
2.1.5 Kit systems, Reagents and Chemicals
Tables 2.6 and 2.7: Lists of used kit systems, reagents and chemicals.
Table 2.6: Kits and Reagents
Kit & Reagents Manufacturer, Article # DNeasy Blood & Tissue Kit Qiagen; 69504
NucleoSpin
RRNA Mini Kit Macherey-Nagel; 740955 RevertAid
TMRT Kit Thermo Scientific; K1691 SuperHot Taq PCR Kit Genaxxon; M3306
SuperSignal West Pico Thermo Scientific; 34079 Chemiluminescent Substrate
dNTP Mix, 10 mM each Thermo Scientific; R0132 FastStart Universal Probe Master Roche; 14943600
Fluorescent Mounting Medium Dako; 53023
GeneRuler 1kb DNA Ladder Thermo Scientific; SM0311 PageRuler Protein Ladder Thermo Scientific; 26616
Protease Inhibitor Roche; 11697498001
Roti
R-Quant (Coomassie Roth; K0151 Brilliant Blue-G250)
TissueTek O.C.T. compound Hartenstein; TTEK
22
2 Material and Methods
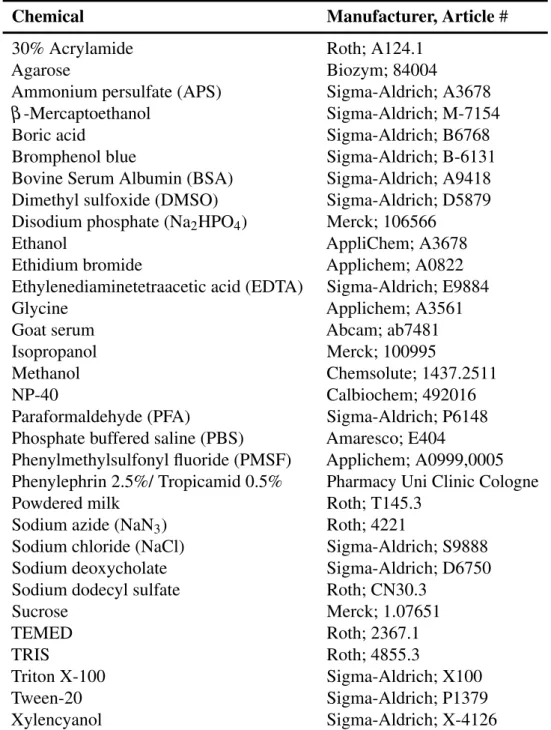
Table 2.7: Chemicals
Chemical Manufacturer, Article #
30% Acrylamide Roth; A124.1
Agarose Biozym; 84004
Ammonium persulfate (APS) Sigma-Aldrich; A3678
β -Mercaptoethanol Sigma-Aldrich; M-7154
Boric acid Sigma-Aldrich; B6768
Bromphenol blue Sigma-Aldrich; B-6131
Bovine Serum Albumin (BSA) Sigma-Aldrich; A9418 Dimethyl sulfoxide (DMSO) Sigma-Aldrich; D5879 Disodium phosphate (Na
2HPO
4) Merck; 106566
Ethanol AppliChem; A3678
Ethidium bromide Applichem; A0822
Ethylenediaminetetraacetic acid (EDTA) Sigma-Aldrich; E9884
Glycine Applichem; A3561
Goat serum Abcam; ab7481
Isopropanol Merck; 100995
Methanol Chemsolute; 1437.2511
NP-40 Calbiochem; 492016
Paraformaldehyde (PFA) Sigma-Aldrich; P6148 Phosphate buffered saline (PBS) Amaresco; E404
Phenylmethylsulfonyl fluoride (PMSF) Applichem; A0999,0005 Phenylephrin 2.5%/ Tropicamid 0.5% Pharmacy Uni Clinic Cologne
Powdered milk Roth; T145.3
Sodium azide (NaN
3) Roth; 4221
Sodium chloride (NaCl) Sigma-Aldrich; S9888
Sodium deoxycholate Sigma-Aldrich; D6750
Sodium dodecyl sulfate Roth; CN30.3
Sucrose Merck; 1.07651
TEMED Roth; 2367.1
TRIS Roth; 4855.3
Triton X-100 Sigma-Aldrich; X100
Tween-20 Sigma-Aldrich; P1379
Xylencyanol Sigma-Aldrich; X-4126
2 Material and Methods
2.1.6 General consumables
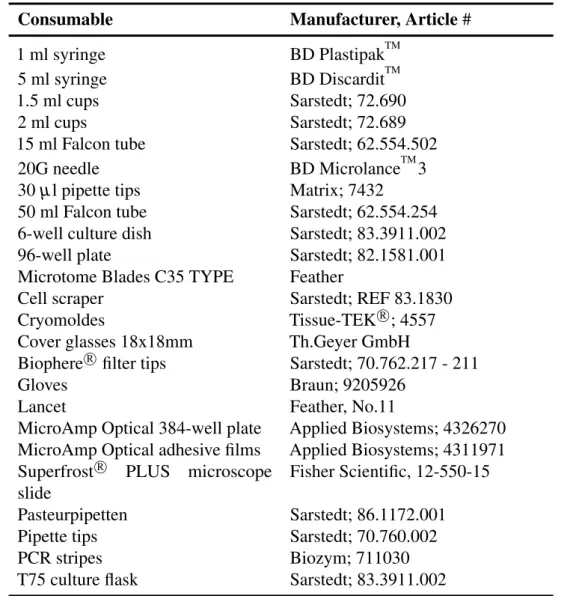
Table 2.8: All basic consumables used for the experiments.
Table 2.8: General consumables
Consumable Manufacturer, Article #
1 ml syringe BD Plastipak
TM5 ml syringe BD Discardit
TM1.5 ml cups Sarstedt; 72.690
2 ml cups Sarstedt; 72.689
15 ml Falcon tube Sarstedt; 62.554.502
20G needle BD Microlance
TM3
30 µ l pipette tips Matrix; 7432
50 ml Falcon tube Sarstedt; 62.554.254 6-well culture dish Sarstedt; 83.3911.002
96-well plate Sarstedt; 82.1581.001
Microtome Blades C35 TYPE Feather
Cell scraper Sarstedt; REF 83.1830
Cryomoldes Tissue-TEK
R; 4557
Cover glasses 18x18mm Th.Geyer GmbH
Biophere
Rfilter tips Sarstedt; 70.762.217 - 211
Gloves Braun; 9205926
Lancet Feather, No.11
MicroAmp Optical 384-well plate Applied Biosystems; 4326270 MicroAmp Optical adhesive films Applied Biosystems; 4311971 Superfrost
RPLUS microscope
slide
Fisher Scientific, 12-550-15
Pasteurpipetten Sarstedt; 86.1172.001
Pipette tips Sarstedt; 70.760.002
PCR stripes Biozym; 711030
T75 culture flask Sarstedt; 83.3911.002
24
2 Material and Methods
2.1.7 Mouse Models
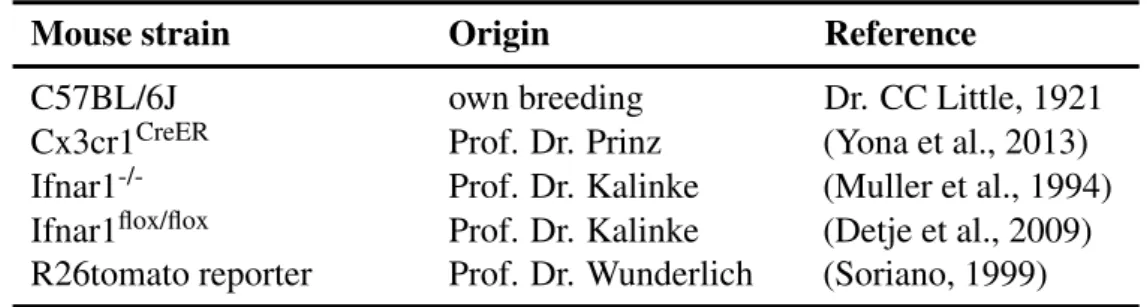
Tables 2.9, 2.10 and 2.11: Mouse models, genotyping primer pairs and injection solutions used for the experiments.
Table 2.9: Mouse strains
Mouse strain Origin Reference
C57BL/6J own breeding Dr. CC Little, 1921
Cx3cr1
CreERProf. Dr. Prinz (Yona et al., 2013) Ifnar1
-/-Prof. Dr. Kalinke (Muller et al., 1994) Ifnar1
flox/floxProf. Dr. Kalinke (Detje et al., 2009) R26tomato reporter Prof. Dr. Wunderlich (Soriano, 1999)
Table 2.10: Primers and PCR programs for Genotyping
Mouse strain Primer sequence & PCR program Cx3cr1
CreERforward 5’-cctctaagactcacgtggacctg-3’(wt)
forward 5’-gccgcccacgaccggcaaac-3’ (tg) revers 5’-gacttccgagttgcggagcac-3’
Predenaturation: 5 min 94
◦C | Denaturation/ Annealing/
Elongation: 35x 30 sec 94
◦C, 45 sec 58
◦C, 45 sec 72
◦C | Final elongation: 5 min 72
◦C
Ifnar1
-/-forward 5’-aagatgtgctgttcccttcctctgctctga-3’
revers 5’-attattaaaagaaaagacgaggcgaagtgg-3’
Predenaturation: 5 min 94
◦C | Denaturation/ Annealing/
Elongation: 35x 30 sec 94
◦C, 45 sec 58
◦C, 45 sec 72
◦C | Final elongation: 5 min 72
◦C
Ifnar1
flox/floxforward 5’-caggccactctgcatttcctc-3’ (wt) forward 5’-ctttttggatatcaagaaagcaaat-3’ (tg) revers 5’-ctttttggatcgatccataacttcg-3’
Predenaturation: 3 min 94
◦C | Denaturation/ Annealing/
Elongation: 35x 30 sec 94
◦C, 30 sec 58
◦C, 30 sec 72
◦C | Final elongation: 5 min 72
◦C
Exon ∆10 forward 5’-ggttaagctccttgctgctatctgg-3’
revers 5’-ttggagatgcaatctgctactcagc-3’
◦