Review
Learning from Fifteen Years of Genome-Wide Association Studies in Age-Related
Macular Degeneration
Tobias Strunz
1,†, Christina Kiel
1,†, Bastian L. Sauerbeck
1and Bernhard H. F. Weber
1,2,*
1
Institute of Human Genetics, University of Regensburg, 93053 Regensburg, Germany;
Tobias.Strunz@klinik.uni-regensburg.de (T.S.); Christina.Kiel@klinik.uni-regensburg.de (C.K.);
Bastian.Sauerbeck@klinik.uni-regensburg.de (B.L.S.)
2
Institute of Clinical Human Genetics, University Hospital Regensburg, 93053 Regensburg, Germany
* Correspondence: bweb@klinik.uni-regensburg.de
† These authors contributed equally to this work.
Received: 31 August 2020; Accepted: 8 October 2020; Published: 10 October 2020
Abstract: Over the last 15 years, genome-wide association studies (GWAS) have greatly advanced our understanding of the genetic landscape of complex phenotypes. Nevertheless, causal interpretations of GWAS data are challenging but crucial to understand underlying mechanisms and pathologies.
In this review, we explore to what extend the research community follows up on GWAS data. We have traced the scientific activities responding to the two largest GWAS conducted on age-related macular degeneration (AMD) so far. Altogether 703 articles were manually categorized according to their study type. This demonstrates that follow-up studies mainly involve “Review articles” (33%) or
“Genetic association studies” (33%), while 19% of publications report on findings from experimental work. It is striking to note that only three of 16 AMD-associated loci described de novo in 2016 were examined in the four-year follow-up period after publication. A comparative analysis of five studies on gene expression regulation in AMD-associated loci revealed consistent gene candidates for 15 of these loci. Our random survey highlights the fact that functional follow-up studies on GWAS results are still in its early stages hampering a significant refinement of the vast association data and thus a more accurate insight into mechanisms and pathways.
Keywords: age-related macular degeneration; GWAS; eQTL; TWAS; analytical review
1. Introduction
Age-related macular degeneration (AMD) is the most common cause of visual impairment and blindness in industrialized countries [1]. The clinical phenotype is progressive with age and is characterized by degenerative processes and ultimately the loss of photoreceptor cells. The natural history of the disease is mainly attributable to a dysregulation of the retinal support system, dependent on the mono-layered retinal pigment epithelium (RPE), Bruch’s membrane, and the choriocapillaris/choroid blood supply [2]. While a number of studies have shown that AMD patients exhibit changes in blood serum components [3,4], the exact mechanisms of disease development are still not fully understood and treatment options are limited.
In addition to environmental factors, genetic predisposition plays a crucial role in AMD susceptibility rendering the disease a complex disorder. A twin study of Seddon et al. (2005) estimated the genetic contribution to be as high as 71% [5]. A breakthrough in AMD genetics, as for complex diseases in general, was achieved by a first successful genome-wide association study (GWAS) conducted in 2005. Klein et al. (2005) compared the genotypes of 96 AMD patients and 50 controls and identified genetic variants around the Complement Factor H (CFH) gene locus to be
Cells2020,9, 2267; doi:10.3390/cells9102267 www.mdpi.com/journal/cells
reproducibly associated with AMD [6]. This initial study was followed by numerous GWAS for AMD, which included increasing numbers of individual DNA samples consequently revealing additional AMD-associated loci [7]. The most recent and largest AMD GWAS was published in 2016 by the International AMD Genomics Consortium (IAMDGC) and included 16,144 patients and 17,832 controls.
Altogether, 52 independent genetic signals distributed over 34 loci showed an association with AMD at genome-wide significance [8].
From the beginning, GWAS have produced a huge pool of data for a plethora of complex traits and diseases. In consequence, questions of what can be accomplished with these vast data sets and how to gain functional insights from the many linked association signals at a single locus became increasingly prominent. Especially, disease-associated genetic variants in non-coding regions of the genome tenaciously resist to offer a simple interpretation of their functionality [9,10]. Last but not least, other biological and statistical constraints, such as linkage disequilibrium (LD) or necessary statistical adjustments for a high number of conducted tests, further complicate data interpretation and consequently the identification of disease-relevant genes.
Initially, potential candidate genes underlying the genetic association signals within a locus were chosen simply by proximity to the respective lead genetic variant. More intelligent strategies were sought, as increasing evidence emerged that non-coding variants can have far-reaching effects [11].
Clever statistical approaches were designed to fine-map loci or to identify the causative genetic signal, e.g., by using Mendelian randomization [12,13]. The identification of pleiotropic genetic signals highlighted potentially shared pathways between complex diseases and traits [14]. More recently, technological advances enabled the large-scale analysis of molecular phenotypes like mRNA abundance or DNA methylation. Studying gene expression regulation in dependence of genetic variation generates data known as expression quantitative trait loci (eQTL) [15,16]. eQTL studies aim to uncover direct mechanisms of gene expression regulation and their results are likely to suggest candidate genes involved in disease pathology. Advances in machine learning approaches may facilitate an even more global analysis of gene expression regulation. This latter methodology is not only focused on individual genetic variants but instead integrates GWAS and gene expression datasets to identify gene–trait associations in so-called transcriptome-wide association studies (TWAS) [17,18].
In this review, we follow up on the two largest GWAS conducted on AMD so far and explore in an exemplary manner, to what extend the obtained association data were processed in the following years to gain information on biological mechanisms underlying the disease pathology. We further focus on current eQTL and TWAS studies related to AMD, which are becoming more popular. Our aim is to present a critical assessment of how the available large-scale AMD GWAS data are exploited to identify and evaluate potential disease-related candidate genes for future research into AMD etiology.
2. Materials and Methods
2.1. Curation of Articles Citing the Two AMD GWAS Fritsche et al. 2013 and Fritsche et al. 2016
The Web of Science Core Collection [19] was searched for articles citing the AMD GWAS articles
published by Fritsche et al. 2013 [20] and/or Fritsche et al. 2016 [8] (Figure S1). The publications
were manually appraised based on abstract and full text content, the latter if available. Articles were
then assigned to one of five categories: (1) “Genetic association study”, (2) “Experimental study”,
(3) “Clinical study”, (4) “Review article”, or (5) “Referencing only”. The category “Genetic association
study” refers to follow-up investigations pursuing genetic associations of AMD-related genotypes
with any phenotype. Articles that reported any derivative experimental work in continuation of the
AMD GWAS results as given in references [20] and/or [8] were assigned to the category “Experimental
study”. “Clinical study” is a category focusing on clinical phenotype-associated issues but not on
the genetics of AMD. ”Review articles” aggregate reviews, editorial material and comments based
on the two publications [8,20]. Articles, which cited references [8,20] but only referred to AMD in
general terms were assigned to the category “Referencing only”. We removed articles listed multiple
times in the Web of Science citation report. Further, articles citing both AMD GWAS [8,20] were only considered in the evaluation of Fritsche et al. 2016 [8] citing articles. Multi-assignment of categories was allowed for the categories “Genetic association study” and “Experimental study”.
2.2. Locus Analysis of 34 Known AMD-Associated Loci
All publications initially categorized into “Genetic association study” or “Experimental study”
were re-reviewed individually to determine if they investigated defined loci or if they rather pursued a more general approach. Next, the respective loci were considered for their overlap with the 34 AMD-associated loci in the GWAS published in [8]. Studies replicating only defined GWAS associations in additional populations were not considered in this analysis. Loci, which were investigated by a genetic association study and additional experiments in the same article were counted only once in one of the two categories.
2.3. Curation and Quality Control of Studies Investigating AMD in the Context of Gene Expression Regulation PubMed [21] was searched for the term “Age-related macular degeneration” with the combinations
“gene expression regulation”, “eQTL”, or “TWAS”. Our study inclusion criteria filtered for studies globally investigating the transcriptome in at least 70 samples. The literature search identified six potentially relevant studies of which five were considered for further evaluation (Table 1). Wang et al.
(2019) [22] were excluded as this study merged eQTL data from 44 tissues (GTEx v6 [23]) and only considered the most significant eQTL p-Value per variant throughout all tissues which is not in-line with generally accepted eQTL or TWAS concepts [17,18,24].
Next, we extracted AMD-related significant results of the remaining five studies. As each study used a different adjustment protocol for multiple testing, the significance thresholds as specified in the respective study were maintained. The most stringent cutoff was chosen, if a study applied several significance thresholds. We further adjusted effect directions according to the AMD risk increasing allele to allow a uniform comparison of findings across the five studies. Study-specific parameters were as follows:
Ratnapriya et al. (2019) [25] conducted an eQTL and a TWAS analysis based on 406 samples.
Significant eQTL were identified using a two-step protocol. First, permutations were conducted to identify a gene-specific significance threshold. This threshold was then adjusted for multiple testing across all genes using the false-discovery rate (FDR) from Storey et al. (2003) [26] at 0.05. We downloaded the eQTL results [27] which were then filtered for the 52 AMD-associated lead variants [8].
In their TWAS analysis, Ratnapriya et al. (2019) chose a Bonferroni correction for multiple testing (threshold 0.05) and required the genetic expression model R2 to be at least 0.01 [25].
Orozco et al. (2020) [28] investigated eQTL in a total of 121 samples from retinal and combined RPE and choroid (RPE/choroid) tissue. Further, they distinguished between macular and non-macular tissue and applied a Benjamini and Hochberg FDR threshold of 0.05 [29]. As not all summary statistics are available for download, we only considered the significant AMD loci provided in Data S4 by Orozco et al. (2020). The eye-eQTL database [30] containing the eQTL data of Orozco et al. (2020) was used to manually obtain the eQTL effect alleles.
Our group published three studies with regard to gene expression regulation in the context of AMD genetics. First, a mega-analysis of eQTL in 588 liver samples and a Benjamini and Hochberg FDR threshold of 0.05 to identify significant eQTL of AMD lead variants [31]. Second, a mega-analysis of eQTL in 311 retinal tissues, which also included the healthy donor samples of Ratnapriya et al.
(2019) [32]. The correction for multiple testing was done as described for Ratnapriya et al. (2019).
Third, a TWAS based on 27 tissues from GTEx and the individual genotypes of all samples from the
IAMDGC with European ethnicity [8,33]. AMD-associated genes were identified separately for each
tissue and adjustment for multiple testing used a Benjamini and Hochberg FDR threshold of 0.001.
Table 1. Studies investigating AMD association data in the context of gene expression regulation.
Study Study
Type Category Tissue Sample
Size
AMD Status of Tissue Donors
AMD Loci [8]1 with Findings Ratnapriya et al.
(2019) [25]
eQTL,
TWAS Single study Retina 406 Non-AMD (94),
AMD (312)
eQTL: 9, TWAS: 10 Orozco et al.
(2020) [28] eQTL Single study Retina,
RPE/choroid 121 Non-AMD (98), AMD (23)
11 in retina, 9 in RPE/choroid Strunz et al.
(2020) [32] eQTL Mega-analysis Retina 311 Non-AMD 4
Strunz et al.
(2018) [31] eQTL Mega-analysis Liver 588 Unknown 5
Strunz et al.
(2020) [33] TWAS - 27 tissues 134–421 Unknown 25
1Referring to 34 AMD-associated loci with genome-wide significance identified by Fritsche et al. 2016 [8]; eQTL:
expression quantitative trait locus; RPE: retinal pigment epithelium; TWAS: transcriptome-wide association study.
3. Results
3.1. Investigations Following the AMD GWAS of Fritsche et al. 2016
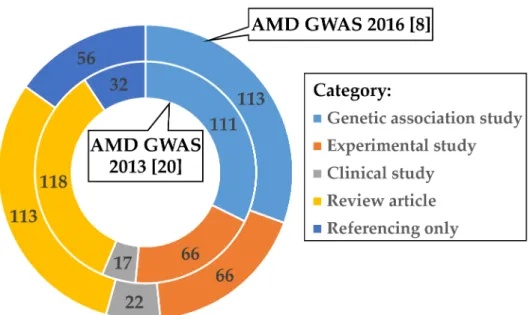
In a first step, we aimed to investigate how the research community further processed the data given in the most recent comprehensive AMD GWAS published by Fritsche et al. in 2016 [8] (Figure S1). We identified 366 studies citing the corresponding publication and categorized the follow-up activities in five subject groups (Table S1 and Figure S2). Interestingly, the two most frequent responses to reference [8] fall into the categories “Genetic association studies” (113 of 366; 30.9%) and “Review articles” (113 of 366; 30.9%). In contrast, only 66 of 366 (18.0%) of the follow-up publications reported on experimental work to investigate functional implications of AMD-associated variants.
To evaluate if these findings could be biased towards reference [8], we analyzed in an identical fashion the citation records available for the previous AMD GWAS published by Fritsche et al. in 2013 [20]. After removing 107 publications which referred to both GWAS [8,20], 337 articles remained for further categorization (Table S2 and Figure S3). Remarkably, the distribution of follow-up activities within the subject groups is highly comparable between the two AMD GWAS reports although the time period between the publication dates of the two studies differed by about three years (Figure 1).
Over 35% (118 of 337) of publications citing Fritsche et al. 2013 [20] were “Review articles”, followed by “Genetic association studies” (111 of 337; 32.9%) and “Experimental studies” (66 of 337; 19.6%).
3.2. Investigation of Defined Loci Based on the Reference Data of Fritsche et al. 2016
Next, we focused on the question whether publications citing the AMD GWAS of Fritsche et al.
2013 [20] or 2016 [8] addressed a defined genomic region. The latest GWAS of Fritsche et al. 2016 reported 34 loci to be AMD-associated with genome-wide significance [8], with these loci serving as reference in our analysis. Referring to Fritsche et al. 2013 [20], a total of 74 publications assigned topically to “Genetic association study” or “Experimental study” investigated a specific locus, whereas this was the case for 49 studies citing Fritsche et al. 2016 [8]. Remarkably, not all analyzed loci harbored variants associated with AMD at genome-wide significance, which results in 58.1% (43/74, Fritsche et al.
2013), respectively 77.6% (38/49, Fritsche et al. 2016) of studies for the analysis of AMD-associated loci. Furthermore, several studies investigated more than one locus, resulting in 55 investigated loci by studies citing Fritsche et al. 2013 [20] and 55 loci for studies referring to Fritsche et al. 2016 [8]
(Figure 2).
Figure 1. Categorized responses of published work citing the AMD GWAS of Fritsche et al. 2013 [20]
and Fritsche et al. 2016 [8]. After quality control (see Methods), 337 publications cited Fritsche et al.
(2013) (inner circle) [20] during the period 2013–2020 and 366 publications referred to Fritsche et al.
(2016) (outer circle) [8] during the period 2016–2020. Articles were manually assigned to one of the five categories: “Genetic association study” (light blue), “Experimental study” (orange), “Clinical study” (grey), “Review article” (yellow), or “Referencing only” (dark blue). Articles citing both AMD GWAS [8,20] were only included in the Fritsche et al. 2016 [8] evaluation. Multi-assignment of categories was allowed for the categories “Genetic association study” and “Experimental study”.
This was the case for seven studies citing Fritsche et al. 2013 [20] and four studies citing Fritsche et al.
2016 [8] (Tables S1 and S2).
Cells 2020, 9, x FOR PEER REVIEW 5 of 13
reference in our analysis. Referring to Fritsche et al. 2013 [20], a total of 74 publications assigned topically to “Genetic association study” or “Experimental study” investigated a specific locus, whereas this was the case for 49 studies citing Fritsche et al. 2016 [8]. Remarkably, not all analyzed loci harbored variants associated with AMD at genome-wide significance, which results in 58.1%
(43/74, Fritsche et al. 2013), respectively 77.6% (38/49, Fritsche et al. 2016) of studies for the analysis of AMD-associated loci. Furthermore, several studies investigated more than one locus, resulting in 55 investigated loci by studies citing Fritsche et al. 2013 [20] and 55 loci for studies referring to Fritsche et al. 2016 [8] (Figure 2).
Figure 2. Investigated loci of studies citing the AMD GWAS of Fritsche et al. 2013 [20] and Fritsche et
al. 2016 [8] Forty three publications referred to Fritsche et al. 2013 (red) [20] and analyzed genomic regions, which are known to be AMD-associated. In addition, 11 of these studies investigated multiple loci resulting in 55 extensively analyzed genomic regions. Similarly, 38 publications referring to Fritsche et al. 2016 (blue) [8] analyzed an AMD-associated locus with 12 articles reporting findings regarding multiple loci. Altogether 55 loci were investigated by studies citing Fritsche et al. 2016 [8].
AMD-associated loci which reached genome-wide significance in the AMD GWAS of Fritsche et al.
2016 [8] for the first time are highlighted in grey shading.
The AMD GWAS of Fritsche et al. 2016 identified 34 AMD-associated loci of which 16 reached genome-wide significance for the first time. Remarkably, only three of these “novel” loci (see
“PILRB/PILRA”, “ABCA1”, and “MMP9”) were investigated further in the four years after publication (Jan 2016–Jul 2020). In contrast, 14 of the 18 loci already known to be AMD-associated before 2016, were studied and reported in at least one publication. Strikingly, most of the studies focused on loci “CFH” and “ARMS2/HTRA1”. Altogether, these observations emphasize that the AMD GWAS sparsely triggered locus-specific experiments. This is particularly true regarding loci identified as genome-wide associated AMD signals for the first time in 2016.
3.3. AMD Genetics and Gene Expression Regulation
Large scale eQTL and TWAS studies are suited to elucidate the potential influence(s) of disease- associated genetic variation on gene expression regulation. Our literature search identified five of these studies with suitable data that considered the results of Fritsche et al. 2016 in their analyses (Table 1). Ratnapriya et al. (2019) were the first to perform eQTL and TWAS analyses in 406 retinal samples [25]. This was followed by a study of Orozco et al. (2020) that calculated eQTL in 121 retinae and additionally in RPE/choroid samples [28]. Both studies included, apart from control retinae, additionally AMD patient samples to a variable extend. Strunz et al. (2020) performed an eQTL mega- analysis using three datasets based on 311 retinal tissue samples of exclusively healthy donor eyes,
Figure 2. Investigated loci of studies citing the AMD GWAS of Fritsche et al. 2013 [20] and Fritsche et al.
2016 [8] Forty three publications referred to Fritsche et al. 2013 (red) [20] and analyzed genomic regions, which are known to be AMD-associated. In addition, 11 of these studies investigated multiple loci resulting in 55 extensively analyzed genomic regions. Similarly, 38 publications referring to Fritsche et al.
2016 (blue) [8] analyzed an AMD-associated locus with 12 articles reporting findings regarding multiple
loci. Altogether 55 loci were investigated by studies citing Fritsche et al. 2016 [8]. AMD-associated loci
which reached genome-wide significance in the AMD GWAS of Fritsche et al. 2016 [8] for the first time
are highlighted in grey shading.
The AMD GWAS of Fritsche et al. 2016 identified 34 AMD-associated loci of which 16 reached genome-wide significance for the first time. Remarkably, only three of these “novel” loci (see
“PILRB/PILRA”, “ABCA1”, and “MMP9”) were investigated further in the four years after publication (Jan 2016–Jul 2020). In contrast, 14 of the 18 loci already known to be AMD-associated before 2016, were studied and reported in at least one publication. Strikingly, most of the studies focused on loci
“CFH” and “ARMS2/HTRA1”. Altogether, these observations emphasize that the AMD GWAS sparsely triggered locus-specific experiments. This is particularly true regarding loci identified as genome-wide associated AMD signals for the first time in 2016.
3.3. AMD Genetics and Gene Expression Regulation
Large scale eQTL and TWAS studies are suited to elucidate the potential influence(s) of disease-associated genetic variation on gene expression regulation. Our literature search identified five of these studies with suitable data that considered the results of Fritsche et al. 2016 in their analyses (Table 1). Ratnapriya et al. (2019) were the first to perform eQTL and TWAS analyses in 406 retinal samples [25]. This was followed by a study of Orozco et al. (2020) that calculated eQTL in 121 retinae and additionally in RPE/choroid samples [28]. Both studies included, apart from control retinae, additionally AMD patient samples to a variable extend. Strunz et al. (2020) performed an eQTL mega-analysis using three datasets based on 311 retinal tissue samples of exclusively healthy donor eyes, including 94 control samples of Ratnapriya et al. (2019) [25,32]. Two further studies targeted gene expression regulation in extraocular tissues including 588 liver tissue samples from four independent studies [31], and various tissues originating from the GTEx database as well as individual genotype data from the IAMDGC sample set [8,33] (Table 1).
The eQTL/TWAS studies identified genetically regulated genes in several AMD-associated loci (Table 1 and Table S3). Strunz et al. (2018) reported eQTL findings from liver tissue in five AMD-associated loci [31]. In retinal tissue, the findings varied from significant correlations in four [25,32] to eleven [28] AMD loci. This variability is not likely to just emerge from methodological differences as e.g., all studies imputed their genotype data from the 1000 Genomes project reference panel [34]. The number of effects identified does not correlate with sample size, as exemplified in the GTEx project [24].
3.4. Gene Expression Regulation is Likely Associated with 15 Known AMD Loci
Findings for gene expression regulation in retinal tissue appear to be variable and highly study dependent. Here, we develop a strategy to identify robust and tissue-related effects. For retinal tissue, we define four categories of genes regulated by AMD-associated genetic variants. Category 1 comprises effects found in at least two retinal studies and in more than two additional tissues other than retina. Categories 2 and 3 require only one of the thresholds defined in category 1 and focus either on effects present predominantly in retina (category 2) or in other tissues (category 3). Category 4 summarizes effects, which either failed to replicate in several retinal datasets or were found in less than three tissues. The latter threshold was set arbitrarily to enable a more focused interpretation of regulatory effects. It should be mentioned that there were partially overlapping samples used in the studies, e.g., the mega-analysis by Strunz et al. (2018) [31] included some GTEx samples which were also enrolled in the subsequent TWAS [33].
In eight of the 34 AMD loci identified in reference [8], subsequent studies detected no gene
expression regulation by AMD-associated genetic variants. Another eleven loci were assigned to
category 4 although no reliable conclusions can be drawn (Table S4). Findings for the remaining 15
known AMD loci allowed classification of the associated genes to categories 1, 2 or 3 (Table 2).
Table 2. Known AMD-associated loci [8] harboring gene expression regulatory effects.
Locus ID
1Category 1 (Retina + Other
Tissues)
Category 2 (Retina)
Category 3
(Predominantly Other Tissues)
CFH - - KCNT2 ( − ), CFH (+/ − ), CFHR1 (+),
CFHR3 (+), ZBTB41(+)
COL8A1 - - NIT2 ( − ), TBC1D23 ( − )
CFI - CFI ( − ) PLA2G12A (+), CASP6 (+)
C2/CFB/SKIV2L - HLA-DQB1 ( − )
2-
PILRB/PILRA PILRA (+), PILRB (+),
STAG3L5P (+) - PMS2P1 ( − ), TSC22D4 (+),
ZCWPW1 (+), NYAP1 ( − )
TNFRSF10A - - TNFRSF10A ( − )
ARMS2/HTRA1 HTRA1 (+/ − ) - PLEKHA1 (+/ − ), ARMS2 ( − ),
BTBD16 (+/ − ), DMBT1 ( − )
RDH5/CD63 - BLOC1S1 (+),
AC009779.3 ( − ) RDH5 ( − )
B3GALTL B3GLCT (+/ − ) - -
CETP - - CETP ( − )
CTRB2/CTRB1 - - CFDP1 ( − )
TMEM97/VTN TMEM199 (+) - POLDIP2 (+)
C3 - - GPR108 (+)
CNN2 - - MED16 (+)
MMP9 - - PLTP (+), SLC12A5 (+/ − )
1Locus ID referring to Fritsche et al. 2016 [8];2Region not covered in TWAS by Strunz et al. (2020) [33]; Gene expression is up- (+) or down- (−) regulated by AMD risk variants.

![Table 2. Known AMD-associated loci [8] harboring gene expression regulatory effects. Locus ID 1 Category 1(Retina + Other Tissues) Category 2(Retina) Category 3](https://thumb-eu.123doks.com/thumbv2/1library_info/3734121.1508846/7.892.119.771.160.641/associated-harboring-expression-regulatory-category-tissues-category-category.webp)
