digitalen Zeitalter 2
Codicology and Palaeography in the Digital Age 2
herausgegeben von | edited by
Franz Fischer, Christiane Fritze, Georg Vogeler
unter Mitarbeit von | in collaboration with
Bernhard Assmann, Malte Rehbein, Patrick Sahle
2010
BoD, Norderstedt
Deutschen Nationalbibliogra�e; detaillierte bibliogra�sche Daten sind im Internet über http://dnb.d-nb.de/ abrufbar.
© 2011
Online-Fassung
Herstellung und Verlag der Druckfassung: Books on Demand GmbH, Norder- stedt 2010
ISBN: 978-3-8423-5032-8
Einbandgestaltung: Johanna Puhl, basierend auf dem Entwurf von Katharina Weber
Satz: Stefanie Mayer und L
ATEX
Kodikologie und Paläographie im Digitalen Zeitalter 2 – Codicology and Palaeography in the Digital Age 2.Hrsg. Franz Fischer, Christiane Fritze, Georg Vogeler, unter Mitarbeit von Bernhard Assmann, Malte Rehbein, Patrick Sahle. Schriften des Instituts für Dokumentologie und Editorik 3. Norderstedt: Books on Demand, 2010. 157–179.
Yaacov Choueka
Abstract
The Cairo Genizah is a collection of hand-written documents containing approximately 350,000 fragments of mainly Jewish texts discovered in the late 19
thcentury. The fragments are today spread out in some 75 libraries and private collections worldwide, but there is an ongoing e�ort to document and catalogue all extant fragments.
Palaeographic information plays a key role in the study of the Genizah collection.
Script style, and–more speci�cally–handwriting, can be used to identify fragments that might originate from the same original work. Such matched fragments, commonly referred to as “joins”, are currently identi�ed manually by experts, and presumably only a small fraction of existing joins have been discovered to date. In this work, we show that automatic handwriting matching functions, obtained from non-speci�c features using a corpus of writing samples, can perform this task quite reliably. In addition, we explore the problem of grouping various Genizah documents by script style, without being provided any prior information about the relevant styles. The automatically obtained grouping agrees, for the most part, with the palaeographic taxonomy. In cases where the method fails, it is due to apparent similarities between related scripts.
Zusammenfassung
Die Geniza aus Kairo ist eine Sammlung von ca. 350.000 handschriftlichen Fragmenten
jüdischer Texte, die im späten 19. Jahrhundert entdeckt wurde. Die Fragmente
werden heute in 75 Bibliotheken und privaten Sammlungen auf der ganzen Welt
aufbewahrt. Eine umfassende Dokumentation und Katalogisierung aller Fragmente ist
in Arbeit. Paläographische Informationen spielen für die Erforschung der Geniza eine
entscheidende Rolle. Schriftstil und Handidenti�zierung können genutzt werden, um
Fragmente der selben Quelle zu identi�zieren. Solche zusammengehörigen Fragmente
(sog. “joins”) müssen zur Zeit manuell von Experten gefunden werden. Es ist
davon auszugehen, dass nur eine kleine Zahl solcher “joins” bis heute entdeckt
werden konnte. In diesem Beitrag sollen zuverlässige Methoden zur automatischen
Identi�kation von Händen vorgestellt werden, die auf unspezi�schen Merkmalen
beruhen und einen Corpus von Schriftbeispielen benutzen. Zusätzlich untersucht der
Beitrag Möglichkeiten, Geniza-Dokumente nach der Schriftart zu klassi�zieren. Diese automatisch erschlossenen Gruppen stimmen größtenteils mit einer paläographischen Taxonomie überein. In einzelnen Fällen scheitert die Methode auf Grund o�ensichtlicher Ähnlichkeiten zwischen den Schriftarten.
1. Introduction
Written text is one of the best sources for understanding historical life. Community documents, religious works, personal letters, and commercial records can all contribute to a better understanding of a given place and time. In this respect, the Cairo Genizah is a unique treasure trove of middle-eastern texts, comprising some 350,000 manuscripts fragments, written mainly in the 10
thto 15
thcenturies. Discovered in the 1890s in the attic of a synagogue in Fostat, an old quarter of Cairo, the Genizah is a large collection of discarded codices, scrolls, and documents. It contains a mix of religious Jewish documents with a smaller proportion of secular texts. With few exceptions, these documents are made of paper or parchment, and the texts are written mainly in Hebrew, Aramaic, and Judeo-Arabic (Arabic language in Hebrew characters), but also in many other languages (including Arabic, Judeo-Spanish, Coptic, Ethiopic, and even one in Chinese).
After its discovery, the Genizah attic was emptied in several stages. The bulk of the material was obtained by Solomon Schechter for Cambridge University, but there were various acquisitions by others, too. By now, the contents have found their way to over 75 libraries and collections around the world. Most of the items recovered from the Cairo Genizah have been micro�lmed and catalogued in the intervening years, but the photographs are of mediocre quality and the data incomplete, with thousands of fragments still not listed in published catalogues.
Genizah documents have had an enormous impact on 20
th-century scholarship in a multitude of �elds, including Bible, rabbinics, liturgy, history, and philology.
The major �nds include fragments of lost works (such as the Hebrew original of the apocryphal Book of Ecclesiasticus), fragments of hitherto unknown works (such as the Damascas Document, later found among the Qumran scrolls), and autographs by famous personages, including the Andalusians Yehuda Halevi (1075–1141) and Maimonides (1138–1204). Genizah research has, for example, transformed our understanding of medieval Mediterranean society and commerce, as evidenced by S. D. Goiten’s monumental �ve-volume work, A Mediterranean Society.
1The philanthropically-funded Friedberg Genizah Project, headquartered in Jerusalem, is in the midst of a multi-year process of digitally photographing (in full color, at
1
See Reif for the history of the Genizah and of Genizah research.
recently rediscovered collection in Geneva, and many smaller collections have already been digitized and comprise about 90,000 images (recto and verso of each fragment).
The digital preservation of another 140,000 fragments of the Taylor-Schechter Genizah Collection at The Cambridge University Library is currently underway. At the same time, everything that is known about the fragments is being extracted from books, catalogues, and scholarly articles. The images and all the information about them are made freely available to researchers online at www.genizah.org.
Late in 2008, the Friedberg Genizah Project embarked on an ambitious e�ort to apply the latest image-processing technology and arti�cial-intelligence research to the analysis of its archive of images, thereby providing scholars of the humanities with new and powerful tools for Genizah research. This work is being carried out in cooperation with computer-science researchers in the �elds of vision and machine learning from Tel Aviv University, the Hebrew University of Jerusalem, and Ben-Gurion University of the Negev and in consultation with palaeographers and Genizah scholars. We report on some aspects of that endeavor here.
Consider that, unfortunately, most of the leaves that were found were not found in their original bound state. Worse, many are fragmentary, whether torn or otherwise mutilated. Pages and fragments from the same work (book, collection, letter, etc.) may have found their way to disparate collections around the world. Some fragments are very di�cult to read, as the ink has faded or the page discolored. Scholars have therefore spent a great deal of time and e�ort on manually rejoining leaves of the same original book or pamphlet, and on piecing together smaller fragments, usually as part of their research in a particular topic or literary work. Throughout the years, scholars have devoted a great deal of time to manually identify such groups of fragments, referred to as joins, often visiting numerous libraries for this purpose. Despite the several thousands of such joins that have already been identi�ed by researchers, much more remains to be done (Lerner and Jerchower). Accordingly, to make the future study of the Genizah more e�cient, there is an urgent need to group the fragments together and to try to reconstruct the original codices as well as possible.
Manual classi�cation is currently the “gold standard” for �nding joins. However this
is not scalable and cannot be applied to the entire corpus. We suggest automatically
identifying candidate joins to be veri�ed by human experts. To this end we
employ modern image-recognition tools such as local descriptors, bag-of-features
representations, and discriminative metric learning techniques, as explained in Section
3 of this chapter. These techniques are modi�ed by applying suitable preprocessing
and by using task-speci�c key-point selection techniques. Furthermore, a bag of visual
keywords approach is taken in which palaeographic samples of various script styles are
used. It can be shown that this step increases performance considerably. The results are presented in Sections 4 and 5.
In addition to the automated join-�nding e�ort, we also study the problem of automatically deriving the script style of Genizah documents. We choose to do it in an unsupervised manner, in which a clustering algorithm groups the various documents, thereby separating the image sets according the script style of each image, with no a priori bias towards a particular classi�cation scheme. Nevertheless, the resulting division is a close match to the standard taxonomy. This aspect of our work is the subject of Section 6.
Section 7 discusses related work and is followed by a brief summary of our achievements.
2. Image Processing and Physical Analysis
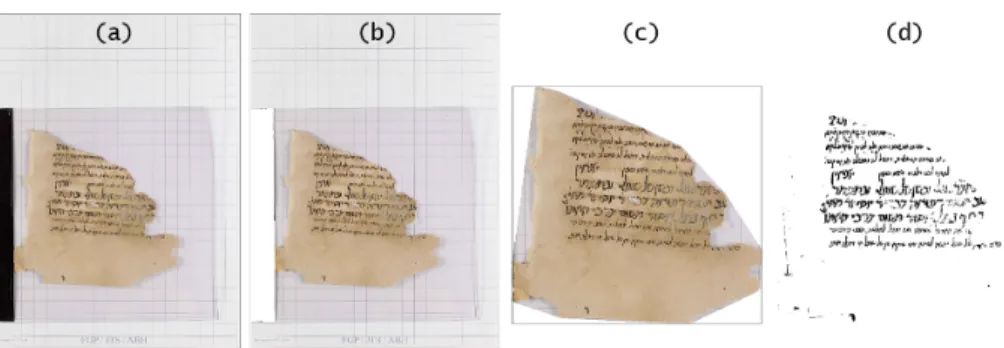
The images supplied by the Friedberg Genizah Project were in the format of 300–600 dpi JPEGs with arbitrarily aligned fragments placed on varying backgrounds. Although uncompressed images of higher resolution are available, we choose not to use these since the type of methods we use do not require higher resolution, and since the compression artifacts can be neglected in comparison to the deformations created to the original fragment over the centuries. An example, which is relatively clean, is shown in Figure 1(a). Many of the images, however, contain super�uous parts for our task, such as paper tags, rulers, color tables, etc. (as in Figure 5). Therefore, a necessary step in our pipeline is preprocessing of the images to separate fragments from the background and to align fragments so the rows of text are horizontal. Then the physical properties of the fragments and of the text lines are measured. Both stages are described in detail in a previous work (Wolf et al.).
2.1. Preprocessing
The goal of the preprocessing stage is to eliminate parts of the images that are irrelevant or may bias the join �nding process, and to prepare the images for the representation stage.
Coarse manual alignment. In a �rst manual stage, the written sides of each
fragment were identi�ed. All the images were then manually rotated as necessary
in multiples of 90°, resulting in alignment in the range of [-45°, 45°] from upright. This
initial rotation prevents the following auto-alignment from rotating documents upside-
down. Both the identi�cation of the written side and the coarse alignment stages are
now being automated; however, the manual e�ort expended for the work reported here
was not great.
Figure 1. Example of a document from the Cairo Genizah (ENA collection). (a) The original image. (b) After removing the black folder. (c) After segmentation (using the convex hull). (d) After binarization and alignment.
Foreground segmentation. The process of separating fragments from the back- ground in the photographs depends on the way the image was captured. At �rst, a machine classi�er was used to identify foreground pixels based on RGB color values or HSV values. To create a region-based segmentation of the fragments, the connected components of the detected foreground pixels are marked, and the convex hull of each component is calculated. By connected component, we mean a contiguous region of foreground pixels; by convex hull, we mean the smallest possible encompassing convex (angles opening inward) polygon. Those steps retain almost all of the relevant parts of the images while excluding most of the background.
Detection and removal of non-relevant components. Labels, ruler, color swatches, and any other non-relevant components that fall in separated regions were manually removed. In some images, especially of large documents, a ruler appears adjacent to the actual fragments and is not separated by the region-segmentation process. The ruler used in the images is of a known type, so we locate it by an automated detector based on correspondence to a reference image of this ruler. The correspondence is done by employing a randomized algorithm, RANSAC (Fischler and Bolles), in combination with scale-invariant feature transform (SIFT) (Lowe) keypoint matching. The region of the detected ruler is segmented by color and removed.
Binarization. The regions detected in the foreground segmentation process are then
binarized, that is, every ink pixel is assigned a value of 1 (representing black), and all
other pixels are assigned a value of 0 (for white). This is done using the auto-binarization
tool of the ImageXpress 9.0 package by Accusoft Pegasus. To cope with failures of the
Pegasus binarization, we also binarized the images using the local threshold set at 0.9
of the local average of the 50x50 patch around each pixel. The �nal binarization is
the pixel-wise AND of those two binarization techniques. Pixels near the fragment boundary are set to 0. A sample result is shown in Figure 1(b). Experiments with more sophisticated binarization methods, such as Bar-Yosef et al. (2007), are ongoing.
Auto-alignment. Each region is automatically rotated so the rows (lines of text) are in the horizontal direction. This is done using a simple method, which is similar to Baird and to Srihari and Govindaraju. For each possible rotation angle we consider the ratio of black (binary value 1) to white (binary value of 0) pixels for each horizontal line.
We then calculate the variance of the projection for each angle, and select the angle for which the variance is the largest.
Physical measurements. The measurements that are being used in fragment matching are characteristics of the text rows, and dimensions of the text bounding box (smallest rectangle containing all the text). The number of text rows, height of the rows and the spaces between the rows are calculated automatically using the projection pro�le of the fragment (the proportion of black in each row of pixels). The text rows themselves are localized at the maxima points of these projections. In addition, the minimal-area bounding box of each fragment is computed. Note that this bounding box need not be axis-aligned.
3. Image Handwriting Representation
We decided to employ a general framework for image representation that has been shown to excel in domains far removed from document processing, namely, a method based on a bag of visual keywords (Dance et al.; Lazebnik, Schmid, and Ponce). The
“signature” of a leaf is based on descriptors collected from local patches in its fragments, centered around key visual locations, called “keypoints”. Such methods follow this pipeline: �rst, keypoints in the image are localized by examining the image locations that contain most visual information. In our case, the pixels of the letters themselves are good candidates for keypoints, while the background pixels are less informative. Next, the local appearance at each such location is encoded as a vector. The entire image is represented by the obtained set of vectors, which in turn is represented as a single vector. This last encoding is based on obtaining a “dictionary” containing representative prototypes of visual keywords and counting, for each image, the frequency of visual keywords that resemble each prototype appearing in the dictionary.
3.1. Keypoint Detection
We detect the image keypoints using the fact that, in Hebrew writing, letters are usually
separated. We start by calculating the connected components (CCs) of the binarized
images. To �lter broken letter parts and dark patches arising from stains and border
artifacts, we compare the size of the CC to the height of the lines, which is estimated
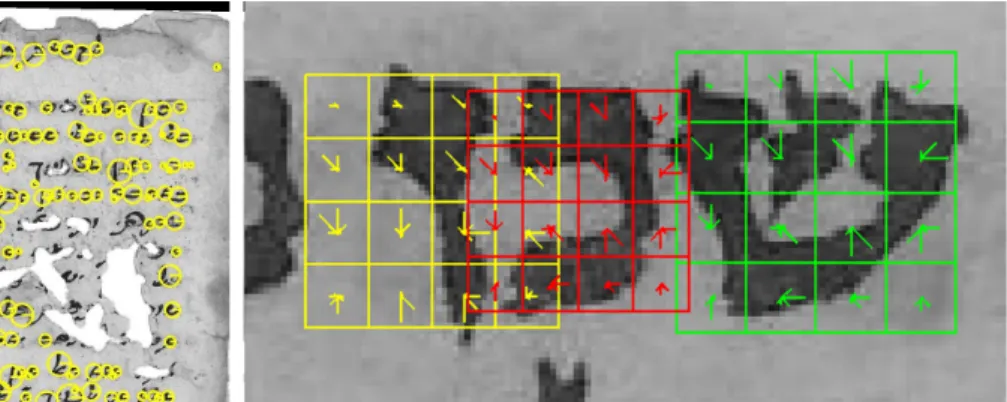
Figure 2. (a) Keypoint detection methods using the proposed CC method. (b) SIFT descriptors of three neighboring detected keypoints.
in a similar fashion to the alignment stage of the previous section. For encoding, each keypoint requires a scale, which is taken as the maximum dimension of the associated CC. Figure 2(a) shows the keypoints found using the SIFT and CC detectors.
3.2. Local Descriptors
Each keypoint is described by a descriptor vector. After experimenting with a large variety of such descriptors, the most popular descriptor, the scale-invariant feature transform (SIFT), was chosen for its accuracy. SIFT (Lowe) encodes histograms of gradients in the image. Figure 2(b) illustrates the application of SIFT to one fragment.
3.3. Dictionary Creation and Vectorization
Bag-of-visual-keyword techniques (Dance et al.) rely on a dictionary that contains a representative selection of descriptors obtained on various interest points. To this end, we �rst set aside a small dataset of 500 documents. We detect keypoints in those documents and subsample a large collection of 100,000 descriptors. These are then clustered by the k-means algorithm to obtain a dictionary of varying sizes.
2The result is a set of prominent prototypes or “visual keywords”; see Figure 3.
2
Clustering algorithms (in machine learning parlance) assign input samples to homogenous groups that
are distinctive from each other. The k-means algorithm is one of the simplest such algorithms. After an
initialization stage, it repeats two steps multiple times: �rst, each sample is assigned to a cluster based on
its distance to all cluster centers, and second, each cluster center is updated to be the mean vector value of
all points that were assigned to this cluster.
Figure 3. Cluster “centers” obtained by taking the average image of all images in each cluster. By clustering (grouping into homogenous groups) a large collection of visual descriptors obtained from random images, a set of distinctive visual keywords or prototypes, referred to as a “dictionary”, is formed.
Note that the cluster centers look blurry, since they stem from averaging multiple images.
Given a dictionary, we employ either histogram-based methods or distance-based methods to encode each manuscript leaf as a vector. In histogram-type vectorization methods (Dance et al.), for each cluster-center in the dictionary, one counts the number of leaf descriptors (in the encoded image) closest to it. The result is a histogram of the descriptors in the encoded leaf with as many bins as the size of the dictionary.
To account for the variability in fragment sizes we normalize the histogram vector to sum to 1, that is, we divide the histogram vector by its sum. Another alternative is to normalize each vector so that its Euclidean norm is 1.
3Distance-based representation techniques (Serre, Wolf, and Poggio) are based on computing the minimum distance to all descriptors of the given leaf for each prototype in the dictionary.
3
The Euclidean, or L2, norm is the square-root of the sum of the squares of each dimension. An L1 norm is
just the sum of absolute values.
Semi-cursive Oriental 61 images I-52 – I-112
Yemenite 42 images I-113 – I-154
Square Spanish 62 images II-1 – II-62
Semi-cursive Spanish 99 images II-63 – II-161
Cursive Spanish 48 images II-162 – II-209
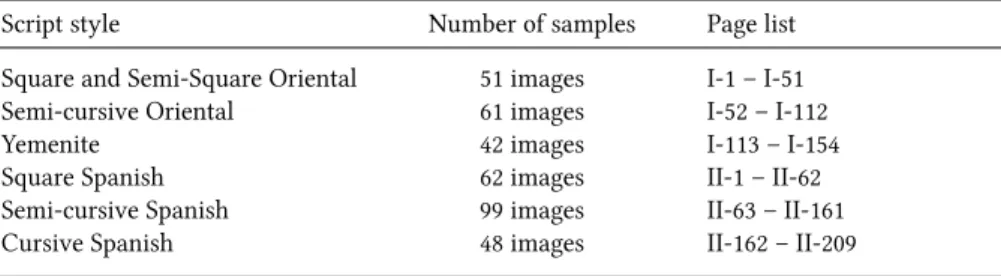
Table 1. The images of document samples used to obtain dictionaries for each script style were taken from the indicated pages of the palaeography volumes I (Beit-Arie, Engel, and Yardeni 1987) and II (Beit-Arie, Engel, and Yardeni 2002).
3.4. Employing Palaeographic Data in the Representation
The resulting representation transforms each image into a vector based on a global dictionary, in which prototypes from various script types are mixed together. Since most Genizah joins contain just one script style, it might be helpful to have multiple dictionaries, each corresponding to one script style. To obtain such dictionaries we apply the procedure described in Section 3.3 repeatedly, each time on documents of the same script.
Sample documents for each style were extracted from the pages of the medieval Hebrew script specimen volumes by Beit-Arie, Engel, and Yardeni (1987, 2002). These volumes contain many examples of medieval Hebrew manuscripts whose provenances are known, and serve as an important tool in Hebrew palaeography. High-quality sample pages of manuscripts are printed side-by-side with professionally-drawn sample letters of the alphabet, based on exemplars from the manuscript. Note that we use the images of the original documents and not the individually hand-drawn letter samples.
The groups of script styles obtained from this collection, and the corresponding page numbers of the collection are listed in Table 1. As can be seen, the major script styles are square script, semi-cursive script, and cursive script. The geographic location in�uences script style, so we extracted Oriental, Yemenite, and Spanish script groups from the same source.
4. Finding Joins
To determine whether two fragments originate from the same manuscript, we compare
their vector representations. The comparison can be performed in several ways and it is
often bene�cial to combine multiple methods.
4.1. Similarity Inference
Focusing on just one representation, each leaf is represented by one vector, for example, by the L2-normalized histogram of keypoint types. For every pair of leaves, we need to determine whether they are from the same join or not. Ideally, we would have a similarity function that would return a high value when two leaves are from the same join, and a low value otherwise. In this ideal case, a threshold value of the similarity function provides a decision cuto� value.
The basic similarity score is obtained by considering, for every two vectors p and q, the similarity derived from their Euclidean distance e
−�p−q�.
In our work we also employ learned similarities. Tailoring similarity measures to available training data by applying learning techniques is gaining popularity. Here, the similarity is to be learned from pairs of samples that are known to belong to the same join or not, and we choose to use a similarity that has been shown to be extremely successful in face-recognition work.
The One Shot Similarity (OSS) (Wolf, Hassner, and Taigman 2008, 2009) is a similarity learning technique designed for the same/not-same problem. Given two vectors p and q, their OSS score is computed by considering a training set of background sample vectors A. This set of vectors contains examples of items di�erent from either p and q (that is, they do not belong in the same class as neither p or q). Note, however, that these training samples are otherwise unlabeled. In our experiments we take the set A to be one split out of the nine splits used for training at each iteration (see Section 4.3).
A measure of the similarity of p and q is then obtained as follows. First, a discriminative model is learned
4with p as a single positive example and A as a set of negative examples. This model is then used to classify the second vector, q, and obtain a classi�cation score. The nature of this score depends on the particular classi�er used. We employ a Linear Discriminant Analysis (LDA) classi�er, and the score is the signed distance of q from the decision boundary learned using p (positive example) and A (negative examples). A second such score is then obtained by repeating the same process with the roles of p and q switched: this time, a model learned with q as the positive example is used to classify p, thus obtaining a second classi�cation score. The
�nal OSS is the sum of these two scores.
4
Classi�ers or learned discriminative models (in machine learning terminology) are functions whose
parameters are �t in a way that they predict the class of a given input. Typically, training samples are given
that are divided into two sets—a positive set and a negative set. Learning then takes place by computing
the function parameters that would assign a positive or a negative label to every training sample similarly
to the given labels. In this paper, we use two classi�cation algorithms: Linear Discriminant Analysis
(LDA), which is a learning method that assumes Gaussian conditional density models, and linear Support
Vector Machine (SVM), a classi�er that strives to separate the positive samples from the negative ones as
much as possible.
a decision value. Moreover, it is bene�cial to combine several similarities. For both these tasks we employ linear support vector machines (SVM), with �xed parameter value C = 1, as was done in Wolf, Hassner, and Taigman (2008) and Wolf, Bileschi, and Meyers (2006).
In the case of one-similarity, the similarity is fed to SVM as a one-dimensional vector and training is performed on all training examples. In this case, SVM just scales the similarities and determines a threshold for classi�cation.
To combine several similarities together we use the SVM output (signed distance from dividing hyperplane) obtained separately from each similarity and construct a vector. This vector is then fed to another SVM. The value output by the last classi�er is our �nal classi�cation score. This method of combining classi�er output is called
“stacking” (Wolpert).
4.3. The Genizah Benchmark
To evaluate the quality of our join-�nding e�orts, we constructed a comprehensive benchmark. Our benchmark, modeled after the LFW face recognition benchmark (Huang et al.), consists of 31,315 leaves, all from the New York (ENA), Paris (AIU), and Jerusalem (JNUL) collections.
The benchmark consists of ten equally sized sets. Each contains 1000 positive pairs of images taken from the same joins, and 2000 negative (non-join) pairs. Care is taken to ensure that no known join appears in more than one set, and that the number of positive pairs taken from one join does not exceed 20.
The ROC (receiver operating characteristic) curve is an accepted form of measuring classi�cation success. It is a graph (see Figure 4) in which the trade-o� between false positive (type I error) results and the recall (true positive) rate is displayed. One would like to obtain perfect recall (identifying all joins) making no false-positive errors, that is, without identifying non-joins as joins. However, in reality the task is challenging and therefore a certain number of false detections is expected for reaching high levels of recall.
To report results, the classi�cation process is repeated 10 times. In each iteration,
nine sets are taken as training, and the results are evaluated on the tenth set. Results are
reported by constructing an ROC curve for all splits together (the outcome value for
each pair is computed when this pair is a testing pair), by computing statistics of the
ROC curve (area under curve, equal error rate, and true positive rate at a certain low
false positive rate) and by recording average recognition rates for the 10 splits.
The most interesting statistic from the practical point of view is the recall at a low- false positive rate. Since there are many theoretical join candidates in the Genizah and since human veri�cation e�ort is limited, any practical join-�nding system should mark non-joins as joins only for a small percentage of these candidates.
4.4. Benchmark Results
We compare the performance of several methods, each based on a separate source of information. Not surprisingly, combining these methods yields the best results.
Subject classi�cation. Over 95% of the digitized Genizah documents have already been manually classi�ed by subject matter. The classi�cation contains categories such as
“Biblical”, “Correspondence”, “Liturgy”, “Arabic tafsir”, “Aramaic translation”, and more.
A similarity of -1 is assigned to pairs of documents with incompatible classi�cations.
A score of +1 is given if the classi�cations are compatible, and a score of 0 when compatibility cannot be determined.
Physical measurements. Eight measurements are considered: number of lines, average line height, standard deviation of line height, average space between lines, standard deviation of interline space, minimal bounding box width, minimal bounding box height, and area of the minimal bounding box. Each one of these measurements is hardly discriminative; however, combined together, they are able to discriminate pretty reliably between joins and random pairs, although not as well as the handwriting approach below.
Handwriting. The handwriting is represented using the bag of visual keywords approach described above. With a global dictionary, the best performing method uses the One-Shot-Similarity (OSS) of Section 4.1.
Multiple script-style dictionaries. The OSS scores obtained from the various dictionaries described in Section 3.4 are combined using the stacking technique of Section 4.2. This method provides a noticeable improvement over the single-dictionary method.
Combined methods. In addition, we combine the handwriting-based scores (single or multiple dictionaries) with the physical score and with the subject-classi�cation score.
The results are summarized in Table 2. It can be seen that the best method, the one
that combines the multiple script-style dictionaries with the physical measurements
and the subject classi�cation, obtains a recall rate of up to 84.5% at a false-positive
rate of 0.1%. The obtained ROC curves are depicted in Figure 4(a). While some of the
improvements seem incremental, they actually make a signi�cant di�erence in the low
false-positive region (Figure 4(b)).
Method Area Equal Mean success TP rate at
under error ± FP rate of
ROC rate standard error 0.001 Subject classi�cation 0.7932 0.3081 0.4935 ± 0.0042 0 Physical measurements 0.9033 0.1843 0.8483 ± 0.0034 0.3596 Single dictionary 0.9557 0.0918 0.9374 ± 0.0048 0.7600 Single dictionary + physical 0.9785 0.0627 0.9566 ± 0.0028 0.8116 Multiple script-style dictionaries 0.9805 0.0564 0.9596 ± 0.0029 0.8053 Multiple dictionaries + physical 0.9830 0.0524 0.9625 ± 0.0028 0.8229 Multiple + physical + subject 0.9888 0.0430 0.9680 ± 0.0024 0.8451
Table 2. Results obtained for various similarity measures and combinations thereof. See text for the description of each method.
Figure 4. ROC curves (true positive rate vs. false positive rate) averaged over 10 folds. The plots compare
the results obtained for the subject classi�cation criterion, physical measurements, a single global
dictionary, multiple script-type dictionaries, and the multiple dictionary approach combined with
physical measurements and subject classi�cation.
5. Newly-Found Joins
We have conducted three sets of examinations to evaluate the value of our system in
�nding joins beyond the settings of the benchmark.
5.1. A Small Benchmark
A set of experiments was performed on an initial benchmark we created for a preliminary work (Wolf et al.). This benchmark was much smaller and contained ten splits each containing 196 positive pairs and 784 negative ones. All images were taken from the ENA and AIU collections. As mentioned above, the negative pairs we work with are not necessarily negative. This does not a�ect the numerical results much, since the fraction of joins is overall low; however, it implies that there may exist unknown joins in the set of leaves that are currently available to us.
We applied our classi�cation technique to all possible pairs of leaves and then looked at the 30 leaf pairs that were not known to be joins, but which received the highest matching scores. The resulting pairs were submitted to a human expert for validation.
The manual labor involved was about 2.5 hours. Eighty percent of the newly detected join candidates were actual joins. Seventeen percent are not joins and one pair could not readily be determined.
5.2. The Geneva Collection
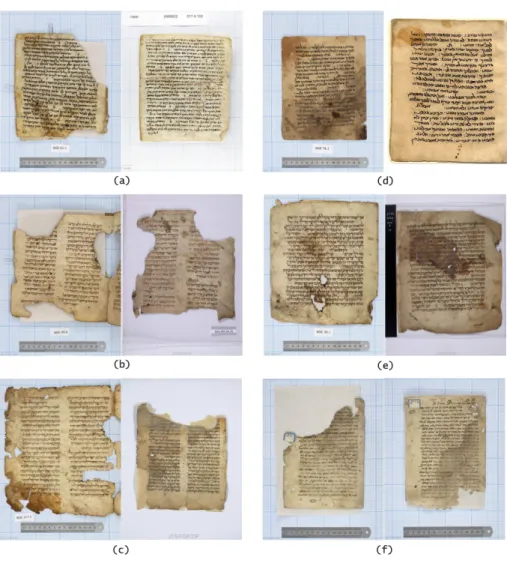
We applied our system to the task of locating joins with the recently recovered Geneva collection. The search for joins using our tools was pretty e�cient, with about 30% of the top 100 matches returned turning out to be actual joins. Figure 5 shows a variety of previously-unknown joins proposed by our method. Example (a) consists of two leaves from the same copy of the Mishnah, written on vellum in Hebrew in a square script. The texts are from di�erent tractates of Order Zeraim. The left page is from the Geneva collection and the right one from the small collection of the Jewish National and University Library (JNUL). Other leaves from the same manuscript are in Oxford and Cambridge.
5Example (b) shows fragments from a codex of the Bible, both from the book of Exodus (Hebrew, square script, on vellum), one from Geneva and the other from the Jewish Theological Seminary (JTS) in New York, part of a batch of 69 fragments from various biblical manuscripts (partially vocalized and with cantillation signs). Such codices are written using a very rigid set of typographic rules, and the identi�cation of such joins based on handwriting is considered extremely challenging. Example (c) is in alternating Hebrew and Aramaic (Targum, square script), one page from Geneva and
5
It turns out that this speci�c automatically-proposed join has already been discovered and is documented
in the very recent Geneva catalogue (Rosenthal), and in the forthcoming Sussmann Catalog.
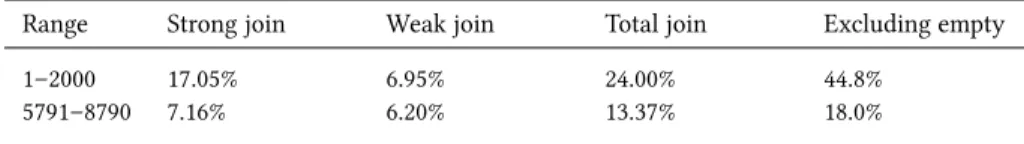
5791–8790 7.16% 6.20% 13.37% 18.0%
Table 3. The percentile of veri�ed new joins out of the candidate joins suggested by our system.
the other from the New York JTS collection. Example (d) shows a join of two leaves of Hebrew liturgical supplications from Geneva and from Pennsylvania, in rabbinic script. Example (e) is from a book of precepts by Saadiah ben Joseph al-Fayyumi, a lost halakhic work by the 10
thcentury gaon. The left page is from the Geneva collection and the right one from JTS. The language is Judeo-Arabic, and the text is written in a square oriental script on vellum. This is a good example of how joins can help identify new fragments from lost works. Once one member of a pair is identi�ed correctly, the identi�cation of the second one is self-determined. Example (f) is from a responsum in Hebrew (rabbinic script). Both leaves are from the Alliance Israelite Universelle Library in Paris, but they are catalogued under di�erent shelfmarks.
5.3. Between Collections
A third set of join-seeking e�orts was conducted on all between-collection pairs of fragments unknown to be joins in the ENA, AIU, and JNUL collections, as well as in smaller European collections of mixed quality.
Note that inter-collection joins are harder for humans to �nd, and are more challenging and rare. The top scoring 9,000 pairs were extracted. After further analysis of catalogue information some additional known pairs were removed resulting in 8,790 pairs. The �rst 2,000 pairs and the last 3,000 fragments of this list were studied. The results are given in Table 3. It separates between “strong” joins, meaning same scribe and same manuscript, and “weak” joins—a join between di�erent manuscripts that seem to be written by the same scribe. In contrast to strong joins, the certainty of a weak join coming from the same document is doubtful, and in many cases should be examined carefully again by an expert. In any event, a weak join represents a good candidate for fragments written by the same scribe, and as such it is considered a success.
As can be seen, 24% of the top discoveries are true joins, mostly strong. More than
13% of the 6
th, 7
th, and 8
ththousands of matches are validated joins. At least half of those
are strong joins. Going over the examples it became apparent that many of the proposed
joins were artifacts caused by normalized vectors arising from empty documents. This
was to be expected, since the benchmark that was used to develop the join-discovery
Figure 5. Each row shows samples from a single cluster. The left three samples are from the main script style
of this cluster, while the two samples to the right are samples of the same cluster that belong to
other script styles. Shown, from top to bottom are clusters 4, 5, 6, 8, 17. Also shown (last row) are
samples of singletons, i.e., documents that were not assigned to any of the clusters.
6. Unsupervised Grouping by Script Style
As we have found, the most distinguishing visual information between the fragments arises from the handwriting. The search for joins focuses on minute di�erences that exist between various scribes. We now turn our attention into grouping the documents by a much coarser distinction: the one between script styles.
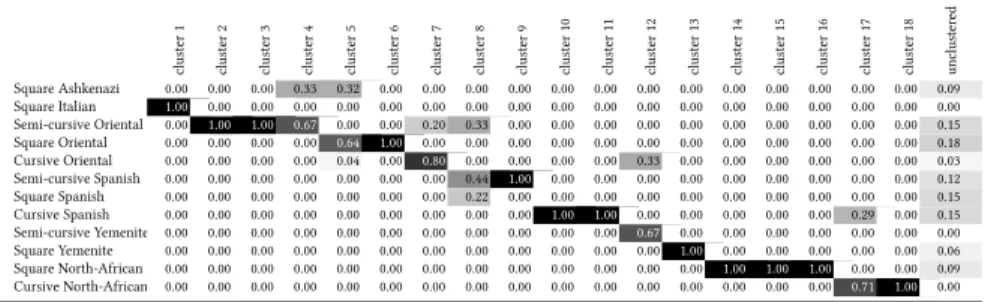
We sample 300 leaves from the Genizah collection that have been classi�ed into one of 12 script styles: “Square Ashkenazi”, “Square Italian”, “Semi-cursive Oriental”,
“Square Oriental”, “Cursive Oriental”, “Semi-cursive Spanish”, “Square Spanish”,
“Cursive Spanish”, “Semi-cursive Yemenite”, “Square Yemenite”, “Square North-African”,
“Cursive North-African”. We then attempt to group the leaves automatically, a process called “clustering”.
We found that conventional clustering algorithms such as k-means work poorly for separating the documents into script-styles. Indeed, k-means focuses on clusters of similar sizes, and might produce unintuitive results for data that is not distributed homogeneously in the parameter space.
We therefore employed the following method that was developed in order to deal with an unknown number of clusters, variability in cluster size, and inhomogeneous data.
First, each leaf is represented as a vector using the bag of visual keyword approach and a single global dictionary. Multiple dictionaries would not be appropriate here, since we would like to obtain the script styles from the data, and not impose it on the representation.
Recall that the vector representing each leaf contains visual “keyword” frequencies.
To eliminate noise and remove spurious correlations between documents, we focus on the most prominent keywords for each document. This is done by replacing each keyword frequency that is less than half of the maximal frequency by 0.
In the next step, we build a graph in which every leaf is a node, and an edge exists between two nodes if the correlation between their modi�ed vectors is above 0.5.
The connected components of this graph are taken as the initial clusters. Connected components that contain single points are referred to below as “singletons” and are considered unclustered.
We then re�ne these clusters by iterating, until convergence, two alternating steps.
In the �rst step, pairs of clusters for which the distances between each cluster’s points
and the cluster mean point are similar to the distances between the two clusters are
merged. In the second step, singletons are assigned to clusters if their distance to the
cluster1 cluster2 cluster3 cluster4 cluster5 cluster6 cluster7 cluster8 cluster9 cluster10 cluster11 cluster12 cluster13 cluster14 cluster15 cluster16 cluster17 cluster18 unclustered
Square Ashkenazi 0.00 0.00 0.00 0.33 0.32 0.00 0.00 0.00 0.00 0.00 0.00 0.00 0.00 0.00 0.00 0.00 0.00 0.00 0.09
Square Italian 1.00 0.00 0.00 0.00 0.00 0.00 0.00 0.00 0.00 0.00 0.00 0.00 0.00 0.00 0.00 0.00 0.00 0.00 0.00
Semi-cursive Oriental 0.00 1.00 1.00 0.67 0.00 0.00 0.20 0.33 0.00 0.00 0.00 0.00 0.00 0.00 0.00 0.00 0.00 0.00 0.15
Square Oriental 0.00 0.00 0.00 0.00 0.64 1.00 0.00 0.00 0.00 0.00 0.00 0.00 0.00 0.00 0.00 0.00 0.00 0.00 0.18
Cursive Oriental 0.00 0.00 0.00 0.00 0.04 0.00 0.80 0.00 0.00 0.00 0.00 0.33 0.00 0.00 0.00 0.00 0.00 0.00 0.03
Semi-cursive Spanish 0.00 0.00 0.00 0.00 0.00 0.00 0.00 0.44 1.00 0.00 0.00 0.00 0.00 0.00 0.00 0.00 0.00 0.00 0.12
Square Spanish 0.00 0.00 0.00 0.00 0.00 0.00 0.00 0.22 0.00 0.00 0.00 0.00 0.00 0.00 0.00 0.00 0.00 0.00 0.15
Cursive Spanish 0.00 0.00 0.00 0.00 0.00 0.00 0.00 0.00 0.00 1.00 1.00 0.00 0.00 0.00 0.00 0.00 0.29 0.00 0.15
Semi-cursive Yemenite 0.00 0.00 0.00 0.00 0.00 0.00 0.00 0.00 0.00 0.00 0.00 0.67 0.00 0.00 0.00 0.00 0.00 0.00 0.00
Square Yemenite 0.00 0.00 0.00 0.00 0.00 0.00 0.00 0.00 0.00 0.00 0.00 0.00 1.00 0.00 0.00 0.00 0.00 0.00 0.06
Square North-African 0.00 0.00 0.00 0.00 0.00 0.00 0.00 0.00 0.00 0.00 0.00 0.00 0.00 1.00 1.00 1.00 0.00 0.00 0.09
Cursive North-African 0.00 0.00 0.00 0.00 0.00 0.00 0.00 0.00 0.00 0.00 0.00 0.00 0.00 0.00 0.00 0.00 0.71 1.00 0.00