• Keine Ergebnisse gefunden

Codicology and Palaeography in the Digital Age 4

N/A
N/A
Protected

Academic year: 2021

Aktie "Codicology and Palaeography in the Digital Age 4"

Copied!
15
0
0

Wird geladen.... (Jetzt Volltext ansehen)

Volltext

(1)

Schriften des Instituts für Dokumentologie und Editorik — Band 11

Kodikologie und Paläographie im digitalen Zeitalter 4

Codicology and Palaeography in the Digital Age 4

herausgegeben von | edited by

Hannah Busch, Franz Fischer, Patrick Sahle

unter Mitarbeit von | in collaboration with

Bernhard Assmann, Philipp Hegel, Celia Krause

2017

BoD, Norderstedt

(2)

Deutschen Nationalbibliografie; detaillierte bibliografische Daten sind im Internet über http://dnb.d-nb.de/ abrufbar.

Digitale Parallelfassung der gedruckten Publikation zur Archivierung im Kölner Universitäts-Publikations-Server (KUPS). Stand 4. September 2017.

Diese Publikation wurde im Rahmen des Projektes eCodicology (Förderkennzeichen 01UG1350A-C) mit Mitteln des Bundesministeriums für Bildung und Forschung (BMBF) gefördert.

Publication realised within the project eCodicology (funding code 01UG1350A-C) with financial resources of the German Federal Ministry of Research and Education (BMBF).

2017

Herstellung und Verlag: Books on Demand GmbH, Norderstedt ISBN: 978-3-7448-3877-1

Einbandgestaltung: Julia Sorouri, basierend auf Vorarbeiten von Johanna Puhl und Katharina Weber; Coverbild nach einer Vorlage von Swati Chandna.

Satz: LuaTEX und Bernhard Assmann

(3)

Kodikologie und Paläographie im Digitalen Zeitalter 4 – Codicology and Palaeography in the Digital Age 4.Hrsg. Hannah Busch, Franz Fischer und Patrick Sahle, unter Mitarbeit von Bernhard Assmann, Philipp Hegel und Celia Krause. Schriften des Instituts für Dokumentologie und Editorik 11. Norderstedt: Books on Demand, 2017. 137–149.
Automatable Annotations – Image Processing and Machine Learning for Script in 3D and 2D with

GigaMesh

Bartosz Bogacz, Hubert Mara

Abstract

Libraries, archives and museums hold vast numbers of objects with script in 3D such as inscriptions, coins, and seals, which provide valuable insights into the history of humanity. Cuneiform tablets in particular provide access to information on more than three millennia BC. Since these clay tablets require an extensive examination for transcription, we developed the modular GigaMesh software framework to provide high-contrast visualization of tablets captured with 3D acquisiton techniques. This framework was extended to provide digital drawings exported as XML-based Scalable Vector Graphics (SVG), which are the fundamental input of our approach inspired by machine-learning techniques based on the principle of word spotting. This results in a versatile symbol-spotting algorithm to retrieve graphical elements from drawings enabling automated annotations. Through data homogenization, we achieve com- patibility to digitally born manual drawings, as well as to retro-digitized drawings.

The latter are found in large Open Access databases, e.g. provided by the Cuneiform Database Library Initiative (CDLI). Ongoing and future work concerns the adaptation of filtering and graphical query techniques for two-dimensional raster images widely used within Digital Humanities research.

Zusammenfassung

Bibliotheken, Archive und Museen besitzen große Mengen an Objekten mit Schrift in 3D, wie z.B. Inschriften, Münzen und Siegelabdrücke. Diese erlauben wertvolle Einblicke in die Geschichte der Menschheit. Das gilt besonders für Keilschrifttafeln, die Informationen über dreieinhalb Jahrtausende vor der Geburt Christi übertragen.

Weil diese Tontafeln eine gründliche Untersuchung, Umzeichung und Umschrift

benötigen, haben wir das modulare GigaMesh Software Framework entwickelt, das

eine kontrastreiche Darstellung von 3D-vermessenen Tafeln in hoher Auflösung

ermöglicht. GigaMesh bietet dazu die Möglichkeit zum Export von Vektorzeichnun-

gen im XML-basierten Scalable Vector Graphics (SVG) Dateiformat. Diese Dateien

stellen die Datenbasis für Verfahren aus dem Bereich des Machine Learning dar, die

wiederum auf dem Prinzip des Word Spotting beruhen. Daraus ist eine graphische

(4)

Suchmöglichkeit von Symbolen bzw. Zeichen entstanden, mit der eine automatische Annotation möglich wird. Durch die Homogenisierung von Dateiformaten konnten wir eine Kompatibilität mit weiteren Quellen in Form von digital erstellten Handzeich- nungen und Retro-Digitalisaten erreichen. Letztere stehen online per Open Access z.B. im Rahmen der Cuneiform Database Library Initiative (CDLI) zur Verfügung.

Laufende und künftige Arbeiten sind die Adaption unserer graphischen Verfahren für zweidimensionale Rasterbilder, wie sie in den Digital Humanities häufig zu finden sind.

1 Introduction

The analysis of historical texts begins with the analysis of a document as an object.

Therefore, any Digital Humanities (DH) project has its roots in digitized documents which are often represented by images consisting of a regular grid of colored pixels.

These images are typically gathered using a flatbed scanner or digital photo cameras (Effinger et al. 2003). The latter are often combined with minimalistic 3D acquisiton using a laser-line to remove distortions such as bent pages of an open book. A well- known setup is known as the Grazer Buchtisch, which was invented by the engineer Manfred Mayer within a project of the University Library of Graz in Austria.

Other optical imaging methods capture even more information on the materiality of an object using 3D acquisiton. These systems are used ever more frequently in many disciplines within the Humanities due to increasing image resolution and decreasing costs of purchase. Especially in the field of Archaeology, a photogrammetric approach known as Structure from Motion (SfM) (Ullman 1979) is widely applied to simple objects such as ceramics (Mara and Portl 2013), coins (Boss et al. 2012) as well as more complex inscriptions (Krömker 2013) based on the principles of structured light and stereo analysis (Sablatnig and Menard 1992). However, there are many other means of 3D acquisiton such as Reflectance Transformation Imaging (RTI) (Woodham 1980) and the KU Leuven Dome (Willems et al. 2005).

All those metal, stone, or clay objects play an important role for research within

the Humanities because they are comparatively robust by design and can transport

information over long periods of time. These artifacts are well preserved and their

content, i.e. the text on their surface, can be read by illuminating the surface using a

light source to show characters as shadows on a bright background. Therefore, at first

glance, photography appears to be a reasonable choice for documentation. However, a

photo provides only one projection using one position of the light source. Furthermore,

the surface of an object can have an arbitrary color (e.g. due to stains) camouflaging

the Script in 3D. Even for relatively well-preserved objects, the information represented

geometrically can become difficult to grasp.

(5)

Automatable Annotations 139

Generalizing the challenges posed by surfaces weathered, worn, or otherwise damaged, we have to capture the geometry of an object in order to then remove the camouflaging colors in a first step. In a second step, the traces intentional left by a human being have to be illustrated using images without illumination which show meaningful features via color contrast. Such surface features can be determined by computing local curvature measures (Bertrand et al. 1848) like the Gaussian curvature (Gauss et al. 2007) which separates concave and convex areas. A second important measure is the mean curvature which can be used to determine the smoothness or roughness of an object area, e.g. to separate patterns of fracture from those intentionally left by craftspeople.

Measuring local curvature on surfaces is done in principle similarly to filtering raster images for which a multitude of edge detectors (or filter operators) was de- veloped during the last five decades of Computer Science reserach, starting with the Roberts-Cross-Operator (Roberts 1963). In essence, those filters assume an image as a height map (cf. Digital Terrain Model) in which each gray-value of a pixel corresponds to height. By computing changes of heights in local environments, these filters often approximate curvature measures of numerically computed derivatives, i.e. gradient images, where meaningful features such as apses can be detected. Computing deriv- atives, however, comes with the drawback of smoothing an image, i.e. it overlooks details a human can detect. Furthermore, assumptions such as having 8 pixels as a neighbor to a central pixel or one height value per grid cell do not exist in 3D surface data.

Therefore, we choose to use numeric integration to prevent the smoothing effects of traditional derivative filters. Similarly to computing the area below a one-dimensional curve embedded in two-dimensional space, we compute the volume below our two- dimensional surfaces embedded in a three-dimensional space. This is achieved by considering each triangle of our 3D model as a top surface of a truncated prism extruded along an arbitrary axis, e.g. in z-direction, and as having arbitrary bottom surfaces, e.g. defined by the xy-plane. The sum off all volumes of all such prisms is the volume enclosed by the surface, that is, of our object acquired by a 3D scanner.

The moment we start computing subsets of the prism volumes, we start computing

local curvatures. Choosing a sphere as the border of the subset makes the computed

volume invariant against rotation. As we incorporate elements along the surface,

the vertices of the triangular mesh become the centers of the spheres. The radius

of the sphere is the parameter for the sensitivity of this volume integral invariant

filter responding most perceptibly when the size of the feature is close to the radius

of the sphere. To cover features of different sizes and multiple scales, we compute

volume subsets for different radii. Therefore, this method is called Multi-Scale Integral

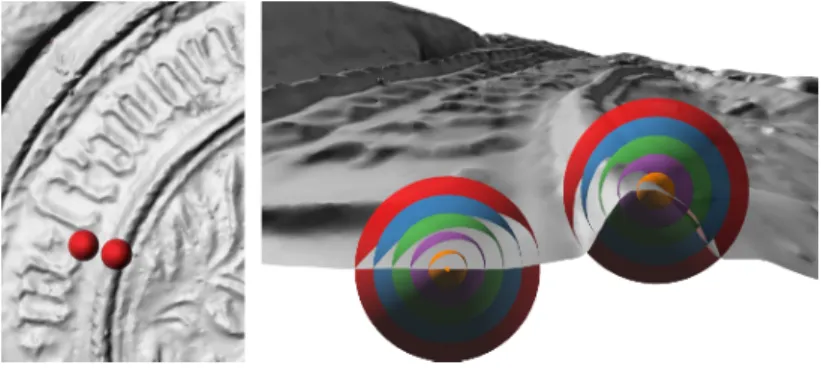
Invariant (MSII) filtering (Mara 2012). Figure 1 shows two sets of concentric spheres

for five different scales of a medieval seal. The integrated volume lies between 49% to

(6)

Figure 1: Triangular mesh describing the surface of a medieval seal in gray color (left). Detailed view shows two sets of concentric spheres used for local volume integration, where the volume below the gray surface and the sphere is computed (right).

51% for each sphere of the left set as each sphere is approximately cut in two halves by the surface. The integrated volume for the other set ranges from 40% of the volume of the smallest sphere to 22% of the volume for the largest sphere.

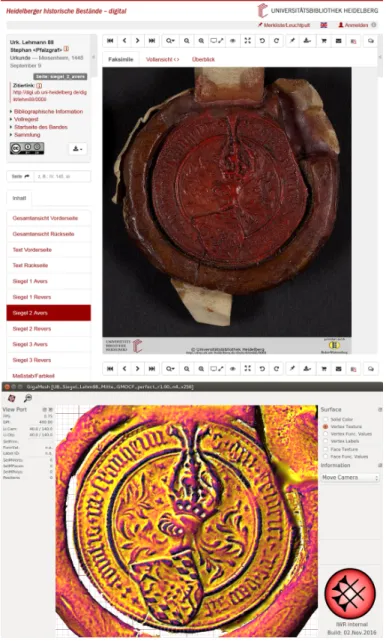
These ratios are a so-called feature vectors (or functions), which span a multi- dimensional feature space. Within this space, we can compute distance measures to a specific reference object, e.g. selected by pin-pointing a feature with a mouse click in a Graphical User Interface (GUI). Typical measures are the Euclidean distance or the Manhattan distance, but additional measures such as cross- or auto-correlation can also be applied. Considering the wide range of objects we encountered, there is always one suitable distance for each type of object. Finally, the distance measure is mapped to a color ramp, leading to a high contrast rendering of an object in false colors. Figure 2 shows a comparison of a photograph of a medieval seal and a 3D visualisation using a color ramp based on the colors of the Morgenstemming (Geissbuehler and Lasser 2013) which is suitable for printing in gray-scale and for colorblind persons.

Having determined features such as Characters in 3D, the next step is the feature extraction as a digital line drawing which can be made searchable by an approach based on a machine-learning technique known as word spotting (Kołcz et al. 2000).

We illustrate this approach on one of the largest and oldest text sources known as cuneiform tablets.

2 From script in 3d to searchable line-drawings

For more than three millenia, scribes wrote documents using cuneiform script in the

ancient Middle East (Soden 1994). Characters were typically written on clay tablets

by imprinting a rectangular stylus and leaving a wedge (lat. cuneus) shaped trace, i.e.

(7)

Automatable Annotations 141

Figure 2: Comparison of a photograph of a seal and a visualization of its 3D measurement data. This is the

2

nd

seal of the document Lehmann 88, 9. September 1448, Meisenheim am Glan.

(8)

Figure 3: A cuneiform tablet and its tracing.

triangular markings, as shown on the left-hand side in figure 2. As clay was always cheaply and easily available, those capable of writing could produce a multitude of documents. Therefore, the content of cuneiform tablets ranges from mundane shopping lists to treaties between empires. There are hundreds of thousands of clay tablets preserved until this day thanks to their comparatively robust nature. In total, the amount of texts written in cuneiform script is comparable to those written in Latin or Ancient Greek. Important documents are, for example, the epic of Gilgamesh (Maul 2014), the declaration of the Cyrus Cylinder or the Rosetta Stone.

The increased availability of 3D representations and the tremendous amounts of 2D raster images of documents demand reliable methods for automated processing to keep tedious tasks such as drawing a cuneiform tablet to a minimum. This leads to the development of our GigaMesh software framework, which provides high-contrast images of 3D models (short for 3D measurement data) for improved readability of script in 3D. The GigaMesh framework was tested on numerous clay tablets with cuneiform script. The visualizations are achieved with the novel Multi-Scale Integral Invariant (MSII) filtering algorithm, applicable on the irregular triangular meshes describing a surface in 3D (Mara et al. 2010).

In a second step, our software framework was expanded by a line-tracing algorithm

to extract features such as characters as Scalable Vector Graphics (SVG) (Mara and

Krömker 2013), which describe the shape of extracted elements using the eXtensible

Markup Language (XML). These two initial steps were also adapted for 2D raster

images using Dual Integral Invariant filtering and the potrace algorithm to homogenize

3D and 2D sources (Bogacz et al. 2015a). The latter, in this case, are retro-digitized

(9)

Automatable Annotations 143

manual drawings of cuneiform tablets. As experts today often use vector drawing tools such as Inkscape or Computer Aided Design (CAD) software, we have a third digital source, which can easily be exported in the SVG format. This makes digital manual drawings compatible with the automated drawings computed from 3D models using GigaMesh.

Having three homogenized digital data sources, the consequent step is the pro- cessing of SVG files to find repetitive patterns, e.g. groups of wedges of cuneiform script or any other graphical representation consisting of sets of prototypical elements.

This work is done by application of machine-learning (ML) methods inspired by the idea of word spotting well known from the domain of Handwritten Text Recognition (HTR). This enables us to query a database of SVG files by using a drawing of a search word, character, or any other graphical element. In addition to the search capability, this approach enables future applications such as (i) automated annotation of characters, which is (ii) not limited to any writing system and can be used in other domains such as iconography or heraldry. Results are shown for synthetic data and real world data from more than six years of interdisciplinary projects at the interface between Applied Computer Sciences and the Humanities.

The Cuneiform Digital Library Initiative (CDLI) incorporates a number of projects aimed at cataloging cuneiform documents and making them available online as tracings, 2D images and sometimes as transliterations. However, none of these documents are annotated. Transliterations and translations are shown side-by-side with the photographs and retro-digitized scans of cuneiform tablets. For uninitiated readers it is impossible to correctly match the translated symbols to the respective symbols on the document.

Annotating documents manually is an arduous task that can only be performed by experts. The approach presented here can reduce the workload of annotating documents by repeating annotations on similar symbols automatically. This is ac- complished by symbol-spotting, a concept similar to word spotting but extended to include graphical symbols. Symbols similar to those already annotated are spotted in a database and the respective annotations are applied. This approach reduces the workload to annotate documents. Each annotation is applied to the entire group of similar symbols, each time significantly reducing the symbols to be annotated.

Figure 3 shows an annotated tablet with similar repeating symbols.

The unification of data sources requires a shared conceptual model of cuneiform wedges. The simplest possible description still allowing distinctive characters is a triangle representing the wedge-head with three associated arms representing the wedge arms. We use this description as our common shared model.

In born-digital tablets, our input data is a set of spline paths which we call strokes.

These strokes are expressed as XML entities in the SVG source data. Wedges consist

of up to six strokes, three for the triangular wedge-head and three for the wedge-arms.

(10)

Figure 4: Annotation of a symbol (upper right corner) and automated repeated annotation of similar symbols (other markers).

We detect wedge-heads by finding three strokes intersecting pairwise. Wedge-arms are any additional strokes that intersect any stroke of the wedge-head.

This description of wedges is general enough to match all wedges on born-digital cuneiform transcriptions. It also matches many more structures which are not proper wedges, as can be seen in figure 4. One difficulty is that cuneiform script is written very densely. Strokes from different wedges may intersect and create false positives when analysing wedge heads or arms.

We meet this challenge by assuming that most strokes have been drawn to indicate proper wedges. We assign strokes to detected possible wedges. Strokes cannot fill two roles at once. Either (i) a stroke is assigned to be one of the three sides of a wedge-head or (ii) it is assigned to be one of the three wedge-arms. Strokes can also be left unused if drawn by error on a transcription. This task can be expressed as an optimal assignment problem, facilitating a computationally efficient solution.

Subsequent steps in our workflow and in a typical machine-learning workflow

require a fixed size feature representing cuneiform characters. We model wedges using

keypoints deriving directly from the way wedges are drawn in transcriptions. The

(11)

Automatable Annotations 145

Figure 5: Wedge hypotheses (left), assignment of strokes to hypothesized triangles (mid) and final keypoint model of accepted modeled wedges (right).

keypoint feature-vector models wedges using six two-dimensional points, as shown in figure 4. The first three points are the vertices of the three strokes intersecting pairwise, forming the wedge-head. The last three points are endpoints of the wedge-arms at- tached to the respective wedge vertices. This model is described in detail in Bogacz et al. (2015b). We also successfully utilized this representation in a machine-learning workflow to extract repeated cuneiform patterns (Bogacz and Mara 2016a).

Part-structured models provide means to describe geometrical objects by the rela- tionships of their components. Howe (2015) has presented a part-structured model based on point centers and a tree of flexible, spring-like links inbetween. Additionally, he also introduced highly efficient means of these models’ parallel computation. We adapt and model cuneiform symbols using a part-structured model of wedges connec- ted by spring-like links. The generalized distance transform (GDT) employed by Howe is modified to use the Euclidean distance between the keypoint feature-vectors of wedges. Symbol-spotting is then performed by transforming the document regarding the query and computing the distance field (Bogacz et al. 2016b). Then, local minima are possible locations of the query symbol in the document. Figure 5 shows exemplary key stages of this process.

We evaluated our methods on a dataset of two cuneiform tablets line-traced by assyriologists. A vector graphics editor has been used to create born-digital SVG files.

Each of these tablets contain approximately 500 identifiable cuneiform characters on each side.

We performed retrieval queries by example, using the set of segmented cuneiform

characters. For each result returned, an expert decided whether it belonged to the

class of the query and tagged it with either true positive or false positive. Additionally,

we evaluated our method against the work of Rothacker et. al. (2013) on word spotting

on Latin script. Their work on cuneiform detection (Rothacker et al. 2015) could

not be evaluated since elevation data, as used in their approach, was not available

(12)

Figure 6: Balls and flexible springs model (left), keypoints of the document to be searched (middle) and resulting distance field after transformation (right).

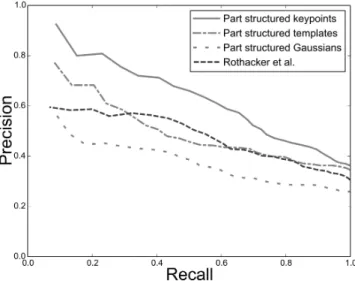
Figure 7: Precision and recall of the symbol-spotting approach presented here. We compare our different wedge models and the work by Rothacker et al. on word spotting.

for our dataset. In general, there currently is no standardized dataset of cuneiform tablets for learning tasks available by means of Open Access in a manner the George Washington letters are for Latin word spotting. Figure 6 shows the precision-recall plot of our three part structured algorithms including the approach as suggested by Rothacker et. al. (2015).

In addition to the keypoint model, we also experimented with other wedge models and evaluated these on our dataset. The native keypoint model presented the best performance and outperformed the state of the art in Latin word spotting significantly.

Our approach has been modeled to exploit the geometrical properties of cuneiform

(13)

Automatable Annotations 147

and works on vector data instead of raster data. Therefore, the search word for a query is actually a drawing, which leads to an automatable annotation by querying all possible cuneiform signs as found in symbol lists (Borger 2010).

3 Conclusion and outlook

Even in the case of cuneiform tablets belonging to the oldest important text sources existing in vast numbers, there were virtually no computational methods available to assist crucial tasks like examination or transcription when we began developing digital tools for the analysis of clay tablets in 2009. In the first phase, we established a workflow for digitization of the clay tablets using optical metrology resulting in high- resolution 3D models. Afterwards, we developed a robust algorithm using Multi-Scale Integral Invariant filtering for high-contrast visualizations of Script in 3D, which was implemented as modular GigaMesh software framework. Due to its versatile nature forgoing any inclusion of a-priori knowledge and complex parametrization, we could successfully apply the framework to e.g. Roman inscriptions and weathered medieval Jewish epitaphs. For the latter, we could recover approximately 20% of additional characters which had been declared to be lost forever.

The second phase outlined in this article utilizes digital drawings of the cuneiform computed from 3D measurement data. These drawings are XML-based Scalable Vector Graphics and act as an interface to manual drawings which can be incorporated by homogenization for both retro-digitized and born-digital data. Using a minimalistic geometric model (template) to describe the wedges, i.e. radical element of cuneiform script, we were able to establish search capabilities based on word spotting. Our search algorithm enables the user to query by drawing instead of query by some sort of encoded symbol. Therefore, we can treat any cuneiform writing independent of any underlying language. This is a key factor as there are several major languages originating from at least three different language families sharing cuneiform script.

Together with diverse local dialects and challenges like the UD.GAL.NUN signs (Zand 2016), it appears that techniques commonly applied in Computational Linguistics are prone to become isolated applications.

The whole processing workflow from high-resolution 3D measurement data to

searchable drawings contains many modules to be reused for other projects within

the Digital Humanities. Filtering techniques are adaptable to the domain of raster

images provided by photographs and flatbed scanners. Examples are the anistropic

filtering of rubbings of ancient Sutra chiseled into stone walls (Mara et al. 2009),

material structures, i.e. unique stripe patterns of Papyri (Mara and Sänger 2013), or

the improvement and vectorization of faded George Washington letters (Mara 2016).

(14)

The latter will be a future challenge to adopt the symbol-spotting of cuneiform – which is actually a handwriting in 3D – to handwriting with pen and paper in 2D.

Bibliography

Bertrand, Joseph, C.F. Diquet, and Victor Puiseux. “Démonstration d’un théorème de Gauss.”

Journal de Mathématiques 13 (1848). 80–90.

Bogacz, Bartosz and Hubert Mara. “Clustering Fundamental Spatial n-Grams for Large Scale Cuneiform Search.” Proceedings of the International Conference on Document Analysis Systems (DAS) 2016.

Bogacz, Bartosz, Judith Massa, and Hubert Mara. “Homogenization of 2D & 3D Document Formats for Cuneiform Script Analysis.” Proceedings of the 3

rd

Conference on Historical Document Imaging and Processing (HIP) 2015.

Bogacz, Bartosz, Nicholas Howe, and Hubert Mara. “Segmentation Free Spotting of Cunei- form using Part Structured Models.” International Conference on Frontiers in Handwriting Recognition (ICFHR) 2016.

Bogacz, Bartosz, Michael Gertz, and Hubert Mara. “Character retrieval of vectorized cuneiform script.” International Conference on Document Analysis and Recognition 2015.

Borger, Rykle. “Mesopotamisches Zeichenlexikon.” Alter Orient und Altes Testament – Veröf- fentlichungen zur Kultur und Geschichte des Alten Orients und des Alten Testaments (AOAT).

Volume 305, 2

nd

edition. Münster: Ugarit-Verlag, 2010.

Boss, Martin, Bernd Breuckmann, and Matthias Göbbels. “Auf der Spurensuche des Handwerks zum Prägen antiker Münzen unter Einsatz von höchstaufgelösten digitalen 2D- und 3D- Modellen.” Konferenzband EVA 2012 Berlin Elektronische Medien & Kunst, Kultur, Historie.

2012. 73-78.

CDLI: Cuneiform Digital Library Initiative. <http://cdli.ucla.edu/>.

Effinger, Maria, Eberhard Pietzsch, and Ulrike Spyra. “Digitalisierung und Erschließung spätmit- telalterlicher Bilderhandschriften aus der Bibliotheca Palatina ein Kooperationsprojekt der Universitätsbibliothek und des Kunsthistorischen Instituts der Universität Heidelberg.”

In Thaller, Manfred (ed.). Fundus – Forum für Geschichte und ihre Quellen 5 (2003). 62-89.

Gauss, Carl Friedrich, James Caddall Morehead, and Adam Miller Hiltebeitel. General Investiga- tions of Curved Surfaces of 1827 and 1825. Eberdeen: Watchmaker Publishing, 2007.

Geissbuehler, Matthias, and Theo Lasser. “How to display data by color schemes compatible with red-green color perception deficiencies.” Optics express 21.8 (2013). 9862-9874.

Howe, Nicholas R. “Inkball models for character localization and out-of-vocabulary word spot- ting.” Proceedings of the International Conference on Document Analysis and Recognition 2015.

Kołcz, Aleksander. et al. “A line-oriented approach to word spotting in hand-written documents.”

Pattern Analysis & Applications 3.2 (2000). 153–168.

Krömker, Susanne. “Neue Methoden zur besseren Lesbarkeit mittelalterlicher Grabsteine am Beispiel des Heiligen Sands in Worms.” Die SchUM-Gemeinden Speyer - Worms - Mainz.

Auf dem Weg zum Welterbe. Regensburg: Schnell & Steiner, 2013. 167–188.

(15)

Automatable Annotations 149

Mara, Hubert, Jan Hering, and Susanne Krömker. “GPU based optical character transcription for ancient inscription recognition.” Proceedings of the 15th International Conference on Virtual Systems and Multimedia (VSMM) 2009.

Mara, Hubert et al. “GigaMesh and Gilgamesh - 3D Multi Scale Integral Invariant Cuneiform Character Extraction.” Proceedings of the International Symposium on Virtual Reality, Archaeology and Cultural Heritage (VAST) 2010. 131–138.

Mara, Hubert and Susanne Krömker. “Vectorization of 3D-Characters by Integral Invariant Filtering of High-Resolution Triangular Meshes.” Proceedings International Conference on Document Analysis and Recognition (ICDAR) 2013. 62-66.

Mara, Hubert, and Julia Portl. “Acquisition and Documentation of Vessels using High-Resolution 3D-Scanners.” In Trinkl, E. (ed.). Neue interdisziplinäre Dokumentations- und Visualis- ierungsmethoden, Corpus Vasorum Antiquorum Österreich, Beiheft 1. Wien: Verlag der Österreichischen Akademie der Wissenschaften, 2013. 25–40.

Mara, Hubert, and Patrick Sänger. “Präzise Bestimmung von Materialstrukturen bei Papyri mit 3D-Messtechnik.” Zeitschrift für Papyrologie und Epigraphik (ZPE) 185 (2013). 195–199.

Mara, Hubert. “Multi-Scale Integral Invariants for Robust Character Extraction from Irregular Polygon Mesh Data.” PhD thesis at Heidelberg University, 2012. Online/Open Access.

URN: urn:nbn:de:bsz:16-heidok-138909.

Mara, Hubert. “Made in the humanities: Dual integral invariants for efficient edge detection.”

it–Information Technology 58.2 (2016). 89–96.

Maul, Stefan M. “Das Gilgamesch-Epos”. 6

th

edition. Munich: C.H.Beck, 2014.

Roberts, Lawrence G. “Machine Perception Of Three-Dimensional Solids.” Massachusetts Institute of Technology, Lincoln Laboratory, 1963.

Rothacker, Leonard et al. “Retrieving cuneiform structures in a segmentation-free word spotting framework.” Workshop on Historical Document Imaging and Processing 2015.

Rothacker, Leonard, Marcal Rusinol, and Gernot A. Fink. “Bag-of-features HMMs for segmentation-free word spotting in handwritten documents.” International Conference on Document Analysis and Recognition 2013.

Sablatnig, Robert, and Christian Menard. “Stereo and Structured Light as Acquisition Methods in the Field of Archaeology”. Mustererkennung (1992). 398–404.

Soden, Wolfram von. “The ancient Orient: an introduction to the study of the ancient Near East.” Wm. B. Eerdmans Publishing Co., 1994.

Ullman, Shimon. “The Interpretation of Structure from Motion.” Proceedings of the Royal Society B 203.1153 (1979). 405–426.

Willems, Geert et al. “Easy and cost-effective cuneiform digitizing.” 6th International Symposium on Virtual Reality, Archaeology and Cultural Heritage (VAST, 2005.

Woodham, Robert J. “Photometric method for determining surface orientation from multiple images.” Optical Engineering 19.1 (1980). 139-144.

Zand, Kamran Vincent. “UD.GAL.NUN”. Reallexikon der Assyriologie und Vorderasiatischen

Archäologie 14, 2016. 271-273.

Abbildung

Figure 1: Triangular mesh describing the surface of a medieval seal in gray color (left)
Figure 2: Comparison of a photograph of a seal and a visualization of its 3D measurement data
Figure 4: Annotation of a symbol (upper right corner) and automated repeated annotation of similar symbols (other markers).
Figure 5: Wedge hypotheses (left), assignment of strokes to hypothesized triangles (mid) and final keypoint model of accepted modeled wedges (right).
+2

Referenzen

ÄHNLICHE DOKUMENTE

Potentials and Limits’ focused on the interaction of palaeography, the study of ancient and medieval documents, and computerised tools developed for the analysis of digital images

Potentials and Limits’ focused on the interaction of palaeography, the study of ancient and medieval documents, and computerised tools developed for the analysis of digital images

However, if the document contains a great amount of background clutter or faded- out characters it is not guaranteed that the �rst image shows the degraded writing, since the

This paper presents the digital manipulation in three sections: in the First, I will share the methodology of uncovering obscured writing; next, I will discuss what was discovered

Furthermore, the quanti�ed scribal features of his writings will be used to de�ne the phased genesis of his most notable work, the oldest manuscript of the so-called Croniken van

La version 1 de Formes à toucher a été mise en ligne début juillet 2013 et o�re déjà un panorama d’usages possible du tactile dans le domaine de l’annotation de

Mit Abschluss der ersten Phase liegt seit 2012 die Software Wasserzeichen Studio als »Backend« für die dezentrale Eingabe von Wasserzeichen und ihrer Metadaten vor, die daneben

Si è tenuto conto, invece, dell’insieme delle testimonianze provenienti sicuramente dal territorio nella parte di sintesi che precede il catalogo e che o�re un quadro su�-