Kodikologie und Paläographie im digitalen Zeitalter 4
Codicology and Palaeography in the Digital Age 4
herausgegeben von | edited by
Hannah Busch, Franz Fischer, Patrick Sahle
unter Mitarbeit von | in collaboration with
Bernhard Assmann, Philipp Hegel, Celia Krause
2017
BoD, Norderstedt
Deutschen Nationalbibliografie; detaillierte bibliografische Daten sind im Internet über http://dnb.d-nb.de/ abrufbar.
Digitale Parallelfassung der gedruckten Publikation zur Archivierung im Kölner Universitäts-Publikations-Server (KUPS). Stand 4. September 2017.
Diese Publikation wurde im Rahmen des Projektes eCodicology (Förderkennzeichen 01UG1350A-C) mit Mitteln des Bundesministeriums für Bildung und Forschung (BMBF) gefördert.
Publication realised within the project eCodicology (funding code 01UG1350A-C) with financial resources of the German Federal Ministry of Research and Education (BMBF).
2017
Herstellung und Verlag: Books on Demand GmbH, Norderstedt ISBN: 978-3-7448-3877-1
Einbandgestaltung: Julia Sorouri, basierend auf Vorarbeiten von Johanna Puhl und Katharina Weber; Coverbild nach einer Vorlage von Swati Chandna.
Satz: LuaTEX und Bernhard Assmann
Kodikologie und Paläographie im Digitalen Zeitalter 4 – Codicology and Palaeography in the Digital Age 4.Hrsg. Hannah Busch, Franz Fischer und Patrick Sahle, unter Mitarbeit von Bernhard Assmann, Philipp Hegel und Celia Krause. Schriften des Instituts für Dokumentologie und Editorik 11. Norderstedt: Books on Demand, 2017. 3–23.
Library
Hannah Busch, Swati Chandna
Abstract
Through digitisation a large amount of mediaeval manuscript collection became publicly available, but the resources in time and human attention have not grown in proportion of digitised sources. Therefore, the question arises whether the computer can help to evaluate larger amounts of material like this. The project eCodicology has focused its research on the detection and measuring of the different layout features by using methods of pattern recognition for further analyses. The present paper gives insights into the developed software, SWATI – the Software Workflow for the Automatic Tagging of Images, and CodiVis, a visualisation framework for high-dimensional data sets, and how it can help the codicologist to explore the massive amount of heterogeneous datasets. The paper also focusses the various challenges, such as uncertain data due to irregularities and missing information in the manuscript’s catalogues, as well as the accuracy of the image processing results.
Zusammenfassung
Durch die Digitalisierung sind zahlreiche Sammlungen mittelalterlicher Handschrif- ten öffentlich zugänglich gemacht worden, jedoch sind weder die zeitlichen noch die personellen Möglichkeiten der Erforschung proportional dazu gewachsen. Daher stellt sich die Frage, inwiefern der Computer bei der Auswertung des Materials helfen kann. Das Projekt eCodicology hat seine Forschungsarbeit auf die Erkennung und Vermessung verschiedener makro- und mikrostruktureller Gestaltungsmerkmale der mittelalterlichen Seite gerichtet, indem es Methoden der Mustererkennung nutzt.
Der vorliegende Artikel stellt die im Rahmen des Projektes entwickelte Software
SWATI – Software Workflow for the Automatic Tagging of Images und CodiVis, ein
Visualisierungsframework für hochdimensionales Datenmaterial, vor und erklärt,
wie die entwickelte Software die Erforschung großer heterogener Datenbestände
ermöglichen soll. Darüber hinaus richtet der Artikel sein Blickfeld auch auf die zahlrei-
chen Herausforderungen die durch Unsicherheiten im Datenmaterial hervorgerufen
werden sowie auf die Präzision der Ergebnisse der Bildverarbeitung.
1 Page Layout and Mediaeval Manuscripts
A written page is more than text, it is not just a carrier of textual information, and the distribution of layout elements on the page can tell us more about the history of our written cultural heritage.
The page layout is defined as the collocation of rectangles containing graphical signs on the page surface of a book (Agati 2009, 219), the ratio between page and its content. The page layout aims to structure the codex and is designed according to the function of the text or book, to guarantee legibility. This is something everyone can notice by leafing through the codex. The appearance of a mediaeval book is very aesthetic, so it is hard to believe that it was realised by individual visual judgement, but research suggests the mediaeval artisans were artists rather than pure technicians. The question arises if they followed geometric rules, algorithms or a canon of proportions.
This question has been the base of many layout studies concerning Latin and Greek manuscripts and it has been proven that at least in the most important scriptoria instructions had to be followed (see Maniaci 1995).
That the layout of the mediaeval manuscript page is not left to chance is proven by the existence of formulae of proportions as well (see Agati 2009 and Maniaci 1995).
A formula of proportions can be defined as a coherent unit of standards, which – causing an organic bond between the different elements of the page – aims to extract the construction of a schema of ruling.
1The formula must be un-ambiguous and universal, it must not give values but proportions between the different features of the page and it is sufficient to give essential parameters to obtain all layout features (Maniaci 1995, 17). The validation of a formula can only be proven if one applies a flexible approach with a tolerance range, not to forget that a manuscript is still an artisanal work.
Concerning the connection of geometrics and page layout, it is sufficient to observe the ratio between the two sides of the rectangle to understand if a notable rectangle is involved. Notable rectangles can be defined by proportions which converge the aesthetic ideals of antiquity and exhibit certain geometrical proportions between their long and the short side. Two of those antique visions of aesthetics are the Golden Ratio and the Pythagorean Theorem.
The theory is proven by certain recurring relations, like the relation between the height of the text block and the width of the page: h=L, or the width of the text block is equal to the page height divided in half l=H/2 (Agati 2009, 227ff.).
To verify such theories, analysis of large corpora of mediaeval manuscripts is required. Measuring hundreds and thousands of manuscript pages manually is a
1 “Insieme coerente di norme che, istituendo un legame organico tra i diversi elementi della pagina, mira ad agevolare la costruzione di uno schema di rigatura univocamente definito” (see formulas of S. Remi Parisinus, lat. 11884, sec. IX., in Agati 2009, 219)
very time consuming undertaking and the error rate of human work increases with every page measured. The availability of digitised manuscripts offers the possibility to utilise computers to collect and process the data. The project eCodicology
2is one attempt to analyse digital reproductions of mediaeval manuscripts with the help of computers by using methods of pattern recognition to take a closer look at the layout and perform statistical analysis of the newly gained data.
2 Introducing eCodicology
The idea of eCodicology was born during the digitisation project Virtuelles Skriptorium St. Matthias which digitised, reunited and published the manuscripts and fragments from the mediaeval library of the Benedictine Abbey of St. Matthias in Trier. Its basis is the idea of thinking further than just giving access to digitised manuscripts and catalogues.
3For almost twenty years mediaeval manuscripts and other historical written documents have been digitised. Initially, digitisation focused on extremely important, famous, or rare manuscripts with the objective of making them accessible to the broad public and to ensure a better protection of the original. When high resolution scanners and digital single lens reflex cameras became more and more affordable, entire collections made their way into digital libraries.
New technologies and inventions have since been increasing the quality of the image data. It was time to take a next step and to rescue the digital collections from gathering dusty: digitised manuscripts can open new ways of research beyond better accessibility for researchers. The special research question of eCodicology focuses on generating new descriptive metadata by automatic analyses of digital images:
is it possible to add missing or more precise information on the page layout in the catalogues by using the computer? And to which extent can these data help to support a historical research interest? To answer these questions, the project eCodicology tries to measure and analyse the page layout of mediaeval manuscripts by using the machine.
It has been the idea of eCodicology to establish a workflow for the automatic tagging of mediaeval manuscript layout features, including an algorithm library for pre-processing and feature extraction steps and transformation into the common format of the virtual scriptorium’s database.
4Furthermore, it experiments with the
2 eCodicologyis a joint research project of the Technical University of Darmstadt, the Trier Center for Digital Humanities and the Karlsruhe Institute of Technology. The project has been funded by the Federal Ministry of Education and Research (BMBF) under the agreement O1UG1350A-C from 2013-2016.
3 The searchable database including the digital representations is available online via http://www.
stmatthias.uni-trier.de and the TextGrid Repository (TextGrid).
4 For the projectVirtuelles Skriptorium St. Matthias, a MySQL database was set up. Since DFG-Viewer is used for the presentation of the facsimile’s XML, information meeting the substandard METS was
exploration of these data by performing statistical analyses and by providing an interactive visualisation framework.
eCodicology follows the quantitative approach to codicology which was first de- veloped by a group of French and Italian researchers in the 1970s. Instead of focusing their research on the description of single manuscripts, the group Quanticod
5star- ted to collect data for entire collections by building corpora and measuring similar features of the page layout. By manually collecting results of measurements and counting layout features on which statistical evaluations were performed, trends in manuscript production could be proven and displayed with graphic charts. Thus, it was possible to make statements about the character density on pages with a one or two column layout, about the significance of marginal space, and about temporary and regional tendencies concerning the mise-en-page of mediaeval manuscripts. Geo- metrical calculations could tell if the aspect ratio was influenced by norms like the Golden Ratio, well known from paintings, or the Pythagorean Theorem.
For the codicologist, the objective of working with the “masses” is to learn more about the materiality of manuscripts and their manufacturing process and to build a typology of manuscripts in a synchronic and diachronic perspective. For unknown reasons, the group of researchers stopped working on their projects just when com- puters developed more potential and, most importantly became affordable for research institutions and scholars.
3 SWATI – Software Workflow for the Automatic Tagging of Images
6In order to analyse a large quantity of digitised manuscripts one has to figure out how to prepare and to handle the image data, which, in the case of the St. Matthias scriptorium, are not less than five terabytes.
Therefore, the first goal of the project was to develop a complete workflow for automatic detection and tagging of layout features of mediaeval manuscript pages.
Thus, high level interdisciplinary collaboration between humanist research and com- puter science was demanded. A first list consisting of properties which describe the page layout of a handwritten page containing all kinds of textual and pictorial elements such as highlighting, initials, decoration, changes of script had to be reduced
required. Descriptive metadata is stored according to the TEI P5 guidelines (TEI-C).
5 Notably, Ezio Ornato, Carla Bozzolo, Denis Muzerelle, Dominique Coq. A collection of essays about their research has been published by Ezio Ornato in 1997.
6 For a more detailed description of theeCodicologyworkflow, especially from the technical perspective, please see Chandna et al. 2015. The software will be available as a JAR file which can be executed directly from the command line. It will also contain plugins for ImageJ to test them with single images at a time. It will be published via theeCodicologyproject page
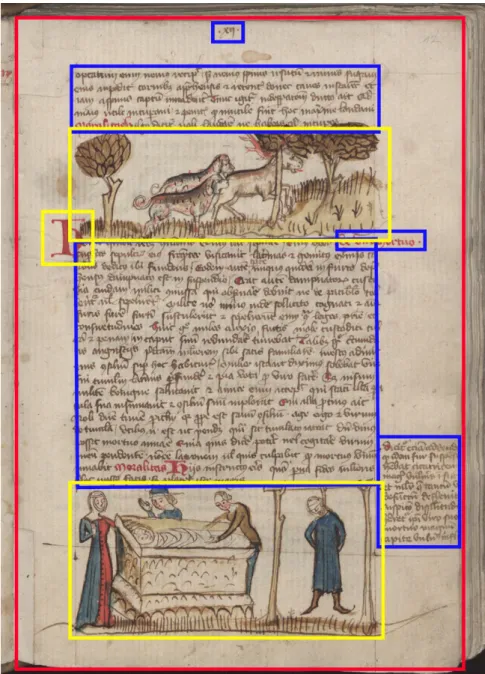
to initially three main features (page size, textual spaces, pictorial spaces) to ensure precision and quality of the automatically collected data (see fig. 1).
To extract the layout features of the manuscripts, different steps and applications of various image processing methods are necessary, starting with a pre-processing consisting of colour calibration, spatial calibration, noise removal, and scaling. Be- cause image data themselves do not classify as codicological information, a schema was developed to translate them into such. However, the difficulties already begin when taking a closer look at the source language of the images.
First, one might have to deal with different resolutions due to the usage of different scanners or digitisation methods. Overhead scanners or constructions using DSLR cameras are most common. For the project Virtuelles Skriptorium St. Matthias, two different overhead scanners were used, one with a resolution of 300 dpi, the second with 400 dpi. This problem not only affects the resolution of the image, but also colour fastness. Different scanners have different colour spaces, which make digitised images dependent on scanner hardware. A software supposed to deal with any image must be able to adjust such variances. Using a colour checker and scale during the digitisation process is indispensable. Furthermore, images also have some noise that has to be removed or minimised by special filters. To analyse a larger amount of images, it is useful and possible to scale them down before processing them in order to reduce the time needed without distorting the results.
After these necessary pre-processing steps, an object segmentation can be per- formed. Object segmentation refers to the process which divides the image into its constituent objects and the background. The complexity of this process varies with factors like inconsistent intensity of the background, variations of intensity within the foreground objects, and clustering of foreground objects. The variations within the foreground might cause over-segmentation. For the eCodicology project, algorithms are trained to detect the borders of the page to measure the page size, textual space, and pictorial space. The training is done with the ImageJ Software (ImageJ) and MOA/WEKA (MOA), and utilises various machine learning algorithms, e.g. Bayes classifiers, Rules based classifiers, Tree classifiers, Lazy classifiers.
In the next step, the feature extraction, the relevant quantitative parameters are extracted using the images obtained in the segmentation step. The individual identific- ation of segmented foreground objects can be done by labelling connected components.
Pixels which belong to the same connected component are assigned the same label and, similarly, the pixels belonging to a different connected component are given different labels. Assuming the correct segmentation, the area of the manuscript page is extracted by counting the number of pixels corresponding to the foreground label.
We extracted other features like page height and page width or text height and text
width by reducing the foreground objects to arcs that are one pixel in width.
Figure 1: Example of a mediaeval manuscript page from Hs. 1108/55 4° (StB/StA Trier) showing the layout features page space, written space, pictorial space.
After pre-processing the images by calibration, filtering, and scaling, and success- fully processing the results of the feature extraction, the data gathered can be included in the catalogue and used for statistical evaluation. This is the actual translation of image data into codicological information.
7The results are saved in XML according to the TEI P5 (TEI-C) guidelines. For eCodicology, a TEI P5 conformant ODD-based metadata schema has been designed that allows storing metrical data in the manu- script description.
8The resulting XML files are machine-readable and can be accessed by the software R (R-Project) or any other software to perform statistical calculations.
4 The Technique you use Influences the Result you get
The technical choice determines the possibilities of the scientific evaluation. This not only affects the quality of the scans. Some codicological features, such as watermarks, which have so far not been taken into consideration systematically in the catalogues for the library of St. Matthias, can only be detected on images produced with special techniques such as thermographic scans. Since no such scans are available for our corpus, we are not able to provide these extra information in the catalogue. But we can add more exact measurements for the page size of every single page, which is already a progress since traditional format data such as Folio, Quarto, and Octave can often be found in catalogues and the use of these descriptive data does not seem to be completely coherent. By using the computer, measurements of central tendencies and dispersion, maximum and minimum values in millimetre (or any other measuring unit) can be determined. It is correct, as Ezio Ornato stated in 1991, that quantitative codicology can be done with a simple sheet of graph paper (see Ornato 1991), but the larger the number of objects and variables, the more useful the application of a computer. The same is true for statistical evaluation. Furthermore, the computer is able to do this kind of work more precisely.
The structural data of a text correspond to the data extracted from digital images of mediaeval manuscript pages. In both cases, we see entities that are syntactically evaluated. A text consists of single elements such as chapters, words, and letters. Di- gital texts can even be enriched by paratexts or meta-information such as annotations or authority files. A digital image usually consists of single components or patterns that are machine readable based on their colour value, shape, or size. Humans see colour fields, shapes, symbols, or figures. Computers “see” pixels, hue, saturation, and brightness. Equal to text or language, the image of a manuscript page can be regarded as a sign system that can be processed and disassembled into its constituent components.
7 For a more detailed description of the project’s workflow see Chandna et al. 2015.
8 ODD (One Document Does it All) files can easily be converted into various XML schema languages by using ROMA, a tool developed for generating customised TEI data.
But it is not only complex layout features which can be detected by a computer and used to answer codicological research questions. In the case of St. Matthias, fragments have been removed from the codices and collected in special archive boxes.
However, in some cases it has not been recorded which fragments are related to which codex. Thus, two groups of fragments are given: one with recorded relations, and one without these data. Even apparently simple data such as height and width of page or text might help to reconstruct the original codicological connection.
Apart from first experiments with statistical evaluation mostly concerning the certainty of manual and automatic measurements, changes in page size, comparison of manuscripts written on paper and parchment, and the general book production of centuries , the project utilised a second approach to make the data talk: high- dimensional data visualisation.
9With the help of CodiVis
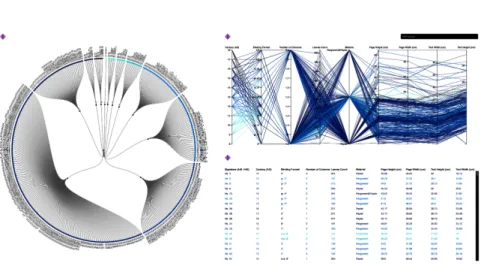
10, a visualisation concept was developed to facilitate explorations of correlations in the abstract feature space of large sets of digitised mediaeval manuscripts (see fig. 2).
It combines two visualisation techniques in order to overcome the shortcomings of the single visualisation methods. In the first technique, manuscripts are clustered according to their bibliographic metadata and represented in a radial tree. This gives a quick overview of the whole data set. The polar node-link diagram was chosen over the Cartesian system because it combines the advantage of using space more efficiently while it has a pleasing aesthetic” (Heer et al. 2010, 64). In the second technique, bibliographic metadata are further linked to the macro- and micro- structural features in the parallel coordinate view, which is a relatively compact way to show many variables simultaneously. Interactive changes in the radial tree are automatically reflected in the parallel coordinate view. CodiVis consists of two major views: the manuscript explorer view, and the manuscript page explorer view. The former provides the users with an overview enabling access to the manuscripts and mean measurements of the layout features at a single glance. Users can select a subset of manuscripts which they want to explore and see the details in the manuscript page explorer view (see figs. 4-6). The latter allows the users to access the details of manuscript pages and measurements of layout features regarding each individual page. Both views help answering various domain specific questions such as “How is the distribution of manuscripts over the course of a particular century?” or “How did manuscripts develop over time with respect to the writing material?” The visualisation concept may show the potential of analyses by enabling quick exploration of “big humanities data”.
9 Human imagination reaches its limits when it comes to imagining more than three dimensions. To visualize high dimensional data sufficiently, visualisation or data have to be adjusted; therefore, special visualisation techniques have been designed.
10 For a more detailed presentation of the CodiVis framework see Chandna et al. 2016 and 2017.
Figure 2: The image shows the main view of CodiVis with the list of all manuscripts in form of a radial tree on the left, the parallel coordinates with different parameters at the top right and at the bottom right the list of manuscripts with bibliographical metadata.
While statistical analyses can already reduce the necessary efforts for codicologists to extract knowledge, important information related to micro-level features might get lost as a result of research based on certain parameters and questions to the material.
The development of an effective workflow for image processing and interactive visualisation techniques has been one task of the project and is an important con- tribution to the future of codicological studies in the digital age since it allows the researcher to better handle digitised corpora.
However, realistically we also need to evaluate the accuracy of our results to see if they are worth all the effort. In the beginning of the project, we had an ambitious list
11of codicological features hopefully to be detected automatically, which soon was reduced to areas of page size, textual space, and pictorial space (see fig. 1). The position of the textual space, which is recorded with coordinates (by combining TEI and SVG), can possibly give us information about the number of columns or glosses.
In addition, the number of lines can be estimated. Irregularities such as highlighting, change of script, or initials influence the result. Currently, roughly 15 features – most of them assigned to one of the three main groups – are extracted on each page.
11 The first list included different levels of text structure like headings, incipits/explicits, page title, page numbers, neumes, glosses, underlining, ruling, miniatures, initials, highlighting.
N. Feature
1 Number of Pages 2 Mean Colour Value 3 Page Width 4 Page Height
5 Upper Left Corner Coordinates of Page 6 Relative Measurements of Page 7 Text Width
8 Text Height 9 Text Areas
10 Upper Left Corner Coordinates of Text 11 Relative Measurements of Text 12 Pictorial Width
13 Pictorial Height
14 Number of Pictorial Areas
15 Upper Left Corner Coordinates of Pictures 16 Relative Measurements of Pictures
Table 1: Layout features of the mediaeval manuscripts extracted by SWATI
Bibliographic metadata Values
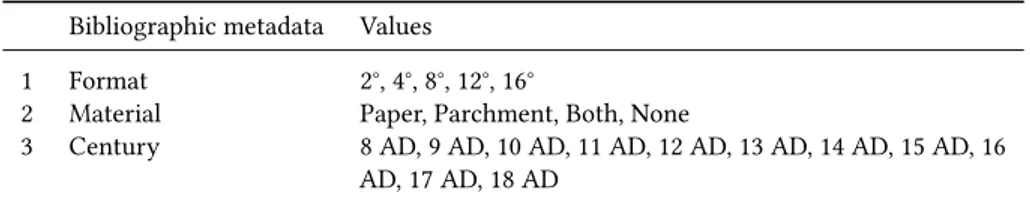
1 Format 2°, 4°, 8°, 12°, 16°
2 Material Paper, Parchment, Both, None
3 Century 8 AD, 9 AD, 10 AD, 11 AD, 12 AD, 13 AD, 14 AD, 15 AD, 16 AD, 17 AD, 18 AD
Table 2: Bibliographic metadata of the mediaeval manuscripts from St. Matthias database.
5 Challenges for Humanities Scholars: The Catalogue you have Influences the Result you get.
The stock of manuscripts of the library of St. Matthias is very heterogeneous, it is a collection bringing together the results of text production from the early 8
thcentury to the 18
thcentury, with different origins throughout Europe.
The lowest common property is that, at one point, they all became part of the St.
Matthias library which only started to add a notice of possession to the codices in the second half of the 12
thcentury.
12With the occupation of Trier by French troops
12 The first church in honor of the first bishops of Trier, St. Valerius and St. Eucharius, has its origins in
at the end of the 18
thcentury, and the resulting secularization, most monasteries in the region were closed and the stock of the library of St. Matthias dispersed to various places around the world. Fortunately, the major part of the about 500 manuscripts remained in Trier and became part of the newly founded City library, today Stadtbibliothek und Stadtarchiv Weberbach. Today, a second, big part of the stock is part of the library of the episcopal seminary, the Bischöfliches Priesterseminar Trier.
In 2014, the project Virtuelles Scriptorium St. Matthias, funded by the DFG, com- pleted the virtual reconstruction of the mediaeval stock of the monastic library; in this context, a digital catalogue database was set up and published and the roughly 440 codices which remained in Trier were digitised (Virtuelles Skriptorium). For the database the project team was able to revert to four catalogues describing the manuscripts of St. Matthias: in 1931, Josef Montebaur published a commented copy of the catalogue from 1530, Max Keuffer and Gottfried Kentenich catalogued the ma- nuscripts stored at the city library – including the heritage of St. Matthias – between 1888 and 1931, the manuscripts of the episcopal library were registered by Jakob Marx in 1912. Unfortunately, none of the works contains detailed descriptions of each codex, neither regarding the content, nor the codicological description. The codicolo- gist working with quantitative methods, thus, cannot refer to detailed preliminary studies. Furthermore, they have to deal with uncertain data. As mentioned above, the library stock of St. Matthias is very heterogeneous, including texts of various genres, proveniences, and centuries, often even bound together in one volume. In some cases, information about provenience, content, miniatures, and dating have been registered, but even though many of the manuscripts from the St. Matthias scriptorium or other scriptoria in the region have colophons, they have not been taken into account while cataloguing.
Almost every manuscript has been assigned a date of production; in most cases a century, in around 125 cases – especially for composite manuscripts – two or more centuries, and in a few cases even a more precise dating, the majority of those roughly 100 manuscripts is from the 15
thcentury, the oldest manuscript is dated to the year AD 719. One might assume this to be a good basis to perform further analyses, but the dating is one of the project’s major analytical uncertainties. It remains unclear what the date refers to: is it the point of production, acquisition, or registration in a catalogue. A parchment manuscript was probably not produced in the 18
thcentury (although it is technically possible) and paper cannot appear before the 14
thcentury.
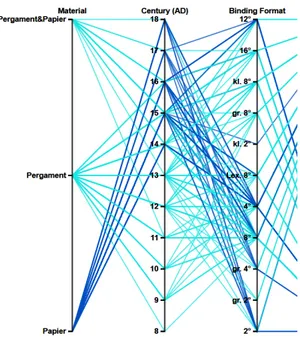
As seen in figure 3, the latest pure parchment codex is dated to the 16
thcentury. In miscellaneous manuscripts with both materials, parchment can be found up to the
the second half of the fifth century. Between 970 and 980, the monastery became part of the Benedictine order, with this change at the latest a library must have been established.
18
thcentury. Especially in the case of multiple-text manuscripts we do not have information dating single contents in the catalogue, sometimes there is no dating at all. A similar problem surfaces when taking a closer look at the assigned formats. In most cases in the St. Matthias database, information about the format was taken from the shelf marks, all codes of the codices from the city library end with an indication such as 4°, 8° or 16°. According to codicological description, this little detail should provide information about the number of times a piece of parchment has been folded and indicates the resultant number of leaves, but in this case most of the format indications have been added by the librarian. Therefore, it is more probable that the indication refers to the spine height of each book according to printing conventions to give information on which type of bookshelf in the depot a book can be found.
13Thus, we cannot easily rely on that information either to perform analysis.
Working with the book or page size implies another problem: like in many other libraries, it was quite common to rebind the manuscripts and to cut them to a new standardized size in order to match the style of the institution. Cutting processes mostly have not been registered but taking a closer look at the book the cutting edges are clearly visible which makes it very difficult to perform satisfying studies of (original) book formats. The binding also swallows an indefinable part of the inner margin and can therefore be considered a major enemy of page measurements. Other than modern books, manuscripts do not have a title, instead, the incipit or first words were noted to the catalogue entry. Another information gap is the description of initials and miniatures. Not all of the texts are illuminated or contain miniatures, but initials were a common feature to structure the texts, starting from little highlighted letters to page-filling initial letters. Only a very small percentage of pictorial elements have been catalogued, detailed descriptions, measurements, and information about the exact location within the codex are missing. Therefore, we have no information about the text-to-image ratio in mediaeval manuscripts. To find and count images, one would have to leaf through all the books which, of course, got easier with every digitisation but is still a very time-consuming procedure. Applying SWATI on a digitised set of manuscripts will provide you with all these information by adding them to the metadata.
Thus, on the one hand, we can be lucky to have a catalogued corpus to work with, but, on the other hand, our catalogues only contain basic and often uncertain data. Hence, one goal of the eCodicology project was to discuss those problems and to develop a workflow to handle uncertainties. With the automatic approach
13 The results of a comparison between format, translated into measurements in centimetre according to the guidelines of theDeutsche Bibliothek, todayGerman National Library, and the actual format of the binding are presented in the final report of the project (eCodicology). The comparison is of course not exact because of missing references to mediaeval times where the size of a page was determined by type and size of the animal (skin) and the number of times the parchment had been folded.
Figure 3: The image shows a detail from the parallel coordinate plot in CodiVis: the emergence of different materials and their dating.
from the computer science part of the project it was even more important to discuss uncertainties and to determine solutions. Format and automatically measured page size are two entirely different entities and will not be mixed but registered separately in the TEI P5 XML files without any loss of information.
14For the storing of the manuscripts, the dating held further problems since a solution needed to be found on how to deal with manuscripts dated to two or more centuries. Even though structural data which separate the different contents in one manuscript have been generated during the digitisation process, neither human nor machine can easily define a date of production for each content. The question remains how to handle these uncertain data.
As a solution, manuscripts with more than one dating in the TEI file are represented with multiple lines in the parallel coordinate plot.
Visualisation can help to find outliers as it shows certain patterns, for example for the page size and the main text areas. Significantly divergent formats in a time period can hint at the certainty of the temporal placement in the bibliographical
14 A detailed description of the developed schema is described in the final report of theeCodicologyproject.
metadata. The same applies for questions about the writing material. Including information about a manuscript’s content is rather difficult: as mentioned before, the more information the catalogue offers, the more questions can be answered by a quantitative approach. While digitisation enabled access to large collections of manuscripts and initiatives such as the Text Encoding Initiative (TEI-C) have developed standards to store bibliographic metadata in an interoperable format, most of the recent manuscript cataloguing projects have not kept in mind to provide their data in machine readable files. The non-existence of a multilingual controlled vocabulary for manuscript description to refer to is a serious problem.
15The idea to face this problem within the project eCodicology was born due to the difficulty of interdisciplinary and intercultural communication in the project team, which consisted of scholars with different nationalities and from disciplines, namely computer science and various disciplines from humanities research fields. A bilingual list of terms was collected to simplify communication between the project members and transferred to a browser- based SKOS editor to build up a rdf-based codicological ontology (CodiKos).
16The quantitative codicologist cannot gain new insights without the support of the expert applying traditional methods. A closer collaboration is highly demanded in the future. Without being able to work with library contents annotated to higher standards, the building of larger corpora with the same parameters is impossible and limits the option of quantitative research.
6 Discussion of the Results: What did eCodicology Teach us so far?
At the preliminary endpoint of the project work
17, all 170,000 pages (440 codices) have been processed once, roughly 15 different features (see table 1) per page – 10.000 features per manuscript – were captured and saved in the metadata files, which makes a total of 2.5 million new entries. The processing of one codex page takes 3-5 minutes according to the complexity of each page. The newly gained metadata give – apart from information on e.g. the colour values – information about the page size and dimensions and place of the different text and image areas on the page. After the first run of SWATI we got satisfying results
18regarding the page measurements
15 For further information on the general difficulties of manuscript terminology across different languages see Jakobi-Mirwald 2009.
16 The SKOS ontology was developed within CodiLab in collaboration with the projectSemToNotes, which aimed at designing an image annotation tool for manual correction and semantical enrichment of automatic image annotation.
17 The funding ofeCodicologyended in April 2016. The software development is currently continued in the context of a Phd thesis at the Karlsruhe Institute of Technology.
18 We decided on a 2,5% acceptance range for deviation, everything within that 2,5% is satisfying.
Figure 4: This figure shows the superimposition plot of page space measurements, textual space measure- ments, and pictorial space measurements
and main text areas. After processing the first couple of complete codices, manual measurements of the same sample were taken and compared to the automatic results.
An acceptable range of 2,5% for the mean deviation was decided and both groups were within that range concerning the page height.
19Currently (January 2017), calculations and tests to define the segmentation quality are being performed. The feature extraction of image areas can still be considered to be in its infancy: extracting image areas is a very complex process as image areas may contain many areas too similar to the background of the page to be determined precisely and it needs more training before one can work with the results. To store the results of feature extraction correctly they need to be filtered since the machine defines irregularities as text or image space. After sampling and defining a minimum value for those areas and further training the algorithms, the results can be improved significantly. Visualisation of the annotated areas can support these processes (see fig. 4).
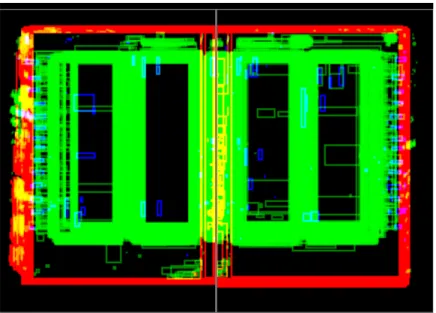
Looking at the data visualisation on page level, the detected zones can be reflected in the original image: red frames surround the page area, green frames the text areas, and blue frames the image spaces. The example (fig. 4 and 5) shows manuscript Hs. 68
19 The case study has been presented at the annual conference of the DHd in Graz in February 2015.
Figure 5: This figure shows a manuscript montage plot. In this view, all the manuscript pages are combined into the composite view and the relative measurements extracted from the SWATI workflow are plotted on top of each respective page.
from the Bibliothek des Bischöflichen Priesterseminars Trier, a manuscript on parchment from the 12
thcentury with a two columned layout and without illuminations. The two main text areas can be distinguished very well from misdiagnosed smaller areas which most probably are irregularities on the parchment. Little text areas in the upper right corner are most probably the page numbers added subsequently and the few oblong text areas on the outer margin are glosses. Large red areas left-aligned within the text fields are initials. The remaining detected zones can be marked as errors for further training. Training can improve the processing algorithms significantly. Statistical analyses can help to define a value for minimum areas of text and image to be ignored and location of an area on the page can also help to evaluate the correctness of a detected area: features very close to the binding are mostly neither text nor image. The accuracy of the measurements is also checked with confidence intervals of currently 20 pages to get a mean of the whole manuscript, if those twenty pages show accurate results, training and feature extraction is considered successful.
2.5 million features on 170,000 image scans is too big a number to handle manually
for further analyses. Therefore, the visualisation framework CodiVis was developed
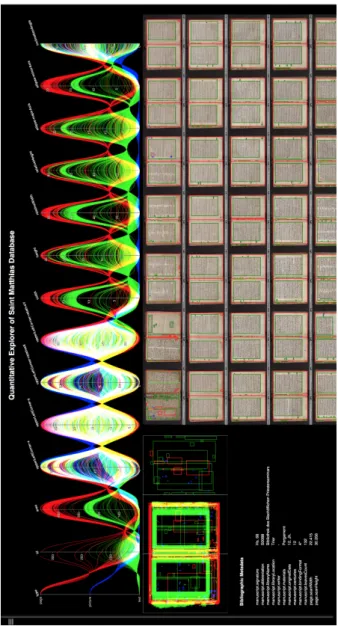
Figure 6: This figure shows a manuscript page explorer view. It shows all the measurements of layout features of a single manuscript. At the top, the parallel coordinate plot is shown where each line represents one measurement of a layout feature. At the bottom left, the superimposition plot is shown where all the measurements are superimposed to see the overall structure of hundreds of manuscript pages at a single glimpse. At the bottom right, the manuscript montage plot is shown where measurements are drawn on the respective manuscript page.
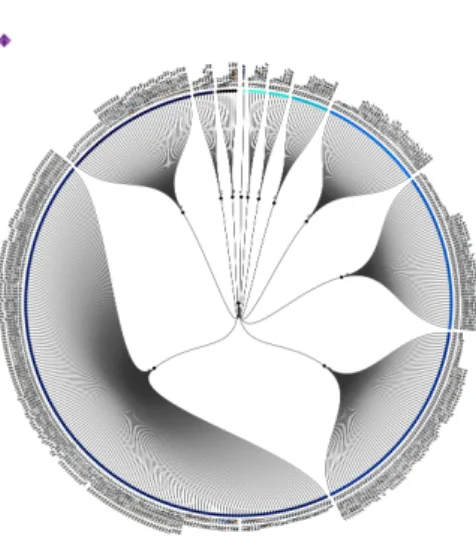
Figure 7: Radial tree with all 450 manuscripts in chronological order clockwise, starting with the 8thcentury.
Multiple entries for manuscripts with more than one dating.
which is an attempt by the computer scientists to enable the (humanities) scholars to retrieve the information they want, make sense of that information, determine correlations in the data and reach decisions in a short period of time. For the prototype of CodiVis we have a radial tree (see fig. 7) providing an overview of bibliographical data, in this case the “century variable” of the manuscript according to the St. Mat- thias catalogues. The radial tree is a node-link tree with transformations in polar coordinates and was chosen over a simple chronological listing because it has a better usage of space if only few hierarchy levels and bottom nodes exist. To distinguish the different parameters and single manuscripts, different colours are used varying in brightness.
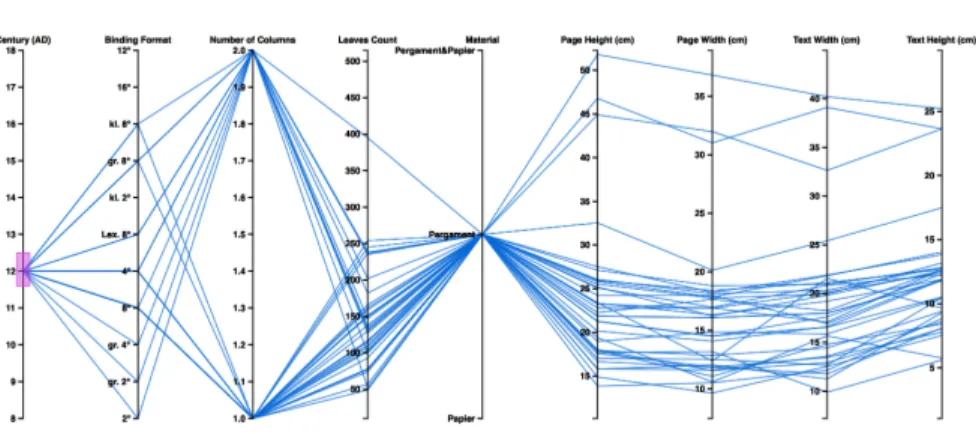
The layout features extracted by the SWATI workflow and other bibliographical metadata are represented using parallel coordinates (see fig. 8), a way of visualising high dimensional data and analysing multivariate data. The sample features of our prototype are number of columns, page height, page width, text hight and text width (mean value in cm), and text area (in cm²). The layout features are mapped onto a vertical axis and each data value from the CSV file is represented along a line.
It is scaled to lie between minimum and maximum at the top (see fig. 8). A pure
collection of points would not be useful, so the points belonging to the same record
are connected with lines. The colour assignment is similar to the radial tree. The
arrangement of the vertical axis can be adjusted according to the correlations the
Figure 8: The image shows the parallel coordinate view with nine parameters showing manuscripts dating to the 11thcentury.
user wants to visualise. A table view where each row and column of the CSV file is represented completes the CodiVis framework. It is linked to both radial tree and parallel coordinate view. By brushing and linking, the static view becomes dynamic and interactive: two brushes are provided for analysing the mediaeval manuscript data. With the polar brush, users can select different nodes in the polar coordinates of the radial tree, the selected data are automatically reflected in the parallel coordinates and in the table view. With the vertical axis brush, users can brush any of the vertical axes of the parallel coordinates view. The selection in felected respectively in all three views.
Multi-dimensional visualisation techniques not only provide the humanities scholar more “beautiful data”, they can also help to explore single manuscripts and corpora.
To prove the theories of notable rectangles, one just has to take a look at the vertical axes of the parallel coordinate view. Scholars accessing visualisations can easily choose a group of pages or manuscripts or even the whole library from the radial tree or CodiStore (see Chandna et al. 2016) database to generate a visualisation of the proportions of page and text. Two or more different layouts within one codicological unit can help to distinguish different parts of a composite manuscript. Outliers and pecularities within a group of manuscripts can be detected more easily.
Unfortunately, at the preliminary endpoint of the project we have not yet been
able to experiment with our results and perform sufficient analyses to contribute
results in quantitative layout studies. Processing big data such as our five terabyte of
manuscript images is a complicated and time consuming task. Same applies to the
selection of the right visualisation forms to facilitate access to data and to fulfil the
needs of different groups of researchers. The presented forms of visualisation are purely exploratory and have not been conclusively evaluated yet. Notwithstanding, we hope this refelction on the experiment eCodicology can show the potential of SWATI and CodiVis and we are looking forward to be able to give access to our developments, present further analyses, and discuss about the approaches of the project.
20Bibliography
Agati, Maria Luisa. Il libro manoscritto. Da Oriente a Occidente. Per una codicologia comparata.
Rome: L’erma di Bretschneider (=Studi archeologica), 2009.
Becker, Petrus. Die Benediktinerabtei St. Eucharius-St. Matthias von Trier. (Germania Sacra, Neue Folge, Bd. 34) Berlin, New York (NY): de Gruyter, 1996.
Chandna, Swati, Danah Tonne, Thomas Jejkal et al. “Software workflow for the automatic tagging of mediaeval manuscript images (SWATI).” In Ringger, Eric K. and Bart Lamiroy.
Document Recognition and Retrieval XXII, San Francisco, California, USA, February 11-12, 2015. SPIE Proceedings 9402, SPIE 2015.
Chandna, Swati, Danah Tonne, Rainer Stotzka et al. “An effective visualization technique for determining co-relations in high-dimensional mediaeval manuscript data.” Electronic Imaging, Visualization and Data Analyses 2016. VDA-488/ 1-6.
Chandna, Swati, Francesca Rindone, Carsten Dachsbacher et al. “Quantitative exploration of large mediaeval manuscripts data for the codicological research.” Proceedings of IEEE Symposium on Large Data Analysis and Visualization 2016. Baltimore (MD): IEEE, 2017.
DOI: 10.1109/LDAV.2016.7874306.
CodiKos. <https://github.com/JochenGraf/CodiLab/blob/master/CodiKOS.html>.
eCodicology: eCodicology – Algorithmen zum automatischen Tagging mittelalterlicher Hand- schriften. Darmstadt: Technische Universität Darmstadt, Trier: Trier Center for Di- gital Humanities, Karlsruhe: Karlsruher Institut für Technologie. 2013-2016. <http:
//www.ecodicology.org>.
Heer, Jeffrey, Michael Bostock, and Vadim Ogievetsky. “A Tour through the Visualization Zoo. A survey of powerful visualization techniques, from the obvious to the obscure.”
Communications of the ACM. 53.6 (2010). 59-67.
ImageJ: Image Processing and Analysis in Java. <http://imagej.nih.gov/ij>.
Jakobi-Mirwald, Christine. “Lost in Translation. Manuscript terminology between languages.”
Gazette du livre medieval 55 (2009). 1-8.
Keuffer, Max and Gottfried Kentenich. Beschreibendes Verzeichnis der Handschriften der Stadtbib- liothek zu Trier. Bd. 1—10. Trier: Lintz, 1888-1931.
KIT Data Manager. Karslruhe: Karlsruhe Institute of Technology. <http://datamanager.kit.
edu/>.
20 Updates about the availability of our software will be published on theeCodicologywebsite. Don’t hesite to contact the authors for further information or discussion.