• Keine Ergebnisse gefunden

Transformation of TiO2 (nano)particles during sewage sludge incineration

N/A
N/A
Protected

Academic year: 2021

Aktie "Transformation of TiO2 (nano)particles during sewage sludge incineration"

Copied!
15
0
0

Wird geladen.... (Jetzt Volltext ansehen)

Volltext

(1)

Research Collection

Journal Article

Transformation of TiO2 (nano)particles during sewage sludge incineration

Author(s):

Wielinski, Jonas; Voegelin, Andreas; Grobéty, Bernard; Müller, Christoph R.; Morgenroth, Eberhard; Kaegi, Ralf

Publication Date:

2021-06-05 Permanent Link:

https://doi.org/10.3929/ethz-b-000474262

Originally published in:

Journal of Hazardous Materials 411, http://doi.org/10.1016/j.jhazmat.2020.124932

Rights / License:

Creative Commons Attribution-NonCommercial-NoDerivatives 4.0 International

This page was generated automatically upon download from the ETH Zurich Research Collection. For more information please consult the Terms of use.

ETH Library

(2)

Journal of Hazardous Materials 411 (2021) 124932

Available online 5 March 2021

0304-3894/© 2020 The Author(s). Published by Elsevier B.V. This is an open access article under the CC BY-NC-ND license

(http://creativecommons.org/licenses/by-nc-nd/4.0/).

Transformation of TiO 2 (nano)particles during sewage sludge incineration

Jonas Wielinski a , b , 1 , Andreas Voegelin a , 2 , Bernard Grob ´ ety c , Christoph R. Müller d , 3 , Eberhard Morgenroth a , b , 4 , Ralf Kaegi a , * , 5

a

Eawag, Swiss Federal Institute of Aquatic Science and Technology, 8600 Dübendorf, Switzerland

b

ETH Zürich, Institute of Environmental Engineering, 8093 Zürich, Switzerland

c

University of Fribourg, Department of Geosciences, 1700 Fribourg, Switzerland

d

ETH Zürich, Department of Mechanical and Process Engineering, 8092 Zürich, Switzerland

A R T I C L E I N F O Editor: Prof. G. Lyberatos Keywords:

XAS Incineration Nano safety Sewage sludge ash Titanium dioxide Nanoparticle

A B S T R A C T

Titanium dioxide (TiO

2

) (nano)particles are produced in large quantities and their potential impacts on eco- systems warrants investigations into their fate after disposal. TiO
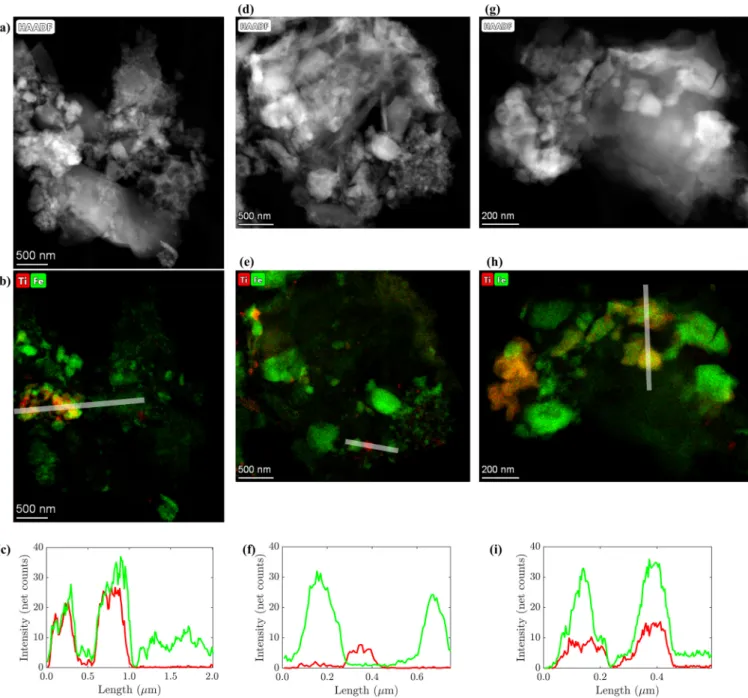
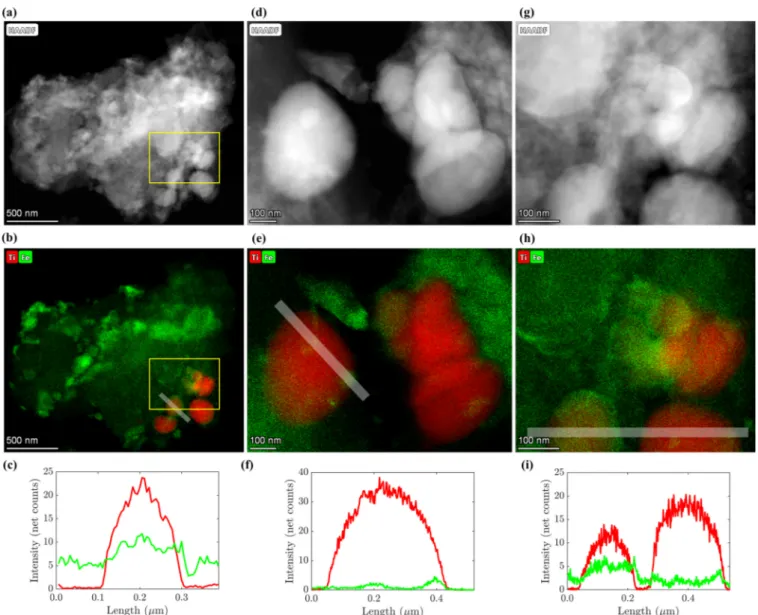
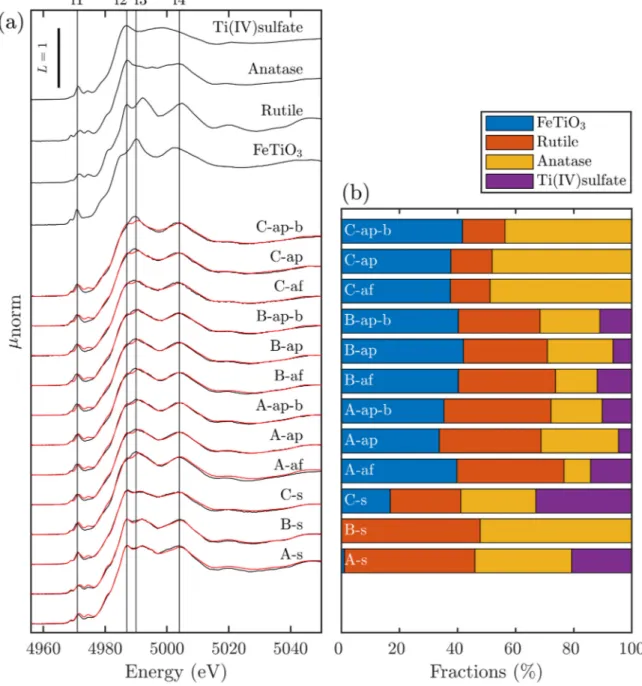
2

particles released into wastewater are retained by wastewater treatment plants and accumulate in digested sludge, which is increasingly incinerated in indus- trialized countries. Therefore, we investigated the changes of the Ti-speciation during incineration of as-received sludge and of sludge spiked with anatase (d = 20 – 50 nm) or rutile (d = 200 – 400 nm) using X-ray absorption spectroscopy (XAS) and transmission electron microscopy (TEM). In the as-received sludge, rutile and anatase were the dominant Ti bearing minerals and both remained unaffected by the anaerobic treatment. During incineration, Ti reacts with hematite to members of the hematite-ilmenite solid solution series (Hem-Ilm). Up to 80% of the Ti spiked as anatase transformed into Hem-Ilm, a distorted 6-fold coordinated Ti (Ti(IV)sulfate) and rutile during incineration. Up to 30% and 60% of rutile transformed into Hem-Ilm and Ti(IV)sulfate represented phases in fly and bottom ash, respectively. Fe and Ti were spatially correlated in ash derived from as-received and anatase spiked sludge, whereas only a thin layer of the spiked rutile reacted with Fe, in line with XAS data. This study highlights the transient nature of nano-Ti species during sewage sludge incineration.

1. Introduction

Since more than a century, titanium dioxide (TiO

2

) powders and nanoparticles (NP) have been used in industrial goods including paints and personal care products such as sunscreens. In 2019, the annual TiO

2

production equaled roughly 7.66 million metric tons (USGS, 2020). TiO

2

occurs as rutile, anatase and brookite with the latter polymorph being least abundant. Octahedra of six-fold O-coordinated Ti share corners in rutile and edges in anatase (Scheinost, 2005). In 2006, the International Agency for Research on Cancer (IARC) classified TiO

2

-NP as potentially carcinogenic with regard to lung cancer in humans (class 2B) (Baan et al., 2006), and a proposal for a similar classification under European Union (EU) regulation is currently underway (Guseva Canu et al., 2019).

Furthermore, several studies document ecotoxicologial impacts of

(nano)TiO

2

on aquatic organisms (Bundschuh et al., 2018; Lead et al., 2018; Du et al., 2019). Therefore, a detailed understanding of trans- formation processes in managed waste facilities that potentially impact the properties of TiO

2

-NP is required to assess the potential risks asso- ciated with the use and disposal of TiO

2

-NP (Svendsen et al., 2020).

Depending on the sewer system, TiO

2

(nano)particles released from outdoor paints can either enter the natural aquatic environment or reach wastewater treatment plants (WWTPs) where they are retained and accumulate in the sewage sludge (Som et al., 2011; Lazareva and Keller, 2014; Kaegi et al., 2008). TiO

2

-NP derived from cosmetic products like sunscreen mostly end up in sewage sludge. In high-income/industrialized countries, major shares of digested sewage sludge are incinerated (US, EU: 20 – 25%; Japan, Germany: > 50%;

Switzerland: close to 100%) (Werther and Ogada, 1999; Laube and

* Corresponding author.

E-mail address: ralf.kaegi@eawag.ch (R. Kaegi).

1

ORCID: 0000-0002-7017-3164

2

ORCID: 0000-0003-2873-8966

3

ORCID: 0000-0003-2234-6902

4

ORCID: 0000-0002-1217-269X

5

ORCID: 0000-0002-2430-4733

Contents lists available at ScienceDirect

Journal of Hazardous Materials

journal homepage: www.elsevier.com/locate/jhazmat

https://doi.org/10.1016/j.jhazmat.2020.124932

Received 22 November 2020; Received in revised form 18 December 2020; Accepted 19 December 2020

(3)

Vonplon, 2004; Wiechmann et al., 2015; Kelessidis and Stasinakis, 2012;

EUROSTAT, 2016). In Switzerland, mono-incineration fluidized bed reactors are designed for sludge incineration and residual ash is currently disposed in dedicated landfill site compartments for future resource recovery. Previous studies presented the transformation of CeO

2

-NP, Ag-NP, CuO-NP and ZnO-NP into novel phases during sewage sludge incineration (Gogos et al., 2019; Wielinski et al., 2019; Meier et al., 2016). Roes et al. (2012) hypothesized that TiO

2

-NP (with di- ameters between 5 and 40 nm), will remain unaffected by solid waste incineration, which was supported by results from laboratory and full-scale incineration studies (Oischinger et al., 2019). TiO

2

-NP were found to largely remain in the bottom ash (Oischinger et al., 2019) and no Ti evaporation was observed (Tarik and Ludwig, 2020). In contrast, Vejerano et al. (2014) observed the transformation of anatase NP into thermodynamically more stable rutile during thermal waste treatment.

Furthermore, the transformation of TiO

2

-NP derived from paint residues into perovskite (CaTiO

3

) was reported from a lab-scale incineration experiment (Massari et al., 2014). Thus, there is an apparent discrep- ancy between the findings of different studies reporting on TiO

2

-NP transformations occurring during thermal waste treatment. Previous efforts to investigate the fate of engineered TiO

2

(nano) particles during incineration were focused on municipal solid waste incineration facil- ities (Oischinger et al., 2019; Massari et al., 2014) whereas the trans- formation of Ti containing phases during sewage sludge incineration was not investigated to date.

In this study, we, therefore, investigated to what extent the Ti phases in sludge transformed during incineration and identified the relevant transformation products. For this purpose, anatase (d = 20–50 nm) or rutile particles (d = 200–400 nm) were spiked to anaerobically digested sludge and kept under anaerobic, mesophilic conditions for 2 weeks.

Following sludge dewatering and drying, the sludge samples were incinerated in a pilot fluidized bed reactor (Gogos et al., 2019; Wielinski et al., 2019).

In the following, “spiked sludge” refers to sludge samples to which either rutile or anatase were added and are indicated by “An-s” or “Ru- s ” , where “ -s ” refers to sludge. Ash samples obtained through incinera- tion of An-s or Ru-s are referred to as “ An-ap ” and “ An-ap-b ” as well as

“Ru-ap” and “Ru-ap-b”, where “-ap” and “-ap-b” refer to fly and bottom ash obtained through pilot incineration, respectively. In addition to the spiked sludge, “ as received ” digested sludge was treated and incinerated the same way and we use the term “sludge” to refer to as received sludge samples. Furthermore, “ash” refers to ash samples obtained through incineration of sludge samples. The distinction between sludge and ash obtained from different WWTPs will be introduced later. We refer to the Ti already present in the digested sludge or ash as “native” Ti.

The speciation of Ti in the sewage sludge and the sewage sludge ash was investigated using X-ray absorption spectroscopy (XAS) at the Ti K- edge. Further, XAS spectra were recorded on soils for comparison. Ab initio calculations were performed to obtain theoretical X-ray absorption near-edge structure (XANES) spectra where experimental reference material spectra were unavailable. Scanning transmission electron mi- croscopy (STEM) combined with energy dispersive X-ray analysis (EDS) was used to study the transformation of the TiO

2

particles on the sub- micron scale. Relative proportions of the major mineral phases in the ash were estimated using X-ray powder diffraction (XRPD).

2. Materials and methods

2.1. Chemicals, chemical digestions and analytical techniques

The following chemicals were used as received: HNO

3

(69%, Roth), H

2

O

2

(30%), H

2

SO

4

, (99.999%, both Sigma Aldrich), HF (40%, Merck).

All solid samples were ground in stainless steel containers using a ball mill (MM400, Rentsch) at 17 Hz for 4 min prior to further processing.

For digestions of wet sludge (22.9 g total solids/L, Sections 2.3), 2 mL of a blended sludge sample were reacted with 0.5 mL H

2

O

2

, 5 mL of HNO

3

and 0.2 mL of HF. The mixtures were digested using an ultraclave (MLS GmbH). The National Institute of Standardization and Technology (NIST) Standard Reference Material (SRM) 2782 (industrial sludge) was digested to assess the analytical recovery of Ti. The clear digests were diluted to 50 mL using DI water and Ti concentrations were determined against an external calibration on either an inductively coupled plasma (ICP) mass spectrometer (MS, Agilent 8900QQQ, Agilent) or an ICP optical emission spectrometer (OES, SPECTRO Arcos). The analytical recovery of Ti was between 84% and 93% calculated based on several digestions of the NIST SRM 2782 material. Ti concentrations of the experimental samples were adjusted using the analytical recovery of the respective digestions of the reference materials, which were run in parallel.

X-ray fluorescence (XRF) measurements were performed on dried samples using a XEPOS + (SPECTRO Analytical Instruments GmbH) to determine Ti, Fe, Ca, Ba, Sr and Pb concentrations. For that purpose, 4.0 g of powdered sample were mixed with 0.9 g of wax (Cereox Licowax, Fluxana GmbH) and pressed into 32-mm pellets.

2.2. TiO

2

(nano)particle characterization

Anatase NP with an Al

2

O

3

surface coating (CAS: 1317 – 70 – 0, U.S.

Nanomaterials Research Inc.) were obtained as a 40 wt% dispersion in water. A commercially available rutile pigment with SiO

2

coating (KRONOS2300 ® , CAS: 1317 – 80 – 2, KRONOS Worldwide, Inc.) produced by the chloride process was obtained as dry powder. The primary par- ticle diameters, as determined by STEM (Cs-STEM HD-2700, Hitachi) were around 20 – 50 nm for anatase and 200 – 400 nm for rutile (Figs. S1 and S2). The anatase dispersion was diluted in DI water and the rutile powder was added to DI water and dispersed using an ultrasonic bath.

Dynamic and electrophoretic light scattering measurements (DLS, ELS, NanoZS, Malvern Instruments) indicated number mean sizes (z-average) of ≈ 60 nm and ≈ 500 nm for anatase and rutile particles and zeta- potentials of − 34.0 and − 4.7 mV. The crystal phases were confirmed by XRPD (Section 2.7, Fig. S3). The size of anatase crystallinites, (Scherrer equation), was 20 nm, i.e. smaller than the value determined by STEM, thus indicating that the anatase NP were polycrystalline (Fig. S3). Peak broadening was insignificant in the rutile diffractogram.

XAS data (short range order) of the anatase and rutile particles were in agreement with XAS data recorded on commercially obtained high pu- rity anatase and rutile powders (Fig. S4). Details on XAS data collection and processing can be found in Section 2.5.

2.3. Sample preparation

Digested sludge with a total solids (TS) content of 22.9 g/L was collected at a nearby municipal WWTP (ARA Neugut, Wallisellen, Switzerland). TS was defined as the mass retained by a 0.45 µm cellulose-acetate filter after drying at 105

C for 24 h. The collected sludge was separated into two batches of 36 and 24 L, respectively. One batch was spiked with anatase (An-s: anatase spiked sludge), the other with rutile (Ru-s: rutile spiked sludge). In each batch, the concentration of Ti was spiked from approximately 1000 mg/kg TS to reach a target concentration of 10,000 mg/kg TS. The spiked sludge was reacted under anaerobic, mesophilic conditions (35

C) and constant stirring for 2 weeks. Thereafter, the sludge was dewatered using a centrifuge, dried at 105

C and crushed into pieces of a few cm in diameter. The dried sludge contained 7300 mg/kg (anatase) and 8700 mg/kg (rutile) Ti (Table S1).

Subsequently, the sludge was incinerated at 820 – 840

C in a bubbling bed type pilot fluidized bed reactor (FBR) as described in Wielinski et al.

(2019). Briefly, a 700 g sand bed of 10 cm diameter was fluidized by a

120 L/min air flow. A resistance heater heated the air flow to around

700

C. Dried sludge was constantly fed onto the fluidized bed by a spiral

conveyor. Occasionally, spikes of a propane/butane gas mixture were

injected into the bed to stabilize the temperature. The residual oxygen

content was between 12% and 14% as determined by a lambda sensor.

(4)

Two electrostatic precipitators were used to collect the fly ash. The bottom ash remaining in the sand bed was collected at the end of each experiment. In our previous work (Wielinski et al., 2019), we studied the transformation of Cu / Zn phases during sewage sludge incineration based on sludge and ash samples collected from three full-scale WWTPs (A: ARA Werdh olzli, Zürich, B: ProRheno, Basel, C: ARA Rhein, Basel) ¨ with onsite fluidized bed incineration. In addition, samples from the same sludges were incinerated in the pilot FBR and the properties of the pilot incineration generated ash matched the properties of ashes ob- tained from full scale incinerators well. In the present study, we included the sludge and ash samples from this previous work to assess if the same Ti transformation processes occurred in the pilot FBR and in the full-scale facilities.

2.4. Mass balance calculations

Mass balance calculations were performed to assure that all relevant mass flows were collected (Wielinski et al., 2019). We determined the recovery of the total mass between sludge and ash (Eq. (1)).

Recovery of ash content (%) = m

fly

+ m

bottom

m

sludge

X

TS

X

ash

× 100 (1)

Where m

sludge

, m

fly

and m

bottom

represent the mass of incinerated sludge, collected fly- and bottom ash, respectively. X

TS

X

ash

represents the non- combustibles and was determined by heating 1 g of dried sludge to 950

C during 2 h where it was kept for 1 h. The remaining fraction was defined as X

TS

X

ash

.

Assuming that Ti does not volatilize under the incineration condi- tions in the present experiments (Oischinger et al., 2019; Tarik and Ludwig, 2020), the Ti mass balance is defined as:

m

sludge

c

sludge

= m

fly

c

fly

+ m

bottom

c

bottom

(2)

where c

sludge

, c

fly

and c

bottm

represent the Ti concentration in sludge, fly- and bottom ash, respectively. Normalized by the recovery of the ash content, the mass recovery of Ti is obtained (Eq. (3)).

Mass recovery of Ti (%) = m

fly

c

fly

+ m

bottom

c

bottom

m

sludge

c

sludge

× 1

Recovery of ash content

× 100

(3) Further, a Ti enrichment factor (EF) that is independent of the ash recovery can be calculated (Eq. (4)).

EF = c

fly

m

fly

+ c

bottom

m

bottom

m

fly

+ m

bottom

× 1

c

sludge

(4)

2.5. X-ray absorption spectroscopy (XAS) measurements

Synchrotron XAS experiments were performed to determine the chemical speciation of Ti in sludge, ash and soil samples. For the sample preparation, 110 mg of dried sample was mixed with 10 mg of boron nitride and ground in an agate mortar. Twenty mg of cellulose were added to increase stability and a 80-mg aliquot was pressed into a 7-mm diameter pellet using a hand-held press. The samples were stored in the dark at room temperature.

Since the formation of Ca-titanate (CaTiO

3

) during solid waste incineration was reported (Massari et al., 2014), we included a variety of titanates as reference materials. Titanates of the form ATiO

3

show different local distortions in their octahedral TiO

6

units (O

h

symmetry).

These distortions are reflected in characteristic pre-edge features at energies below the main absorption edge (Ravel and Stern, 1995). The intensity of the pre-edge feature is proportional to the square of the distortion of the unit cell. For A = Eu, a centrosymmetrical titanate is expected (negligible pre-edge feature), whereas a small distortion is expected for A = Sr. For A = Ba and Pb, the Ti-site becomes

rhombohedrally and tetragonally distorted, respectively (Ravel and Stern, 1995). Also in FeTiO

3

(ilmenite) a tetragonal distortion in the form of an extension along the C

4

symmetry axis was described (Radtke et al., 2006). Reference spectra of anatase, rutile, brookite, CaTiO

3

, FeTiO

3

, BaTiO

3

, SrTiO

3

, EuTiO

3

, PbTiO

3

, Ti

2

O

3

, Ti(III)sulfate (frozen) and Ti(IV)sulfate (frozen) were recorded. Europium titanate (EuTiO

3

) was synthesized from dissolved precursors (titanium isopropoxide, Sigma-Aldrich, 99.999% trace metal basis, mixed with dissolved Eu

2

O

3

, Sigma-Aldrich, 99.99% trace metal basis, in a 10 : 1 mixture of analyt- ical grade ethanol and HNO

3

) via the sol-gel route (Henderson et al., 2010). The Eu/Ti precipitate was collected, dried in a desiccator over- night, ground in an agate mortar, pressed into 7-mm diameter pellets using a handheld press and annealed in a tubular furnace under an Ar/H

2

(95%/5%) atmosphere at 1000

C for 12 h. The successful syn- thesis was confirmed by XRPD (details in section S3, Fig. S5). All other reference materials were obtained from commercial sources (Table S2).

Ti(IV)sulfate and Ti(III)sulfate were obtained as 15% (w/v) solutions and diluted in H

2

SO

4

to obtain Ti concentrations of 0.1% (w/v). The diluted solutions were filled into ceramic windows (8 × 4 × 2 mm) sealed with Kapton tape and immediately frozen in liquid nitrogen (LN).

Experiments were conducted at the X10DA (SuperXAS) beamline at the Swiss Light Source (SLS) at the Paul Scherrer Institute (PSI, Villigen, Switzerland). A 2.4 GeV storage ring with 400 mA current and a 2.9 T super bend magnet source provided the synchrotron light that was passed through a Si coated collimating mirror and a Si(111) channel cut monochromator. The beam was focused using a Pt-coated refocusing mirror. A Si-coated harmonic rejection mirror at 1.8 mrad was installed in the experimental hutch right before the first ionization chamber to reject unwanted harmonics. The ionization chambers were filled with 0.5 bar of He and N

2

each. XAS data were collected between 4846 eV and 5398 eV for samples and up to 5642 eV for reference materials.

XANES data were collected with 0.3 eV steps around the edge. Extended X-ray absorption fine structure (EXAFS) data were collected up to k ≈ 10.5 Å

-1

and k ≈ 13.1 Å

-1

for samples and reference materials, respectively. Before analysis, reference materials and samples were cooled by immersion in LN. The measurements were conducted at 100 K using a cryo jet (Oxford Instruments) to maintain sample temperature.

Samples as well as Ti(IV)sulfate and Ti(III)sulfate solutions were measured in fluorescence mode using a five element Si drift detector (SDD) (SGX, Sensortech), the other references were measured in trans- mission mode. For each sample, 2 or 3 scans were recorded and the respective spectra were merged. Data handling, background subtraction, normalization, principal component analysis (PCA) and linear combi- nation fitting (LCF) were performed using Larch v0.9.47 and SixPack v1.4 (Newville, 2013; Webb, 2005).

2.6. Ab initio calculations

The FDMNES software code (Bun ˘ au and Joly, 2009; Guda et al., 2015; Amestoy et al., 2006) (release April 17th 2020 obtained from GitHub) was used to perform calculations based on the full-potential finite difference method (FDM). An earlier version of the software code successfully reproduced experimental spectra of anatase and rutile (Kravtsova et al., 2010). For materials of high symmetry, e.g., Cu

0

fcc, the muffin-tin (MT) approximation is sufficient to compute spectra closely matching experimental spectra, whereas for materials with low symmetry FDM should be used (Joly, 2001). The MT approximation was inappropriate for calculating theoretical XANES spectra of TiO

2

(Kravtsova et al., 2010). We built on the previous work and used similar computational parameters to calculate the pre-edge region and the XANES of rutile (Fig. S6), ilmenite (Fig. S7) (Wyckoff, 1964) and addi- tional phases that we anticipated in the ash.

Self-consistent field (SCF) calculations using the Hedin, Lundqvist

and Von Barth potential and the subsequent FDM calculations were

performed on clusters of 7.2 – 8.0 Å ( ≥ 150 atoms) (Kravtsova et al.,

2010) around an absorbing Ti atom. SCF calculations over the entire

(5)

range were converged in all cases. Non-relativistic computations were performed, as only light elements (Z ≤ 26) were considered. Cited ref- erences in the text indicate the origin of the standardized crystal struc- tural data obtained through the Inorganic Crystal Structure Database (ICSD). If not indicated differently, the crystal structure was used as received from the ISCD. Additional calculations were conducted for two structures in which Ti replaced another element. In the first structure, the central Fe in a 7.2 Å hematite (Maslen et al., 1994) cluster was replaced by Ti. In the second structure, the entire central octahedron (FeO

6

) was substituted by a TiO

6

octahedron with the geometry found in ilmenite (Harrison et al., 2000) (ilmenite substituted hematite). The rigid TiO

6

octahedron was rotated to minimize the squared distance between the positions of the O atoms before and after substitution. The spectrum of Fe

1.3

Ti

0.7

O

3

(Ilm70, discussed in Section 3.2.5) (Harrison et al., 2000) contained a clearly artificial state just above the Fermi level ( + 0.20 eV) which was removed. In all other cases, only states below the Fermi Level were considered as occupied and cut off. The computed spectra were convoluted by a Lorentzian for comparison to experimental data. Computations were performed in parallel mode using MPI under CrayLinux on the Piz Daint Multicore Cluster (Cray XC50) operated by the Swiss National Supercomputer Centre (CSCS) in Lugano, Switzerland.

2.7. X-ray powder diffraction (XRPD) measurements

XRPD data were collected on the ash sample obtained from the Werdh ¨ olzli incineration plant (sample A-af) to determine the major crystalline phases in the ash and to confirm the structures of the syn- thesized EuTiO

3

and the spiking materials. For that purpose, 1 g of sample was dispersed in 5 mL of ethanol in an agate mortar, thoroughly ground and dried on a Si holder for XRPD measurements. An X’Pert

3

powder X-ray diffractometer (PANalytical) equipped with a Co (K α ) target was used to record data from 5

to 95

2 θ in step scan mode with a step size of 0.017

and a dwell time of 1.7 s per step. Semi-quantitative phase analysis by Rietveld refinement (Bish and Post, 1993) was per- formed on the recorded pattern of sample A-af using the PDXL2 software package (RIGAKU). The instrumental parameters, which were refined, are the background, the zero shift, the sample displacement and the peak shape, modeled with a pseudo Voigt profile function and an asymmetry parameter. The structure parameters for the phases present in A-af were taken from the International Centre for Diffraction Data (ICDD) data- base, but only the unit cell parameters, the isotropic overall temperature

factor and the fractions of the crystalline phases present (through the scale factor) were refined. The atomic positions and the site occupancies were kept constant during the refinement and preferred orientation parameters were not refined.

2.8. Scanning transmission electron microscopy (STEM) measurements STEM measurements including high angle annular dark field (HAADF) images and elemental distribution maps derived from energy dispersive X-ray spectroscopy (EDS) were performed to assess the as- sociation of Ti with other elements at the submicron-scale. We collected data on sample A-af and the fly ash samples obtained from anatase (An- ap) and rutile (Ru-ap) spiked sludge. For sample preparation, 100 mg of sample were dispersed in 5 mL of ethanol in an agate mortar and thor- oughly ground. The dispersions were sedimented for 1 min to remove large ash particles. Thereafter, 20 µL of the dispersions were passed through a holey carbon transmission electron microscopy grid (EMRe- solutions) to deposit ash particles. Measurements were performed on a Talos F200X, Super-X EDS, 4 detector configuration (FEI) at an accel- erating voltage of 200 kV and data was processed using the software Velox 2.8 (FEI).

3. Results and discussion

3.1. Ti concentrations and mass balance 3.1.1. Sludge samples

Concentrations of native Ti in the sludge samples (A-s, B-s, C-s, S) were between 1000 and 1800 mg/kg (Fig. 1a, Table S1). Through spiking of sludge sample S (1000 mg/kg), the Ti concentration increased to 7300 mg/kg in sample An-s (An: experiment with anatase spiked) and 8700 mg/kg in sample Ru-s (Ru: experiment with rutile spiked). Thus, the spiking protocol resulted in a 7 and 8-fold increase of the Ti con- centration in the sludge samples and allowed us to specifically investi- gate the transformation of the spiked TiO

2

phases in these samples.

3.1.2. Ash samples

Concentrations of native Ti in the ash samples obtained from the full scale incineration facilities were 1600 − 4500 mg/kg (A- to C-af (af: ash full scale)). Native Ti concentrations in the corresponding pilot FBR generated fly ash (A- to C-ap (ap: ash pilot scale)) and bottom ash (A- to C-ap-b (ap-b: bottom ash pilot scale)) samples, were 2400 − 4500 mg/kg

Fig. 1. (a) Ti concentrations of the samples discussed in the text in mg/kg. Tabulated data can be found in Table S1. (b) Mass recovery of Ti (%) in the ashes from pilot scale incineration experiments. A - C represent experiments with the sludge, An and Ru represent the incineration experiments with anatase- or rutile-spiked sludge, respectively. The horizontal line indicates 100% mass recovery of Ti. (c) Enrichment factors (EFs) for Ti in ash relative to sludge for the different experiments.

Bars show EFs based on measured Ti concentrations in sludge and ash, red crosses show the EF calculated from the solids and ash contents of the sludge (1 / X

TS

X

ash

).

The data displayed in (b) and (c) is tabulated in Table S3.

(6)

and 2100 − 6200 mg/kg, respectively. The Ti concentration in An-ap was 7100 mg/kg and for Ru-ap 12,400 mg/kg. In contrast, Ti concentration in the bottom ash increased to 23,800 mg/kg and 28,100 mg/kg in the anatase- and rutile-spiked samples. The preferential accumulation of TiO

2

particles in bottom ash is in agreement with a previous report (Oischinger et al., 2019).

3.1.3. Mass balances

Between 69% and 131% of the Ti in the sludge was found in the ash in the experiments with the as received samples (experiments A-C) and 95% and 101% in the experiments An and Ru respectively (mass re- covery of Ti, Eq. (3), Fig. 1b, Table S3). Deviations from the ideal EFs that are 1 / X

TS

X

ash

were observed for experiments B and C (Fig. 1c, Table S3). The EFs of the experiments A, An and Ru were in excellent agreement with the calculated values, based on the ash content of the incinerated sludge samples. Given the complexity of the experiments, the Ti mass balances and EFs of all experiments were within acceptable

limits and suggested that the relevant Ti mass flows were collected.

3.2. XAS data from sludge, ash and reference materials

Three regions of the Ti K-edge X-ray absorption fine structure spectra are of interest; (i) the pre-edge region (4965 − 4980 eV), (ii) the XANES region (4980 − 5060 eV) and (iii) the EXAFS region (5060 − ca. 5700 eV).

The pre-edge region contains information about the Ti coordination (e.

g., octahedral versus tetrahedral), the presence of multiple Ti valence states and the length and angle of the Ti-O bonds, whereas the shape of the XANES region also includes information on the structure further away from the absorber (Farges et al., 1996; Farges et al., 1997;

Yamamoto, 2008). The sludge and ash samples contained 200 – 2500 mg/kg Ba (Table S1). The excitation of the Ba L

III

-edge (5989 eV) and the resulting interference of the Ba L α

1,2

fluorescence lines (4466.5 and 4451.3 eV) within the fluorescence energy region defined for Ti K α XRF detected by the SDD limited the interpretable

Fig. 2. (a) Ti K-edge XANES spectra of selected reference materials and sludge and ash samples (black lines), together with linear combination fits (LCF) to the

sample spectra (red lines). (b) LCF-derived species fractions. Vertical lines in panel (a) are drawn to guide the eye and are included in the discussion in the Supporting

Information section S8.

(7)

EXAFS data range to energies below 5989 eV (k = 8.1 Å

1

). Therefore, only the pre-edge region and the XANES region were investigated in this study.

Based on the XAS data we determined the speciation of native Ti in three digested sludge samples from different WWTPs (A-s, B-s and C-s) and the corresponding ashes from on-site full scale fluidized bed incin- eration (A-af, B-af and C-af) (Fig. 2a) as well as from equivalent samples incinerated in our pilot fluidized bed incinerator (fly ash: A-ap, B-ap, C- ap; bottom ash: A-ap-b, B-ap-b, C-ap-b) (Fig. 2a). The goal of this com- parison was to evaluate whether the pilot incinerator can be used to mimic Ti phase transformation in a full-scale incinerator. Furthermore, we intended to obtain information about the variation of the native Ti speciation between different sludge and ash samples.

3.2.1. Reference material selection and qualitative discussion of spectral features

3.2.1.1. Reference material selection. Principle component analysis (PCA) and target testing (TT) were performed over the pre-edge and XANES region (4964 − 5060 eV) to identify reference spectra suitable for LCF analysis (Malinowski, 1978, 2002). All (as received and spiked) sludge and ash spectra were included in the PCA. For TT, we used the first 2 principal components (PC) that covered 99.8% of the total cu- mulative variance, and evaluated the reconstruction of all recorded reference material spectra (Fig. S8). This led to acceptable SPOIL values of 1.7 – 5.8 for FeTiO

3

, rutile, brookite, Ti(IV)sulfate, anatase and Ti

2

O

3

(Table S4). However, neither the brookite nor the Ti

2

O

3

spectrum significantly improved the LCF of the sample spectra and were therefore excluded from the LCF analysis and further discussion below.

3.2.1.2. Spectral feature discussion. The spectra of the three sludge samples (A-s, B-s and C-s) share common features (Fig. 2a), but the loadings of the first versus the second PC were very different (Fig. S9).

For the ash spectra, the projections of the loadings clustered closely together suggesting that differences in speciation diminished through incineration, as seen in the similarity of the XANES spectra of the different ash samples (Fig. 2a). The similarity between spectra obtained on fly and bottom ash samples further indicated that Ti phase trans- formations were similar in both types of ashes, and not affected by the shorter residence time of fly ash compared to bottom ash samples in the pilot reactor. The spectra of ashes derived from full-scale incinerators and the pilot incinerator closely matched each other (Fig. 2a), indicating that the Ti speciation was independent of whether the ash was produced in the pilot or full scale incinerator. Thus, the pilot FBR can be used to mimic the Ti transformations that occurred in full scale incineration plants.

The energy of the onset of the absorption edge (XANES region) is similar in spectra of sludge, ash and TiO

2

, (anatase and rutile) indicating that Ti is present in a tetravalent state in all sludge and ash samples (Fig. 2a). In the pre-edge region, the sludge spectra were characterized by multiple resonances as found in rutile and anatase, whereas the ash spectra are dominated by a single oscillation. The enhanced intensity of the pre-edge oscillation(s) in the ash spectra relative to the sludge spectra A-s and B-s (Fig. 2a) suggests an increasing deviation from perfect centrosymmetric octahedral symmetry in the first O-shell around Ti (Ravel and Stern, 1995). An in-depth analysis of the pre-edge features is presented in in Section 3.2.3.

3.2.2. LCF analysis of the XANES spectra of sludge and ash

Results from the LCF analysis of the XANES spectra of the sludge and ash samples are provided in Fig. 2. A detailed discussion of the LCF re- sults and spectra of additional reference material spectra are provided in the SI (sections S5 and S8). Briefly, LCFs showed that the spectra of rutile, anatase and Ti(IV)sulfate can be used to reconstruct the experi- mental sludge spectra of A-s and B-s, whereas for C-s ilmenite is required

in addition (Fig. 2), in general agreement with a previous study (Pradas del Real et al., 2018). The Ti(IV)sulfate reference spectrum represents Ti in an additional 6-fold bonding environment (TiO

6

) with a high degree of short range disorder but not necessarily Ti(SO

4

)

2

. A spectrum of similar shape was classified as “Amorphous TiO

2

” in previous publica- tions (Pradas del Real et al., 2018; Zhang et al., 2008). The experimental ash spectra were only poorly described by the available reference ma- terial spectra, especially around the most intense oscillations (f2, f3, Fig. 2a). This indicated that our set of reference spectra was insufficient to explain all relevant spectral features and thus at least one additional phase was present in the ash samples (further details in section S8).

Although CaTiO

3

was reported as main reaction product from TiO

2

in solid paint waste incineration residues previously (Massari et al., 2014), and Ca concentrations between 4% and 17% in sludge and ash (Table S1), TT analyses and comparison of spectral features did not support the presence of CaTiO

3

in the present study (Table S4). This may be explained by the different matrix composition of the fuel and the different incineration conditions (fixed bed electric furnace versus flu- idized bed) compared to the previous study (Massari et al., 2014).

The shape of the pre-edge features and the oscillations of the XANES in the ash samples were closest to the spectrum of ilmenite (tetragonal distortion (Radtke et al., 2006), Fig. 2a). In the ash derived from full-scale incineration, Fe and Ti concentrations were 11 – 17 wt%, and 1500 − 4500 mg/kg, respectively (Table S1). Thus, the formation of a Ti-Fe-phase similar to ilmenite (FeTiO

3

) during the incineration process is plausible.

In conclusion, the ash spectra were only poorly represented by the available reference material spectra, and at least one spectrum was missing to adequately describe the features in the ash spectra. Since we included the most important Ti phases observed in digested sewage sludge and natural soils, namely rutile, anatase and ilmenite (section S9, Table S7, Fig. S10) (Scheinost, 2005), we speculate that the missing phase is a high temperature phase formed during the incineration process.

3.2.3. Analysis of selected pre-edge features

An analysis of the pre-edge features was performed to obtain infor- mation about the first coordination shell around Ti in the ash samples.

All reference materials contained 6-fold coordinated Ti, i.e. Ti occupied octahedral sites (TiO

6

). A 4- or 5-fold coordination (tetrahedral or

Fig. 3. Pre-edge features of ilmenite, the ash and Ti(IV)sulfate spectra (stacked

with offsets μ

norm

= ( 0 ; 0 . 25 ; 0 . 5 ) ). The experimental data is shown in black, the

fit in red and the three contributing peak shapes in differently colored dashed

lines. Not shown are the baseline, accounting for the main absorption edge and

normalization, which were fitted using a Lorentzian and a linear function,

respectively. The vertical lines at 4968.8 and 4970.9 eV guide the eye to fea-

tures discussed in the text.

(8)

square pyramidal site) would be reflected by strongly enhanced pre- edge resonances up to normalized absorption coefficients ( µ

norm

) of one (Farges et al., 1996). Thus, the absence of such strongly enhanced pre-edge resonances in the sludge and ash samples suggests that Ti is located only in octahedral sites (Fig. 2a). The 1s → 3d transition is dipole forbidden, however if p-d orbital mixing occurs, the intensity and energy position of the pre-edge features can be interpreted as direct conse- quences from the degree of p-d orbital mixing which results from the distortion from perfect octahedral symmetry (Farges et al., 1996; Way- chunas, 1987; Wong et al., 1984). The intensities and energy positions of the pre-edge features of the Ti spectra of the “ash”, ilmenite and Ti(IV) sulfate are of similar shape, although the first oscillation is barely visible in the latter (Fig. 2a, Fig. 3). (The “ash” spectrum represents the average of the normalized spectra of all ash samples derived from sludge treated by pilot- or full scale incineration that are shown in Fig. 2a.) Spectral

similarities between ash, ilmenite and Ti(IV)sulfate suggested a similar geometry of the first O-shell around Ti which will be assessed in detail in the following.

The three pre-edge features in, e.g., rutile, have been attributed to an unknown transition as well as two transitions into 2t

2g

and 3e

g

crystal field states (Farges et al., 1997; Waychunas, 1987). To describe the pre-edge features, it was suggested to fit three Lorentzian profiles instead of Gaussians or Pseudo Voigt functions since the shape of the former is in agreement with the expected shape resulting from these electronic transitions (Leitzke et al., 2018; Calas and Petiau, 1983).

However, a purely empirical model with three peak shapes, a Gaussian, a Pseudo Voigt and another Gaussian, from low to high energy, repro- duced the pre-edge area of the analyzed spectra best (Fig. 3). The energy of the centroids of the two peaks at low energies (4968.8 and 4970.9 eV, vertical lines, Fig. 3) was identical for ilmenite and the ash, but shifted by + 0.3 eV for Ti(IV)sulfate and we thus focused our discussion on the former two spectra. The energy position of the pre-edge feature (and main edge feature) centroids depends on the mean Ti-O distance and their intensity depends on the variance of the Ti-O bond angles ( σ

2

) (Waychunas, 1987; Robinson et al., 1971). For the most intense reso- nance at 4970.9 eV (Fig. 3; fit with Pseudo Voigt peak), similar in- tensities are observed for ilmenite (0.22) and the ash (0.18). This suggests that the dominant Ti phase in the ash features a similar σ

2

(and thus mean octahedral elongation along the C

4

symmetry axis (Robinson et al., 1971)) as ilmenite (with σ

2

≈ 86 . 0 deg

2

, Table 1) (Wechsler et al., 1984). Based on the identical energy positions, also the mean Ti-O bond lengths in the ash have to be similar to those of ilmenite (1.9816 Å, Table 1) (Wechsler et al., 1984). The broader peak width observed for the ash can be interpreted as higher degree of disorder. The shapes of the pre-edge features of other reference material spectra were significantly different and thus not included in the analysis (Fig. S8a).

Fig. 4. HAADF images (a, d, g, j), elemental distribution maps (b, e, h, k) and extracted line profiles (c, f, i, l) from ash grains of the sample A-af (green: Fe; red: Ti).

The grey bars in the elemental distribution maps indicate the orientation of the line scans, running from left to right.

Table 1

Distances between Ti and O for the first shell sorted from short to long distances in Å and the corresponding variance of the Ti-O bond angles ( σ

2

) in deg

2

. In the central TiO

6

octahedron in ilmenite-substituted hematite (Ilm-sub Hem) the bond distance lengths and σ

2

are identical as in Ilm.

Ilm (Harrison et al.,

2000) Ilm70 (Harrison

et al., 2000) Ti-sub Hem (Maslen et al., 1994)

Ti-O1 1.8744 2.0521 1.9440

Ti-O2 1.8744 2.0521 1.9440

Ti-O3 1.8744 2.0521 1.9440

Ti-O4 2.0887 2.1821 2.1141

Ti-O5 2.0887 2.1821 2.1141

Ti-O6 2.0887 2.1821 2.1141

Mean Ti-

O 1.9816 2.1171 2.0291

σ

2

86.0 82.5 84.7

(9)

3.2.4. Evaluation of potential Ti-Fe phases formed during incineration During sludge incineration, the temperature in the fluidized bed was between 820 and 840

C as determined by a thermocouple immersed into the sand bed. Sludge incineration is a multistage process. Initially, volatiles are released from the sludge particles (devolatilization) and burn in the freeboard. This results in a temperature increase of up to 200

C above the bed temperature (Werther and Ogada, 1999). The fly ash is continuously transported through the freeboard by pneumatic conveying and thus can experience temperatures up to 1000

C. After devolatilization, the particles are composed of char and non-combustibles (ash). These remain in the bed where the char burns and thereby heats the char/ash particles to well above the average flu- idized bed temperature (Werther and Ogada, 1999). Therefore, both fly and bottom ash experience temperatures above the maximum fluidized bed temperature facilitating the formation of novel Ti phases.

Synchrotron micro-XRF data on the distribution of Ti and Fe in sewage sludge ash from an earlier study (Wielinski et al., 2020) on the transformation of Cu during sludge incineration showed that most Ti ( ≈ 95%) was associated with the Fe-rich matrix of ash grains, and only a minor fraction concentrated in individual hot spots (Figs. S11 and S12).

STEM-EDS analyses on the ash sample A-af from the current study showed that the native Ti was closely associated with Fe also at the sub-micron scale (Fig. 4 and Section 3.4). HAADF images showed irregular ash grains (Fig. 4a,d,g,j) in which Fe (green) and Ti (red) were unevenly distributed (Fig. 4b,e,h,k). In one instance, Ti occurred inde- pendent of Fe (Fig. 4a − c), likely as TiO

2

, in another instance Ti was correlated with Fe (Fig. 4d − f). Furthermore, Fe spots associated with minor amounts of Ti were observed (Fig. 4g − l). In summary, micro-focused XRF and electron microscopy data indicated that Ti and Fe distribution were often correlated.

Fig. 5. Ab initio calculated XANES spectra of (bottom to top) ulv ¨ ospinel (Ulv) (Wechsler et al., 1984), Ulv with 0.1% of total Ti in tetragonal sites (Ulv 0.1%[Ti

4+

]

(T)

) (Mudarra Navarro et al., 2019), ilmenite-substituted hematite (Ilm-sub Hem), hematite-ilmenite (30:70; Fe

1.3

Ti

0.7

O

3

; Ilm70) solid solution of the space group R3c (disordered corundum structure) (Harrison et al., 2000), Ti-substituted hematite (Ti-sub Hem), ilmenite (Ilm (calc.), space group R3) (Wechsler et al., 1984), pseudobrookite (PB) (Hamelin, 1958) and pseudoferrobrookite (PFB) (Müller-Buschbaum and Waburg, 1983) are indicated for comparison with the ash (black curve) spectrum. Further, the experimental ilmenite spectrum (Ilm (exp.)) is shown. The individual spectra used to calculate the ash spectrum are displayed in light grey.

The vertical lines, labeled f1 - f6, guide the eye to the most important features discussed in the text.

(10)

Rietveld analysis of XRPD data showed hematite ( α -Fe

2

O

3

) as the main iron phase in sewage sludge ash (section S11). Depending on the oxygen partial pressure, α -Fe

2

O

3

and TiO

2

can form Fe-Ti phases of the magnetite-ulv ¨ ospinel (Mag-Ulv) (Fe

3

O

4

-Fe

2

TiO

4

, Fe

3−x

Ti

x

O

3

), hematite- ilmenite (Hem-Ilm) ( α -Fe

2

O

3

-FeTiO

3

, Fe

2−x

Ti

x

O

3

) and pseudobrookite- ferropseudobrookite (PB-FPB) (Fe

2

TiO

5

-FeTi

2

O

5

, Fe

2-x

Ti

1+x

O

5

) solid solution series (Harrison et al., 2000; Pearce et al., 2010; Akimoto et al., 1957). The formation of such Fe-Ti phases through solid state diffusion across TiO

2

-hematite interfaces was possibly facilitated by temperatures well above 840

C.

Because an experimental XANES reference spectrum was only available for ilmenite, ab initio calculations were performed to obtain

XANES spectra of the different Ti-Fe-solids for qualitative comparisons as discussed in the following section.

3.2.5. Ab initio calculations of theoretical pre-edge features and XANES spectra

Theoretical XANES spectra obtained through ab initio calculations of

pseudobrookite (PB) (Hamelin, 1958), ferropseudobrookite (FPR)

(Müller-Buschbaum and Waburg, 1983), ulv ¨ ospinel (Ulv) (Wechsler

et al., 1984), Ulv with 0.1% of tetrahedral sites occupied by Ti

4+

as

suggested by Mudarra-Navarro et al. (2019) (Mudarra Navarro et al.,

2019) (Ulv 0.1%[Ti

4+

]

(T)

), two members of the Hem-Ilm solid solution

series (Fe

2-x

Ti

x

O

3

, x = [0.7, 1.0]) (Harrison et al., 2000), Ti-substituted

Fig. 6. (a) Ti K-edge XANES spectra of anatase- or rutile-spiked sludge and resulting ashes and reference spectra used for LCF analysis (Ti(IV)sulfate, ash, rutile,

anatase) (black lines) and LCF-based reconstructed spectra (red lines). The vertical lines f1-f5 at 4970.9, 4974.5, 4987.0, 4990.0 and 4992.0 eV guide the eye to

features discussed in the text. (b) LCF-derived fractions of reference spectra. Tabulated LCF results and fit quality parameters are given in Table S6.

(11)

hematite (Maslen et al., 1994) (Ti-sub Hem) and an ilmenite (Harrison et al., 2000) TiO

6

octahedron substituting the central FeO

6

octahedron in hematite (Maslen et al., 1994) (Ilm-sub Hem) are displayed in Fig. 5.

Further, the experimental ilmenite spectrum (Ilm (exp.)) and the ash spectrum are given (Fig. 5).

In the Fe

3-x

Ti

x

O

4

series, the shape of the Ti K-edge XANES only weakly depends on x (Droubay et al., 2011; Pearce et al., 2012), and small differences mainly concern the intensity of the first and most prominent feature after the edge (Pearce et al., 2012). Therefore, we only present the calculated spectrum of Ulv (Fe

2

TiO

4

(x = 1)). The pre-edge feature of Ulv 0.1%[Ti

4+

]

(T)

was of high intensity relative to the main edge, in agreement with Ti located in tetrahedral sites. In Ulv, the calculated pre-peak was well aligned with the pre-peak observed in the ash XANES, however, the features in the main edge deviated considerably from the features observed in the experimental spectra

(Fig. 5a). The same holds true for Ulv 0.1%[Ti

4+

]

(T)

. Based on these spectral discrepancies, the fraction of Ti in phases from the Mag-Ulv solid solution series was considered negligible in the ash samples.

The calculated XANES spectra of PB and PFB showed one prominent oscillation in the pre-peak range, which however was shifted to higher energies compared to the pre-edge features in the ash spectrum.

Furthermore, the features in the main edge were shifted to lower en- ergies compared to the ash spectra. Therefore, also the sequestration of Ti into phases of the PB-PFB solid-solution series during incineration process seemed negligible.

Calculated spectra of members of the Hem-Ilm solid solution series (Ilm (calc.), Ilm70) and Ti or Ilm substituted spectra (Ti-sub Hem, Ilm- sub Hem) matched the ash spectrum best. We selected 6 features (f1- f6, vertical lines, Fig. 5) to compare the ash spectrum with the relevant spectra (bold red curves). The first two oscillations in the pre-peak area

Fig. 7. STEM-EDS elemental distribution maps obtained on the sample An-ap. Panels (a, d and g) show HAADF images of three individual ash grains, panels (b, e and

h) show the distribution of Ti (red) and Fe (green) and panels (c, f and i) show extracted Ti and Fe signal intensities along the grey lines ( “ line profiles ” ). The scanning

direction is from left to right in (b) and (e) and top to bottom in (i).

(12)

(f1, f2) observed in the ash were also present in the experimental spectrum of ilmenite. The latter oscillation (f2) was also well repre- sented by Ilm-sub Hem which nicely reproduced the pre-edge features. A feature in the edge (f3) was less prominently expressed in the ash spectrum as compared to the experimental ilmenite spectrum and is closer in shape to Ilm70 and Ti-sub Hem. The same holds true for a shoulder at the edge (f4) and the shape of the most prominent oscillation in the ash (f5). The peak beyond the edge (f6) in the ash was present in Ilm70, Ti-sub Hem and Ilm (calc), but shifted by − 2 . 0 eV in Ilm (exp.).

Overall, the pre-edge features and the features of the main edge observed in the ash spectrum are best represented by Ilm and Ti-sub Hem, respectively. The spectrum of the Ilm-sub Hem structure, where an FeO

6

octahedron (hematite geometry) was replaced by a TiO

6

octa- hedron (ilmenite geometry), and also the spectrum of Ilm (calc.) accu- rately reproduced the pre-edge features from the ash spectrum, but failed to describe the main edge features.

At the solidus, FeTiO

3

and Fe

1.3

Ti

0.7

O

3

crystallize in the ordered R3 and the disordered R 3 c structure, respectively (Burton, 1985). Assuming equilibration cooling, Fe

1.3

Ti

0.7

O

3

transforms to the ordered structure at 900

C and at ≈ 650

C a first solvus is reached where Fe

1.3

Ti

0.7

O

3

exsolves into an ordered titanium richer matrix and iron richer lamellae (McEnroe et al., 2002; Robinson et al., 2002). At 500

C both matrix (composition at 500

C: Fe

1.15

Ti

0.85

O

3

) and lamellae (Fe

1.75

Ti

0

.

25

O

3

) cross a second solvus exsolving into a matrix and lamellae which at 300

C reach almost end-member compositions (Fe

2

O

3

and FeTiO

3

).

Based on the qualitative similarities between the calculated spectra and the ash spectra, and including the above discussion, two structures incorporating Ti are conceivable; (i) individual TiO

6

octahedra occu- pying FeO

6

sites in hematite, or (ii) ilmenite-like domains in a hematite matrix.

The former structure is supported by the agreement between the shape of the main oscillations in the ash and Ti-sub Hem spectra. In contrast, the latter structure better fits the pre-edge features observed in ash and ilmenite (Fig. 5, Table 1, Section 3.2.3). STEM-EDS data pointed to the formation of ilmenite (Fig. 4d − f) but most often only small amounts of Ti were observed together with iron-dominated – most likely hematite – particles. It is possible that the Ti associated with the he- matite particles is present as individual ilmenite nano-lamella, formed through phase separation during the cooling process (Fig. 4g − l). In this case, the presence of Fe in a hematite structure in the second shell

Fig. 8. STEM-EDS elemental distribution maps from the sample Ru-ap. Panels (a, d and g) show HAADF images of three individual ash grains, panels (b), (e) and (h)

show the distribution of Ti (red) and Fe (green) and panels (c), (f) and (i) show Ti and Fe intensities extracted along the grey lines (“line profiles”). The scanning

direction is left to right. The yellow rectangle in (a, b) indicates the subset that is shown in (g, h).

(13)

relative to the absorber (Ti) is highly probable, and would explain the similarity between the shape of the features in the main edge observed in the ash and Ti-sub Hem spectra.

3.3. The transformation of anatase NP and rutile particles during sludge incineration

To assess the transformation of anatase and rutile during sewage sludge digestion and incineration, we determined the Ti speciation in sludge that was spiked with either anatase (d = 20 – 50 nm) or rutile (d = 200 – 400 nm) particles and subsequently anaerobically digested for 2 weeks, as well as in the ashes obtained by the incineration of these digested sludges. In addition, the speciation of Ti in the as received (anaerobically digested) sludge (S) before spiking was evaluated.

Based on the previous discussion, we lack the spectrum of an important reference phase – most likely Ilm clusters in a Hem matrix – to adequately describe the experimental ash spectra. Therefore, the ash spectrum which was introduced in Section 3.2 was used as a reference spectrum to represent the sum of Ti( − Fe) phases formed during the incineration of sewage sludge. In total, four spectra were used to eval- uate the spectra of the digested sludges and the ashes by LCF analyses:

anatase, rutile (spiking materials, Section 2.2), Ti(IV)sulfate and the ash (Fig. 6).

The LCFs described the experimental spectra well (Fig. 6a and Table S6). The LCF of the as received sludge (S) returned ≈ 40% anatase and 60% rutile (Fig. 6b), in agreement with LCF results obtained for sludges A, B and C from full-scale treatment plants (Section 3.2.2). The added phase dominated the spectra of the digested anatase- or rutile- spiked sludges (An-s and Ru-s, Fig. 6). This confirmed that the spiked amounts of Ti substantially exceeded the native Ti level, and indicated that transformation of anatase or rutile during anaerobic digestion was insignificant.

In the results of the LCFs to fly ash and the bottom ash of the anatase spiked sludge (An-ap, An-ap-b), the ash and Ti(IV)sulfate appeared as additional phases, together representing approximately 60% of the LCF in agreement with the changes in intensity at the energies of the most prominent oscillations (f3-f5, Fig. 6a,b). The presence of up to 20% of rutile in An-ap suggested the transformation of parts of the anatase into rutile as expected considering the incineration temperature, which is well above the reported transformation temperature range for the metastable anatase to stable rutile transformation (Hanaor and Sorrell, 2011).

For the ashes resulting from incineration of the rutile-spiked sludge Ru-ap and Ru-ap-b, LCF analysis returned about 30% and 60% of the ash plus Ti(IV)sulfate (Fig. 6b). Rutile contributed 60% and 40% to the LCF results for Ru-ap and Ru-ap-b, respectively. The higher degree of rutile transformation in the bottom ash as compared to the fly ash was most probably due to the longer fluidized bed contact times and thus pro- cessing time of the bottom ash. Conversely, this also indicated that in contrast to the anatase NP, the transformation of rutile into Hem-Ilm phases in the fly ash was kinetically limited.

In all ash samples obtained through incineration of spiked sludge, but most prominently in Ru-ap and Ru-ap-b, the f1 peak of the fit is shifted by + 0.3 eV compared to the experimental data (f1, Fig. 6a). Also, the f2 peak (present in all reference spectra except in the ash spectrum) is more prominently expressed in the fit compared to the experimental data. This indicated that the average phases suggested by the pre-peaks are closer to the ash as compared to the XANES oscillations dominating the LCFs. Therefore, independent of the short and long range order, the distortion of the first oxygen shell in the experimental ash spectra derived from the spiked sludges – reflected by the pre-peak features – was comparable to the distortion of the in Ti octahedron in ash or ilmenite (Table 1).

In conclusion, anatase NP largely transformed into novel phases during sludge incineration, whereas a significant fraction of the larger

rutile particles only transformed after prolonged bed contact times. In a previous publication, we showed that the transformation of CeO

2

-NP during sewage sludge incineration was dependent on the primary par- ticle size, that smaller particles were more readily transformed, and that the transformation of larger particles was more extensive in bottom than in fly ash (Gogos et al., 2019). Therefore, variations in the extent of TiO

2

transformation during incineration in the present study may have been due to both, the size-dependence as well as differences in the thermo- dynamic stability of the studied materials.

3.4. Sub-micron Fe and Ti distribution in fly ash derived from TiO

2

spiked sludge

HAADF images (Fig. 7 and Fig. 8a,d,g) and elemental distribution maps (Ti in red, Fe in green, Fig. 7 and Fig. 8b,e,h) were recorded on samples An-ap and Ru-ap to identify individual transformation products.

Fe and Ti, being close in the periodic table, have similar K α − X-ray production rates as well as absorption and fluorescence behaviors.

Therefore, the intensity ratio between the two elements is approxi- mately equal to the concentration ratio. Line profiles indicate the cor- relation between the Ti and Fe signal intensities/concentrations (Fig. 7 and Fig. 8c,f,i).

In An-ap, Ti and Fe were both unevenly distributed on the sub- micron scale, with Ti being less abundant (Fig. 7b,e,h). In selected particles (Fig. 7b,h), the signal intensities of Fe and Ti along two line profiles were well correlated (Fig. 7b,d), although with different in- tensity ratios, indicating the presence of Ti and Fe in the same particles.

This suggests that Fe and Ti - Ti likely originating from the spiked anatase NP - formed novel Fe-Ti phase(s) with different Fe/Ti ratios during the incineration. Other particles contained only one of the two elements (Fig. 7e,f) suggesting that Ti was also present as TiO

2

and Fe as Fe

2

O

3

.

In Ru-ap, particles containing either only Ti or only Fe were present (Fig. 8b,e,h). In Fig. 8b, a Ti particle is coated by a Fe corona suggesting the formation of Ti-Fe phases at the interface possibly formed by solid state diffusion (Ren et al., 2013). Similar structures are visible in the upper right part of Fig. 8h.

The spatial distribution of Ti and Fe on a sub-micron scale is in agreement with the XAS data, which indicated that hematite and anatase NP formed phases on Fe

2−x

Ti

x

O

3

solid solution which eventually exsolved to hematite lamellae and an ilmenite rich matrix. When larger rutile particles were spiked, the reaction progress was insufficient to transform the entire particles leading to corona textures.

4. Conclusion

We investigated the transformation of Ti in ash obtained through incineration of digested sewage sludge and (nano) Ti spiked sludge using XAS and STEM-EDS. The Ti speciation analysis conducted on digested sludge samples collected at four WWTPs plants in Switzerland revealed that Ti was dominantly present as rutile and anatase. During the anaerobic digestion, the speciation of the Ti remained unaltered.

Therefore, the application of digested sludge as fertilizer results in considerable emissions of “unreacted” TiO

2

-NP into agricultural soils.

Through incineration, the Ti speciation significantly changed and TiO

2

particles reacted to phases on the hematite-ilmenite solid solution series

or Ti substituted for Fe in hematite. Ilmenite can weather to pseudorutile

in open landfill sites (Scheinost, 2005). During the incineration process,

anatase, mainly representing an engineered nanomaterial, reacts to a

higher degree compared to larger rutile particles and indicates faster

reaction kinetics for smaller particles. Therefore, this study highlights

the need to look beyond bulk material properties when evaluating the

fate of ENP, which is in line with size dependent transformation rates of

CeO

2

-NP (Gogos et al., 2019) observed during incineration. The for-

mation of new transformation products with different physical chemical

properties may also affect the resource recovery processes. A currently

Abbildung

Fig. 1. (a) Ti concentrations of the samples discussed in the text in mg/kg. Tabulated data can be found in Table S1
Fig. 2. (a) Ti  K-edge XANES spectra of selected reference materials and sludge and ash samples (black lines), together with linear combination fits (LCF) to the  sample spectra (red lines)
Fig. 3. Pre-edge features of ilmenite, the ash and Ti(IV)sulfate spectra (stacked  with offsets  μ norm = ( 0 ; 0
Fig. 4. HAADF images (a, d, g, j), elemental distribution maps (b, e, h, k) and extracted line profiles (c, f, i, l) from ash grains of the sample A-af (green: Fe; red: Ti)
+4

Referenzen

ÄHNLICHE DOKUMENTE

Experiments at high pressure and temperatures performed here, using piston cylinder and multi anvil presses showed that quenched samples of rutile, anatase and high

In the absence of O 2 it is proposed that an adsorbed acetaldehyde molecule reacts with a bridging oxygen atom from the TiO 2 lattice forming acetate which is

The achieved results confirmed that magnetic proxy parameters provide significant results for industrial pollution monitoring in the steel and iron manufacturing industry, for

For evaluating the possibility of the occurrence of dust explosions, the critical parameters are the explosion indices maximum explosion overpressure (p MAX ), maximum rate of

These legal developments and approaches lead to a strong focus on the thermal utilisa- tion of sewage sludge. It is important to take a closer look at its properties. Sewage sludge

In the following paragraphs, the current sewage sludge treatment typical for Austria, Germany, Switzerland is described and alternatives to existing processes currently

The co-incineration of sewage sludge in waste incineration plants, coal-fired power plants and cement works can only be regarded as a temporary solution since phosphorus, an

As an option, systems for raw sludge pre-treatment like sludge preheater and centrifuges for dewatering can be added to the treatment process at sewage treatment plants.. The