AUS DEM LEHRSTUHL FÜR
KLINISCHE CHEMIE UND LABORATORIUMSMEDIZIN PROF. DR. GERD SCHMITZ
DER FAKULTÄT FÜR MEDIZIN DER UNIVERSITÄT REGENSBURG
POSTPRANDIAL LIPIDOMIC RESPONSE IN DIABESITY AND THE METABOLIC SYNDROME
Inaugural – Dissertation zur Erlangung des Doktorgrades
der Medizin der
Fakultät für Medizin der Universität Regensburg
vorgelegt von Afssun Kaviany
aus Gießen
2014
Dekan: Prof. Dr. Dr. Torsten E. Reichert 1. Berichterstatter: Prof. Dr. Gerd Schmitz
2. Berichterstatter: PD Dr. Marcus Fischer Tag der mündlichen Prüfung: 16.Juli 2015
Table of Contents
1 Introduction ... 8
1.1 Definition of the metabolic syndrome and obesity ... 10
1.1.1 Obesity ... 10
1.1.2 Metabolic syndrome ... 10
1.2 Lipid metabolism ... 12
1.2.1 Normal lipid metabolism ... 12
1.2.2 Disorders of lipid metabolism in diabesity ... 14
1.2.3 Adipose tissue metabolism ... 15
1.3 Etiology and pathogenesis of obesity and the metabolic syndrome ... 16
1.4 Consequences and clinic of obesity and the metabolic syndrome ... 17
1.4.1 Diabetes in metabolic syndrome... 18
1.4.2 Inflammation in the metabolic syndrome ... 20
1.5 Adipokines ... 21
1.5.1 Leptin ... 21
1.5.2 Adiponectin ... 22
1.5.3 Omentin ... 23
1.6 Lipids ... 23
1.6.1 Plasmalogens ... 24
1.6.2 Fatty acids ... 25
1.6.3 Phosphatidylcholine and Lysophosphatidylcholine ... 25
1.6.4 LPA ... 25
1.6.5 Sphingomyelin and ceramides ... 26
1.7 Current biomarkers ... 26
1.8 Aim of the study ... 26
2 Materials and Methods ... 28
2.1 Materials ... 28
2.2 Selection of subjects and stratification ... 29
2.3 Design ... 30
2.4 Laboratory parameters ... 31
2.4.1 Lipid mass spectrometry ... 31
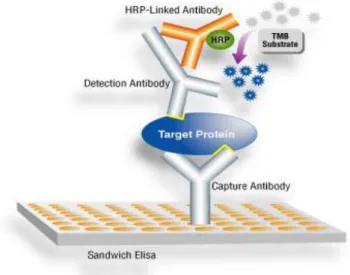
2.4.2 ELISA ... 35
2.4.3 EIA ... 37
2.4.4 Clinical chemistry ... 38
2.4.5 Hematology ... 38
2.5 Statistical analysis ... 38
3 Results ... 40
3.1 Subject characteristics ... 40
3.2 Composition of the fat drink ... 45
3.3 Plasma lipids ... 47
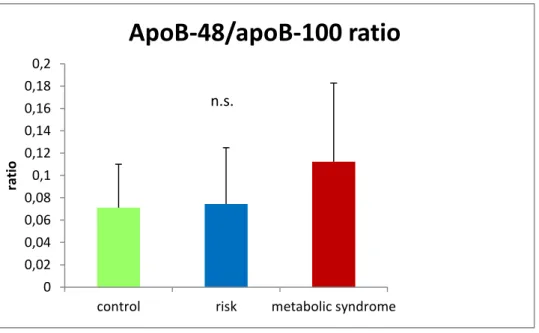
3.3.1 Lipoprotein transport from the intestine: Chylomicron and apoB-48 ... 47
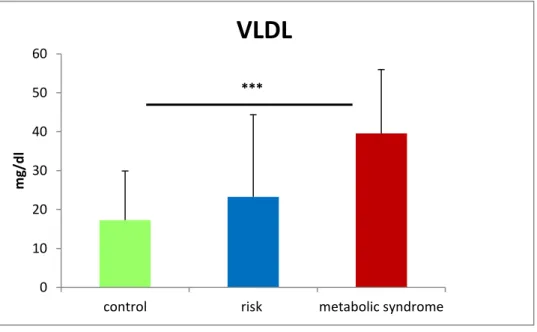
3.3.2 Lipoprotein transport from the liver: VLDL and apo-B 100 ... 48
3.3.3 Free fatty acids ... 49
3.3.4 Cell death, ceramide with antagonistic effects ... 57
3.3.5 Signal transduction, Sphingolipids ... 58
3.3.6 Antioxidants: Plasmalogens ... 62
3.3.7 Lysophosphatidylcholine, lysophosphatidic acid ... 73
3.4 Inflammatory markers in the blood compartment ... 87
3.5 Adipose tissue hormones ... 90
3.5.1 Omentin ... 91
3.5.2 Leptin ... 92
3.5.3 Adiponectin ... 93
3.5.4 Leptin-adiponectin ratio ... 94
3.6 Gastrointestinal tract: Ghrelin ... 95
3.7 Renal system ... 97
3.7.1 Creatinine ... 97
3.7.2 FGF-23 ... 98
4 Discussion ... 101
4.1 Accuracy of choice of stratification criteria ... 101
4.1.1 Lipid vehicles and other Cholesterol fractions ... 102
4.2 Adaptation to metabolic syndrome by acute and chronic changes of the physiology in metabolic syndrome subjects ... 104
4.2.1 CVD association with postprandial state marked by acutely elevated-chylomicron concentration ... 104
4.2.2 Liver: Chronically elevated VLDL secretion due to elevated TAG production ... 107
4.2.3 Fatty acids: Comparison of the baseline levels, dynamic over time and transformation catalyzing enzymes of the cytotoxic and protecting fatty acids ... 108
4.2.4 Fasting and postprandial sphingomyelin profile as risk indicator ... 111
4.2.5 Antioxidants: plasmalogen down-regulation in metabolic syndrome subjects ... 112
4.2.6 Differences in dynamic and baseline plasmalogen levels ... 114
4.2.7 Proapoptotic and protective ceramides and risk for metabolic syndrome ... 116
4.2.8 Low LPC species, increased mortality and sepsis ... 116
4.2.9 Lower immunomodulatory lysophosphatidic acid in metabolic syndrome subjects ... 118
4.2.10 Correlations between PC and LPC species ... 119
4.2.11 Inflammatory markers and chronic inflammation in the metabolic syndrome ... 121
4.2.12 Functional changes of the adipose tissue ... 122
4.2.13 Changes in the renal system and FGF-23 in the metabolic syndrome ... 126
5 Summary ... 128
6 Zusammenfassung ... 130
7 Appendix ... 133
7.1 Abbreviations ... 133
7.2 Questionnaire ... 137
7.3 CURRICULUM VITAE ... 140
7.4 Presentation ... 141
7.5 Grants ... 141
7.6 Acknowledgements ... 141
7.7 Supplement ... 143
7.7.1 Apo A-I ... 143
7.7.2 Fatty acids ... 143
7.7.3 SPM ... 147
7.7.4 Plasmalogens ... 151
7.7.5 LPC ... 152
7.7.6 PC and LPC ... 156
8 References ... 161
1 Introduction
“Diabetes and cardiovascular disease (CVD) are, together with cancer and chronic respiratory disease, the world’s biggest killers, causing an estimated 35 million deaths each year, 80% of which are in low- and middle-income countries.” [1].
In 2008, the WHO estimated that more than 10% of the world’s adults – 1.4 billion adults in total – were overweight. The incidence of overweight is age-dependent and increases between the ages of 20-50 and decreases between the ages of 60 and 70 [2]. The WHO published an estimate for 2010, according to which 77.2% of men in Germany over the age of 30 had a BMI higher than 25. Of the 1.4 billion adults, over 200 million men were obese [2]. Obesity is a spreading disease, which is not only a serious problem in high-income countries, but also a rapidly growing problem in developing countries. The prevalence of obesity is progressing worldwide [2].
The graphic of the international association for the study of obesity in Figure 1 shows the prevalence of obesity on the different continents.
Figure 1: Prevalence of obese men in the world, published by the international association for the study of obesity in 2012 (1).
Worldwide, at least 2.8 million adults die each year as a result of being overweight or obese [2]. In addition, 44% of the diabetes burden, 23% of the ischemic heart disease burden and between 7% and 41% of certain cancer burdens are attributable to overweight and obesity [2].
The following graphic by the DAG (Deutsche Adipositas Gesellschaft) (Figure 2) represents the weight distribution (%) of the German population in the years 2005/06. It shows that in total, more than half of the German population (58.2%) suffered from overweight and obesity.
20.8% were obese and 37.4% were overweight, but there are only 40.4% of the population with normal weight. In summary, it can be said that overweight is also a significant problem in Germany.
Figure 2: Deutsche Adipositas Gesellschaft (DAG) representation of the percentage of obese, overweight, healthy weight and underweight people in Germany (2).
The metabolic syndrome, classified by ATP (Adult Treatment Panel) III criteria, in Germany in 2007 showed a prevalence of 18% in women and 25% in men [3]. The risk of a cardiovascular event in subjects with metabolic syndrome is about three times higher than in the normal population [3]. 60% of all subjects with hypertension have the metabolic syndrome [4].
The metabolic syndrome represents a complex medical condition which is associated with an increased risk for the development of diabetes, chronic low-grade inflammation of the vessel wall, stroke and cardiovascular disease. Interest in the metabolic syndrome has been increasing since diseases connected to it are major health problems in industrialized countries.
Early detection and individualized risk stratification are key factors in lowering disease-
Obesity Underweight Healthy weight Overweight
related morbidity and mortality connected to obesity, type 2 diabetes and the metabolic syndrome.
1.1 Definition of the metabolic syndrome and obesity
1.1.1 ObesityThe DAG (Deutsche Adipositas Gesellschaft) and WHO (World health organization) define obesity as more than normal or excessive accumulation of fat tissue in the body, which results in too much weight and presents risks to health [2], [5]. One way to measure obesity is the body mass index (BMI), i.e. a person’s weight (in kilograms) divided by the square of his or her height in meters. A person with a BMI equal to or more than 25 is considered overweight [2]. A person with a BMI of 30 or more is generally considered obese[2] .
The WHO classifies obesity into three groups [6]:
I: BMI: 30-34.9 II: BMI: 35-39.9 III: BMI: > or = 40
Since obesity-associated diseases correlate with abdominal fat, the waist circumference or the waist-to-hip (W/H) ratio is more accurate than the BMI, because the BMI does not distinguish between central and peripheral obesity [6]. In Europe, a waist circumference of over 88 for women and over 102 cm for men is a sign of abdominal obesity [7] .
1.1.2 Metabolic syndrome
“Metabolic syndrome (MS) is considered a medical condition caused by over-nourishment and reduced physical activity as a consequence of industrial revolution and affluence, being the most frequently referred disorder in the recent literature. However, there is no general agreement regarding its denomination, and various synonyms exist in the literature such as Wohlstands syndrome, plurimetabolic syndrome, hormonal metabolic syndrome, syndrome X, insulin resistance syndrome, and hyperinsulinemia/insulin resistance syndrome” [8] Alberti et al. described the metabolic syndrome as a complex of interrelated risk factors for morbidity and mortality of cardiovascular disease (CVD) and diabetes [9]. Even though there is no common definition for metabolic syndrome, there is a consensus in the medical field that the term metabolic syndrome is acceptable for the condition of the presence of multiple metabolic
risk factors for CVD and diabesity [7]. All major health organizations deal with dyslipidemia with an increased plasma TAG (Triacylglyceride) concentration, decreased HDL (High density lipoprotein) concentration, hypertension, impaired glucose tolerance, and overweight (Table 1).
Metabolic risk factor
World Health Organization
NCEP ATP III (2001)
AHA/ATP III(2004) International Diabetes Federation 2005
Insulin Resistance
Required (Impaired fasting glucose, impaired glucose tolerance, T2D)+two other risk factors
Not required;
any three of the five risk factors
Not required;
any three of the five risk factors
Not required
Obesity Waist-to-hip ratio
≥0.9
WC ≥ 102 cm WC ≥102 cm Required + two other
risk factors, waist circumference 94 cm
TAG ≥150 mg/dl ≥150 mg/dl ≥150 mg/dl ≥150 mg/dl
HDL <35 mg/dl <40 mg/dl <40 mg/dl <40 mg/dl
RR >140/90 mm Hg >130/90 mmHg or on
medication
>130/90 mmHg or on medication
≥130/85 mmHg
Glucose IGF, IGT, or T2D ≥110 mg/dl ≥100 mg/dl ≥100 mg/dl
Other Albumin-to-
creatinine ratio >30 mg/g
Includes T2D Includes T2D Ethnic cutoffs for WC
Table 1: Different definitions of metabolic syndrome by the different organizations (3).
The metabolic syndrome is not an absolute risk indicator or a score like PROCAM (Prospective cardiovascular Münster) that could be applied in order to calculate the risk, because it does not contain many of the factors that determine absolute risk, for example age, sex or cigarette smoking [7]. “In the absence of CVD or diabetes, the metabolic syndrome is a predictor of these conditions. Once CVD or diabetes develops, the metabolic syndrome is often present, and the number of components of the metabolic syndrome contributes to disease progression and risk” [7]. Recently the WHO proposed the waist-to-hip (W/H) ratio [10] and the NCEP (National Cholesterol Education Program) proposed waist circumference as overweight criteria [10], but the International Diabetes Federation (IDF) suggests that obesity can be assumed at a BMI over 30 without measuring waist circumference. The different organizations have now agreed on waist circumference as a common standard [7],
[11]. In 2005, the IDF and the American Heart Association/National Heart, Lung, and Blood Institute (AHA/NHLBI) attempted to reach an agreement for the different clinical definitions of the metabolic syndrome. However, despite all efforts, a common agreement is far beyond reach. The IDF dropped the WHO requirement for insulin resistance but instead declared abdominal obesity to be one of the five factors required in the diagnosis [12]. Abdominal obesity can be determined by focusing on waist measurement as a simple screening tool. The remainder of the criteria was identical to those provided by ATP III. The AHA/NHLBI did not list abdominal obesity as a required risk factor, but slightly modified the ATP III criteria.
Recently, IDF and AHA/NHLBI representatives held discussions to resolve the remaining differences between their definitions of the metabolic syndrome [7]. Both sides agreed that abdominal obesity should not be a prerequisite for diagnosis, but included as one of five criteria, so that the presence of any three out of five risk factors constitutes a diagnosis of metabolic syndrome, as ATP III criteria have suggested before [7]. The WHO defines two levels of abdominal obesity in Europe depending on the risk for metabolic complications.
There is an increased risk for waist circumferences of ≥94 cm in men, but the risk is substantially higher at ≥102 cm [7]. In this work, the IDF criteria for group stratification were applied. Our patients were exclusively from Europe. The IDF proposes reference values for the waist circumference adjusted to ethnicity. If waist circumference is used as mandatory criterion, makes no difference for our distribution into the groups.
1.2 Lipid metabolism
1.2.1 Normal lipid metabolism
Lipophilic lipids need transport vehicles. Those transporting lipoproteins are particles classified by their density. They contain neutral lipids (Cholesterylesters, Triacylglycerides) in their core and polar lipids (phospholipids, fatty acids, sterols) at the surface.
Triacylglyceride (TAG)-rich lipoproteins originate either from the intestine (chylomicrons) or from the liver (VLDL) [13]. Their specific apolipoproteins permit their characterization.
ApoB-48 is a specific apolipoprotein for chylomicrons and their remnants [14]. Chylomicrons (CM) transport exogenous TAGs. The lipoproteins undergo lipolysis in the circulation, thereby delivering fatty acids to tissues [13]. After reaching the plasma compartment, the chylomicrons release their apo A-I content during lipolysis and swap it for apo-CII [15]
(Figure 3).
Figure 3 [13] Lipid transport: The TAG-rich lipoproteins are chylomicrons and VLDL. Chylomicrons are secreted by the intestine and carry the chylomicron-specific apolipoprotein apoB-48. They are split by LPL into small remnants which can be absorbed by the liver. VLDL are secreted by the liver which secrets the apolipoprotein apoB-100. LDL, a cholesterol-rich protein, is formed out of VLDL and by the liver. Since its half-life is longer than that of VLDL, the apoB-100 in plasma is mainly in LDL. HDL’s main apolipoprotein is apo A-I. Apo A-I is secreted by the liver and intestine. HDL is secreted by the liver and can carry more than one apoA-1, unlike LDL which only carries one apoB-100. HDL picks up cholesterol from the cell and transports it in the form of ester. It is able to make an exchange with VLDL by taking up TAGs from VLDL. Since TAG-richer HDL has a shorter half-life than the other HDLs, the HDL concentration in plasma negatively correlates with the TAGs concentration.
This enables them to bind to endothelia-associated LPL (lipoprotein lipase) and to degrade their TAGs [16]. Chylomicrons have a half-life of approximately 5 minutes [16], whereas CM remnants have a much longer half-life time [16]. Chylomicron remnants and about half of the VLDL remnants are alternatively taken up by the liver [13]. Excess fatty acids and diglycerides in the liver induce very low density protein (VLDL) synthesis and secretion [16].
VLDL and CM are both degraded and generate the HDL precursor [16]. HDL is formed in the circulation from lipid-poor and protein-rich lipoprotein particles secreted by the liver and intestine and formed from surface components shed during the lipolysis of TAG-rich lipoproteins [13]. VLDL remnants are also metabolized to IDL and cholesterol-rich LDL, which constitutes the main cholesterol-carrying lipoprotein in humans [13]. For this cycle, LPL activity is essential and VLDL and chylomicrons compete for LPL-dependent acyl glycerol degradation [16]. Over 65% of the LDL is degraded after binding to LDL receptors in peripheral cells and hepatocytes. 15% are degraded by scavenger pathways in blood vessels.
Macrophages, which are also called scavenger cells because they carry scavenger receptors, take up chemically modified LDL such as oxidized LDL [15]. Increased levels of oxidized LDL are highly atherogenic [17]. Remnants formed during the cleavage of TAG-rich lipoproteins are also atherogenic [18]. However, remnants are rapidly and efficiently cleared from the circulation by hepatocytes which catabolize them [19].
1.2.2 Disorders of lipid metabolism in diabesity
Elevated LDL can be due to a primary hereditary dyslipoproteinemia such as LDL receptor defect or impaired LPL activity, but also to a high alimentary input of saturated fatty acids (FA) [20] and cholesterol. The most common dyslipidemias are familial hypertriglyceridemia and familial combined hyperlipidemia (FCH). FCH includes intra-individual and intrafamilial variability of the lipid phenotype [21]. What characterizes FCH are elevated LDL (low- density lipoprotein) cholesterol, especially the small dense LDL particles [21], and elevated triglyceride levels [22], often combined with a high prevalence of small very-low-density lipoproteins (VLDLs). The latter are mainly associated with an increased plasma level of apolipoprotein B-100 [21]. Patients with FCH show a relatively greater increase in apoB-100 compared to the TAG increase [23]. Some patients may show a decrease in high-density lipoprotein (HDL) cholesterol plasma level [21]; [24]. Non-HDL cholesterol is elevated [25].
Stratification according to Fredrickson:
Type Elevated lipid fraction
I Chylomicrons
IIA LDL
IIB LDL and VLDL
III ß-VLDL (E2/E2)
IV LDL
V VLDL and Chylomicrons
Hypertriglyceridemia can also be caused by high caloric input and increased fat and glucose intake [20]. Disturbances of the lipid metabolism can also be due to secondary diseases such as hypothyroidism, nephrotic syndrome, and cholestasis [20], which can be responsible for high cholesterol levels. Diabetes mellitus, obesity, alcoholism and terminal kidney insufficiency, on the other hand, can result in hypertriglyceridemia and low HDL levels. What is important is the distribution of LPL among tissues [26]. As Wang et al. described in 2009, a
loss of LPL in muscle cells can lead to obesity and insulin resistance in cells other than the skeletal muscle [26].
1.2.3 Adipose tissue metabolism
Adipose tissue can be divided structurally, functionally and topologically into white and brown as well as into visceral and subcutaneous fat. It is not only a storage organ, but has many different modulatory functions in the endocrine and immune system. Brown adipose tissue, which is nearly absent in adults, is essential for children in order to maintain their body temperature. It uncouples oxygen via uncoupling protein (UCP) from ATP (adenosine triphosphate) production to produce heat and ROS (Reactive Oxygen Species) [27]; [28]. In healthy subjects with normal caloric intake, the caloric output can be induced via adrenergic receptors. The increased cAMP (cyclic adenosine monophosphate) can then trigger the caloric output via activation of thyroid hormone and UCP [27]; [28]. In obese subjects, the UCP pathway is less frequently provoked due to an increase in SHP (small heterodimer partner), which itself triggers diet-induced obesity and an impaired glucose tolerance [27], [28].The white adipose tissue, which is subject of this work, contains adipocytes, preadipocytes, fibroblasts, leukocytes, macrophages and endothelial cells; it provides energy and fatty acids from its stored lipids.
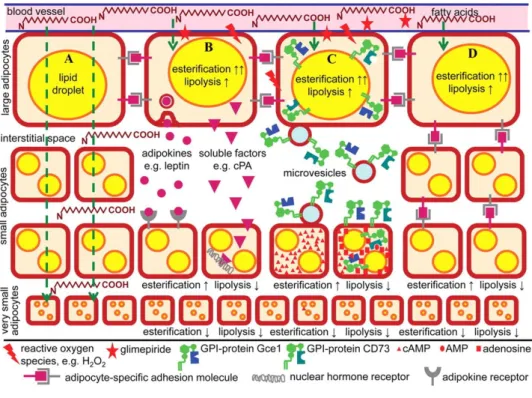
Figure 4: Communication between large and small adipocytes, involving cell-to-cell contact and signal peptides like adipokines (4). The resulting parallel upregulation of esterification (↑) and downregulation of lipolysis (↓) leads to an enlargement of the lipid droplets and the size of the adipocytes [29].
Moreover, white adipose tissue produces hormones and adipokines as well as influences different bodily functions. Large adipocytes secrete adipokines and microvesicles, which are taken up by small adipocytes, switch off lipid release and switch on storage. This process leads to a conversion into large adipocytes [29] (Figure 4).
1.3 Etiology and pathogenesis of obesity and the metabolic syndrome
The development of obesity is associated with multiple factors. The reasons for obesity can be summarized as a drift of energy homeostasis to the positive side (orexia). A positive energy balance is caused by excessive food intake, especially saturated FAs, and a lack of physical activity, which are the main reasons for obesity [30]. This shift from a balanced energy to a positive energy balance can also be the consequence of a lack of the hormone leptin due to a genetic mutation or a defect of the receptor. There can be also a defect in the α-MSH (melanocyte stimulating hormone) liberation, for example due to an enzyme defect or a lack of the receptor of α–MSH [31]. It should be mentioned that studies have found a more significant relation between MSH and type 2 diabetes than between MSH and obesity [31].
Genetic influence is responsible for 40% of the cases of obesity [32]. The energy output is influenced by basic metabolism, thermogenesis and activity. During the development of obesity, the energy regime is kept positive by the input of rich and too much food. Later on, energy input and consumption are balanced, but due to the increased mass of fat, the basal metabolic rate is elevated. Urbanization and the modern lifestyle, in which less physical activity is combined with an elevated fat content in the diet, are almost certain to lead to progressing obesity [2]. Psychosocial factors can also influence the development of obesity:
anxious and depressive individuals are more likely to become obese [33]. The suggestion that a lack of sleep in youth leads to obesity has not been confirmed yet [34]. Of course, environmental factors such as the workplace may influence a person’s nutrition. People who work with food, for example butchers or bakers, are more frequently affected by obesity.
Notable relevance should be given to the impact of cultural and social values. Whereas in some cultures, obesity is a status symbol which makes overweight desirable, in other cultures it is not socially accepted [2], [35]. Endocrine reasons for overweight include Cushing’s syndrome, Hypothyroidism or Insulinoma [36]. Changes in the mass of adipose tissue, the hypertrophy and hyperplasia of adipocytes, connected with angiogenesis and proliferation and expansion of the extracellular matrix, lead to changes of metabolic pathways [37] and epigenetic modulation [38].
1.4 Consequences and clinic of obesity and the metabolic syndrome
The first symptoms of obesity are dyspnea, pain of angles and back, fatigue, cardiac problems, edematous legs in the evening, obstipation and mental stress. The associated risks of further diseases depend on the distribution of the fatty tissue (Figure 5). Even though women have more body fat than men, their pear-shaped body fat distribution is associated with lower cardiometabolic risk in contrast to the metabolic consequences of central obesity typical in men [39]. The pear-shaped phenotype reflects the subcutaneous white adipose tissue depots just under the skin, which are mainly in the gluteal and femoral areas, but also in the waist [39]. The intra-abdominal depots including visceral adipose tissue often consist of more, but less differentiated, adipocytes [39]. “Obese patients with the metabolic syndrome generally have a visceral (apple-shaped) fat distribution and are at an increased risk of macrovascular disease, while those with peripheral (pear-shaped) obesity do not tend to have metabolic abnormalities and are at lower risk” [40]. “This difference appears to be related to the differing metabolic functions (and secretory products) of visceral adipose tissue and subcutaneous adipose tissue, as well as the fact that visceral fatty tissue drains directly into the liver” [40].
Figure 5: Different types of fat distribution with different risk for associated diseases (5).
Both phenotypes (pear and apple) differ in their predominant type of growth [39]. With age, the capability of increasing the number of fat cells does not vanish, as has been suggested, but the fat cells mostly gain in size [41]. The consequence of excess lipid accumulation, even though it is limited to 0.8 µg per cell, is devastating. The change in number, unlike the change in size, is not reversible [42]. The change of the adipocytes’ size causes changes in the
composition of the cells, increases lipolysis and thus an elevation of the fatty acid concentration in the plasma, which then alters insulin sensitivity. The changes in number and size of adipocytes lead to changes in hormone and transmitter secretion and finally to a chronic state of inflammation in the entire body. Thus, the alteration of the tightly controlled compositions of the cell content causes the loss of specific functions. As a consequence, the risk of developing type 2 diabetes, hypertension, coronary heart disease, hypercoagulopathy, stroke, gallbladder disease, sleep apnea, osteoarthritis, osteoporosis and cancer is increased [41].
1.4.1 Diabetes in metabolic syndrome
Insulin synthesis
Proinsulin, the precursor of insulin, is synthesized in the rough ER of ß-cells in the pancreatic islands and plays a key role in insulin biosynthesis [43]. Proinsulin consists of the three polypeptide chains A, B and C, and their folding is ensured by three disulfide bridges [43,44].
The precursor of proinsulin is the mRNA pre-proinsulin [45] The pre-proinsulin is translated into a single polypeptide chain of polyribosomes associated with the rough ER [45]. During the transition through the rough ER, proinsulin is cotranslationally processed by the elimination of its signal sequence. Proinsulin forms its tertiary structure by intra-molecular disulfide bonding. The precursor was discovered as early as in 1967, and it changed the perception of hormone bio-synthesis [43]. Proinsulin is separated from its C-peptide, which is secreted in equimolar concentration as insulin, by the endocrine part of the pancreas [45]. The plasma concentration of C-peptide is used as a biomarker for endogenous insulin secretion.
Insulin secretion and impaired glucose tolerance
An increased plasma concentration of glucose, certain amino acids and acetoacetate, which is a product of ß-oxidation and fatty acids, up-regulates insulin secretion [46]. In the liver and pancreas, glucose is taken up via GLUT2 (glucose transporter) depending on the glucose concentration. But GLUT4, which is responsible for glucose uptake in adipose and muscular tissue, has also been identified in pancreatic cells [47]. GLUT2 only has a low glucose affinity (Km 17mM) and the velocity at which glucose is transported in the cell by GLUT2 cannot be increased by the blood glucose concentration, but the velocity by which the glucokinase works depends on glucose concentration and can be increased between blood glucose levels of 3 and 15 mmol/l [48]. The exocytosis of insulin containing granules of ß-cells from the
pancreas is regulated via mitochondrial ATP/ADP ratio, which increases in the presence of glucose [48]. Elevated ATP levels provoke the closing of potassium channels [48].
A closure of potassium channels results in a depolarization of the cellular membrane, which causes the calcium channel to open and finally an exocytosis of insulin granules [48]. The secreted insulin induces GLUT4 incorporation in the membranes of fat and muscle cells, where glucose is rapidly taken up via passive diffusion. This type of transport is called insulin-dependent glucose uptake [48]. This first phase of the insulin response lasts 2-5 minutes [49]. Insulin increases the V(max) of glucose elimination in the blood [48]. The danger of an insulin overdose lies in the increased insulin-dependent glucose absorption by muscle and fat tissue, whereas insulin-independent cells in the CNS may develop hypoglycemia. In the muscle tissue, glucose uptake results in increased glycolysis and glycogen synthesis; in the fat tissue, the elevated availability of acetyl-coA, which is dependent on the activity of the pyruvate dehydrogenase complex, results in a de novo synthesis of free fatty acids and their incorporation in TAG and thus increased lipid storage [48]. Insulin is an anabolic hormone which reduces lipolysis and activates liponeogenesis in the liver and in fatty tissue. The reduction of lipolysis implies lower free fatty acid (FFA) concentration levels in the plasma. In diabetics, the elevation of FFA in the plasma has lipotoxic effects [49]. Glucose tolerance can be maintained for a long time in obese individuals despite a decreased sensitivity to insulin. This is due to an increase of insulin secretion. The normal insulin secretion works by calcium-dependent exocytosis after an ATP- triggered cell depolarization. Insulin secretion can be either directly influenced by glucose or in a second step, which means by the metabolic intermediary products when pyruvate is converted to triglycerides. This mechanism is defined as “glucose-stimulated insulin secretion” (GSIS). Glucose-stimulated insulin secretion also has a long-term impact on glucose transport and utilization and is itself positively controlled by fatty acids and lipids in the plasma. For this second step of insulin secretion, the amplification phase is mediated by citrate, which is exported from mitochondria [50]. Citrate is a substrate and the resulting products are short-chain FAs which induce insulin secretion [50]. Thus, glucose increases its own insulin-dependent uptake with an autocrine amplifying mechanism, glucose-stimulated insulin secretion. Especially under fasting conditions, endogenous fatty acids are important for the secretion of insulin. The maintained insulin secretion is important in order to oppose lipolysis and its consequences, lipotoxicity and ketoacidosis. Exogenous, especially long and saturated, FAs can also amplify insulin secretion by GSIS [50]. This is necessary in order to develop an acute hyperinsulinemia to oppose the reduced glucose uptake. In the insulin-
resistant state, GSIS is not enhanced but even reduced by the chronically elevated fatty acid level. The exaggerated lipolysis leads to lipotoxicity and a false distribution of triglycerides as well as an insulin resistance of the affected organs. PPARs decrease the concentration of lipids in the blood via RXR, thereby opposing lipid-dependent insulin resistance. Thus they lower the need of increased insulin secretion. A chronic elevation of FA is a problem. In this state, GSIS is reduced, but the insulin secretion by other mechanisms is not affected or even enhanced.
From impaired glucose tolerance to type 2 diabetes
In impaired glucose tolerance, the first phase of insulin secretion is reduced, which results in high postprandial glucose levels, whereas fasting glucose levels are normal. Later, glucose levels are also elevated under fasting conditions, but basal insulin secretion can be kept normal by compensation. In manifest diabetes, basal insulin secretion can also be reduced.
Elevated plasma fatty acids as well as high insulin levels in the blood increase insulin resistance. High insulin levels in the blood are responsible for less insulin production, thus blood glucose remains high. The insufficient supply of the tissues with glucose leads to an increased glucose production by the liver. Since the hunger cannot be satisfied, the glucose intake is elevated as well. Insulin resistance is one of the main reasons for a higher glucose intake and thus obesity. It is triggered by inflammation, stress and free fatty acids.
1.4.2 Inflammation in the metabolic syndrome
Inflammation can be modulated via adipokines (signaling proteins that derive from the adipose tissue); therefore an increased volume of fatty tissue is associated with a chronic state of inflammation. The first link between obesity, insulin action and chronic inflammation involving TNFα was established in 1993 by Hotamisligil et al [51]. The workgroup named the chronic low-grade inflammation associated with overnutrition ”meta- inflammation” [52].
This meta-inflammation lowers adiponectin and insulin sensitivity, and it prevents the differentiation of preadipocytes into adipocytes. On the other hand, meta-inflammation is accompanied by a chronically increased macrophage concentration [52] and ER stress. The complex mechanisms have not been fully understood so far, but e.g. IKKβ are involved in the inflammation pathways, which results in the activation of NF-κB [53] as a mediator of TNF- induced insulin resistance as well as in the activation of serine/threonine protein kinases.
1.5 Adipokines
Since adipokines are cell-to-cell signaling proteins that derive from the adipose tissue, altered blood concentrations and dynamics reflect an altered physiology in subjects with changes in adipose cell number, volume and composition. Their modulating role in obesity, insulin resistance and inflammation have already been reported previously [54]. Their origin and site of action are graphically displayed below (Figure 6, Figure 7 Figure 9).
1.5.1 Leptin
Leptin is mainly expressed by adipocytes. It is also produced in the placenta, bone marrow, stomach, muscle and brain. Its main function is controlling the appetite. Leptin opposes adiponectin and acts as a proangiogenic and proinflammatory agent [55]. It stimulates the proliferation of circulating monocytes in vitro and up-regulates the expression of activation markers on monocytes and neutrophils. Leptin stimulates ROS production [55]. Moreover, Leptin regulates lipid metabolism (Figure 6). Leptin levels are increased in obese subjects.
Subjects with metabolic syndrome often prove insufficient regulation due to leptin resistance.
Figure 6: The peripheral action of leptin. Leptin is mainly secreted by adipose tissue and the gastric mucosa. It regulates appetite, inflammation and lipid absorption (Image taken from [56]).
1.5.2 Adiponectin
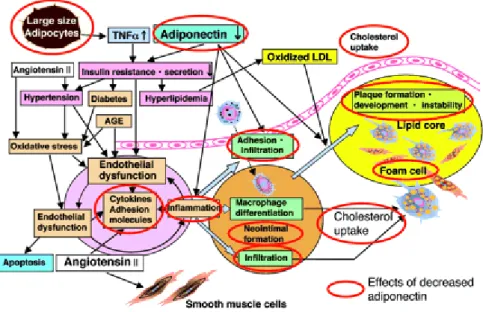
Figure 7: Effects of a decreased adiponectin level in the blood and the association with plaque formation (6).
Because of its exclusive secretion by adipocytes and its pleiotropic positive functions in reducing the diseases associated with obesity, it is a suitable biomarker for the risk of metabolic syndrome. Scherer et al. showed that, in mice, adiponectin is capable of boosting the sensitization of the liver to circulating insulin. The decrease of adiponectin levels in obese subjects leads to inflammation and insulin resistance and thus to hyperlipidemia.
Inflammation directly leads to the formation of foam cells and, due to hyperlipidemia, increased levels of oxidized LDL support foam cell formation [57]. Increased oxidative stress leads to endothelial dysfunction. The result is plaque formation and an increased risk for CAD (cardiac artery disease) (Figure 7).
Figure 8: Adiponectin increases fatty acid oxidation [58].
Figure 8 depicts the role of adiponectin in hyperlipidemia. It describes the effects of adiponectin on signaling pathways by mediating ß-oxidation and decreasing triglyceride concentration.
1.5.3 Omentin
Omentin is especially expressed by visceral adipose tissue [59]. The plasma concentration of omentin negatively correlates with glucose tolerance [59] and positively correlates with endothelium-dependent vasodilation (Figure 9). Plasma omentin levels negatively correlate with carotid intima-media thickness, which is a marker of early atherosclerosis [59]. “Low levels of circulating omentin are also associated with the prevalence of coronary artery disease These data suggest that omentin may represent a biomarker for not only metabolic disorders, but also cardiovascular diseases” [59].
Figure 9: Omentin, leptin and adiponectin have modulating effects on the vessel wall (VSMC = vascular smooth muscle cells). Omentin/intelectin is shown as being secreted by the endothelial cells of the blood vessels of omental but not subcutaneous fat (7).
1.6 Lipids
Lipids are classified into classes such as triglycerides (triacylglycerols), fatty acids, phospholipids, plasmalogens, sphingolipids, and sterols. Each lipid class contains numerous
lipid species that differ in various aspects e.g. defined by fatty acid chain length and desaturation. In any eukaryotic cell, more than 1000 different lipid species exist [60]. When challenges in the environment destroy homeostasis, the maintenance of the physiological functions is usually restored. But a change of 10% of lipid content can already have significant consequences [61]. Due to the concentration of stressors, the response to the environment can be inefficient. This phenomenon is called “allostatic load” [61]. An example for an allostatic load would be an ablation of SREBP1 (sterol regulating binding protein), which preferentially regulates the FA metabolism. In this case, SREBP2 would be automatically up-regulated, which might lead to an inappropriate cholesterol accumulation [61]. Another example is elevated insulin secretion in persons with insulin resistance. The allostatic regulations might compensate certain failures, but the symptoms of damage and allostatic overload can progressively lead to symptoms. Oresic noted that these allostatic responses could be used as early biomarkers to quantify the risk for certain diseases [61].
1.6.1 Plasmalogens
Plasmalogens constitute 18% of the total phospholipid mass in humans [62]. They are synthesized in the liver and transported in the blood stream bound to proteins. The majority of PE-plasmalogens (ethanolamine plasmalogens) in the plasma are transported in HDL particles [62]. The ethanolamine plasmalogens are important in this study because of their antioxidant effects [63]. The quantity of plasmalogens in a cell reflects the quantity of peroxisomes in that cell, because peroxisomes are the location of plasmalogen synthesis. Ethanolamine plasmalogens have a half-life of 3 hours [62]. And contrary to other lipids, they revealed a high level of variation between different tested individuals, which could make them an interesting marker for peroxisome function [62]. It is known that with age, plasmalogen synthesis in humans decreases [62]. A lack of plasmalogens is associated with ER stress, the
“unfolded protein response”, which, as a last consequence, leads to apoptosis. Plasmalogens also serve as a reservoir for PUFAs and a reduced quantity of plasmalogens could be associated with a reduced quantity of ω-3 fatty acids species, which serve as anti- inflammatory messengers, and of adipogenesis-regulating fatty acids [62]. Since a decreased number of plasmalogens is associated with diseases such as diabetes and obesity, our laboratory proposed to use plasmalogen species as early stratifying biomarkers and indication for disease and therapy [62].
1.6.2 Fatty acids
The fatty acid composition in serum is an important determinant of the metabolic syndrome.
Kotronen et al. showed that there is a close connection between the quantity of saturated fatty acid in triglycerides and diabetes. His work group has already proposed some species as biomarkers [63]. They found out that serum TAG molecules containing saturated and monounsaturated fatty acids, such as TAG (16:0/16:0/18:1) and (16:0/18:1/18:0), correlated positively, whereas those containing mono- and di-unsaturated FAs such as (18:1, 18:2) correlated negatively with impaired glucose tolerance, hepatic lipogenesis and waist circumference. However, saturated TAGs only correlate positively with features of insulin resistance in VLDL, IDL and LDL, not in HDL. Free FAs only have a half-life of 12 minutes.
Saturated long-chain fatty acids can up-regulate ceramide production, whereas short-chain unsaturated fatty acids protect ß-cells from the toxicity of ceramides. Polyunsaturated fatty acids (PUFAs) can be classified in ω−3 fatty acids and ω−6 fatty acids, and in the westernized diet the predominant dietary PUFAs are ω−6 fatty acids [64].
1.6.3 Phosphatidylcholine and Lysophosphatidylcholine
Phosphatidylcholine also counts among the glycerophospholipids. Lysophosphatidylcholine (LPC) is a signaling molecule with functions in cellular proliferation and inflammation [65].
A negative correlation between BMI and LPC has been published [65]. The exposure of adipocytes to LPC in vitro has caused their improved glucose tolerance, thus LPC might be involved in glucose regulation. Reduced LPC levels in obese subjects might contribute to insulin resistance [65]. Enhanced LPC levels may be an early marker for development of type 1 diabetes [66].
1.6.4 LPA
Lysophosphatidic acid (LPA) is a phospholipid, which consists of a single fatty acyl chain, a glycerol backbone and a free phosphate group [67]. By binding to specific G-protein-coupled receptors, LPA activates multiple signal transduction pathways, including diverse processes such as wound healing, brain development, vascular remodeling and tumor progression [67].
1.6.5 Sphingomyelin and ceramides
Sphingolipids derive from the sphingosine backbone. They are components of cellular membranes, enriched in membrane microdomains (rafts) [68]. They can be found in nerves and are important for signal transduction. Those which are interesting for our study are the sphingolipids belonging to the main group, such as ceramide and sphingomyelin. Ceramide is the simplest sphingolipid, consisting of one free fatty acid (palmitate) and serine to form the sphingosine base. The intracellular elevation of ceramides is stimulated by stressors and inflammation. Ceramides inhibit cell growth, proliferation, differentiation and induce apoptosis. An equilibrium of ceramide and sphingosine-1-phosphate is crucial for the balance of death and survival [69]. It is known that sphingosine is elevated in the serum of type 2 diabetes subjects compared to healthy controls. Ceramide can contribute to insulin resistance by inhibiting GLUT4 translocation, glycogen synthesis, altering pancreatic cells and insulin- stimulated glucose uptake [69]. Risk of atherosclerosis is associated with high levels of sphingomyelin, which is overexpressed in obese subjects due to the higher levels of serine palmitoyl-transferase in the sera of obese subjects compared to lean ones.
1.7 Current biomarkers
The clinical utility of a biomarker depends on its ability to account for a significant proportion of the disease’s evaluation, its accuracy and reliability and on its ability to provide good sensitivity and specificity and a high predictive value [70]. The well-established biomarkers for the metabolic syndrome are already incorporated into the diagnostic criteria. Additional potential biomarkers for the metabolic syndrome have been identified. The predictive values for the risk of metabolic syndrome of inflammation parameters, e.g. CRP [71], or adipokines such as ghrelin [72], adiponectin [73] and leptin [74,75] have been published recently.
Elevated fasting CRP concentrations and decreased adiponectin levels as well as elevated postprandial triglycerides are not only a hallmark for the metabolic syndrome, but are also independent predictors of CVD risk [76]. In previous studies, only the basal values have been taken into account, but the dynamic has not yet been compared between a metabolic syndrome group and a control group.
1.8 Aim of the study
The aim of this study was to identify novel biomarkers for diabetes, hyperlipidemia, atherosclerosis and CVD risk which might have prognostic value. Since those diseases are
connected with the metabolic syndrome, the risk for those diseases was measured based on the risk of having metabolic syndrome. To this aim, we analyzed the differences between three groups: control (none of the criteria defining metabolic syndrome), risk (two of the risk factors) and metabolic syndrome as defined in Table 2. The aim was to test the hypothesis that metabolic syndrome subjects have an acutely and chronically altered lipid metabolism compared to the control group, suggesting an altered postprandial lipidomic response in diabesity. The examination was carried out by observing the effects of an oral fat tolerance test on those body compartments which are associated with obesity.
For the oral fat tolerance test, the subjects were given a drink consisting of 66% fat and their plasma samples were compared to the fasting plasma sample 2, 4, 6 and 8 hours after the drink. Adipokines, inflammation markers and signaling proteins as well as lipids and lipidomics of the adipose tissue, blood compartments, kidney and bone were measured on the assumption that persons with metabolic syndrome react differently to high fat load than healthy subjects, because their metabolism is acutely and chronically altered. For this investigation, the dynamic of blood components was compared between different groups (named control, risk and metabolic syndrome) according to their diet and risk factors associated with obesity. With this work, we hope to contribute to the definition of a new multimarker panel – with greater sensitivity and specificity than the current ones – in order to screen and monitor diabesity patients with the metabolic syndrome, assess their courses of disease and predict the outcome of the disease.
2 Materials and Methods 2.1 Materials
Consumables Manufacturer
Inlet liners Carbo Frit Retek
Silica HPTLC plate, phospholipid standards Avanti Polar Lipids Test tubes for diluting samples Eppendorf
Reagents Manufacturer
Acetylchloride Merck
Ammonium acetate and acetyl chloride Fluka
Cholesterol (95% purity) Sigma
Cholesteryl ester standards (98% purity) Cambridge Isotope Laboratories Andover
2-13C acetate Cambridge-Isotope Lab
EDTA EDTA
Ethanol Merck
FA standard D3C-16:0 Sigma
FAME standard Lordan
HCl 1N Sigma
n-Hexane Merck
Medical Isotopes (99%purity) Pelha
Methanol Merck
NaOH 10N Sigma
PHMB Sigma
Potassium phosphate buffer 0,1M pH 7,4 Sigma
Instrumentation Manufacturer
Agilent 110 binary pump Agilent
CAMAG TLC scanner Camag
HTS PAL auto sampler CTC
GCMS-QP 2010 detector+autosampler+PTV (programmed T vaporizer) Shimadzu
Graduated cylinder for dilution buffer Braun
Triple quadruple mass spectrometer with electrospray ionization source Waters
Vortex Mixer Sigma
Orbital microplate Shaker Sigma
2.2 Selection of subjects and stratification
A small presentation of our study was prepared with contact dates on business cards and we placed ourselves in the city once, another time at the University Hospital Regensburg and at Regensburg University. The project was explained to a random sample of people who passed and who were asked if they were interested in taking part as volunteers. Then we checked whether they met the inclusion criteria. As an incentive for participating, we offered the volunteers their laboratory parameters with interpretation and a treatment recommendation if necessary. We handed out our cards and asked them to call us for an appointment.
Additionally, the medical doctor in cooperation with the department of cardiology agreed to put us in contact with patients meeting our inclusion criteria. We recruited 70 healthy male volunteers from town, University Hospital and University. 3 of them decided to abort the experiment prematurely without providing reasons. The 67 healthy volunteers were stratified in three groups according to IDF criteria (Table 2): the metabolic syndrome group contained subjects which fulfilled at least three of the criteria, the risk group consisted of subjects which fulfilled at least one but less than three criteria, and the control group contained subjects which did not show any of the risk factors from the IDF criteria. Inclusion criteria were ages between 35 and 70 and male gender. The IDF definition of the metabolic syndrome is that a subject is afflicted by the metabolic syndrome if abdominal obesity and two or more of these criteria are fulfilled (Table 2).
Parameter Reference range
Elevated triglycerides ≥150 mg/dl or drug treatment
Reduced HDL cholesterol <40 mg/dl for males or drug treatment
Elevated blood pressure Systolic ≥ 130 mmHg and/or diastolic ≥ 85 mmHg or drug treatment
Elevated fasting glucose ≥ 100 mg/dl or drug treatment Elevated waist circumference men ≥ 94 cm
Table 2: IDF criteria for metabolic syndrome [77] To fit into our metabolic syndrome group, the subject had to fulfill three (obesity+2 of the criteria) or more of the five criteria.
Immunoassays Material Manufacturer
ApoB-48 Serum Shibayagi
FGF-23 Li-Hep-Plasma Immutopics
Leptin Serum Bio Vendor
Ghrelin Li.-Hep. SPI bio
Omentin Li-Hep-Plasma Bio Vendor
Su-Par Li-Hep-Plasma ViroGates
Subjects were excluded if they had a history of malignant disease or disorders in their gastrointestinal tract.
2.3 Design
The approval of the hospital ethics committee (no. 08/119) was obtained. Each patient who participated in our study especially had to be informed of the potential side effects of the drink (nausea immediately or diarrhea 1-2 hours after drinking), sign an informed consent (Annex 1) and complete a questionnaire (7.2) with questions on medical history, physical activity, eating habits, medication, allergies and family history. The oral fat tolerance test is similar to the oral glucose tolerance test (OGTT).
Figure 10: Procedure. Blood samples were taken following strict 12-hour fasting at time points 0, 2, 4, 6 and 8 hours after drinking the high caloric shake. The samples were analyzed for their lipidomic profile, as well as for cellular parameters and serum cytokines.
The oral fat tolerance test (OFTT) was carried out as suggested by Hanefeld group (Dresden) with a minor modification of the variant by Henkel E. et al. (2005) [78]. As described in Figure 10 blood samples were taken from the antebrachial vein, following a strict 12-hour fasting period at time points 0, 2, 4, 6 and 8 hours after drinking a high caloric shake. The shake consisted of 250 ml cream with 100 ml fruit juice in combination with 60g sugar. Sugar was added to adjust the combined fat-glucose content. The fruit juice was added to the high- fat cream to neutralize the metallic taste of the pure drink and to make the drink appetizing. In total, the drink contained 3% protein, 66% fat and 32% carbohydrate, adding up to a total energy of 1016 kcal (Figure 11).
Oral fat load0h
2h 4h 6h 8h
Blood
Serum/Plasma EDTA-blood
Basic clinical hematology Clinical chemistry
TG/HDL/LDL Apolipoproteins
Lipid extraction
Quantitative lipid species profiling
Cholesterol/cholesterylester TG
Kcal Protein [g] Fat [g] Carbohydrate [g] PUFA [g] SUFA [g] Total FA [g]
250ml/286g milk cream
720 6.2 75 8 2.8 22.6 45.5
100ml/100g fruit juice
53 0.3 0 12 0.2 0 0.1
60g white sugar
243 0 0 60 0 0 0
Total content 1016 6.5 (4.02%) 3% kcal
75 (46%) 66% kcal
80 (49.5%) 32% kcal
3 22.6 45.6
Figure 11: Composition of the oral fat drink according to manufacturers’ declaration.
We first measured the patients’ blood pressure, waist and hip circumference. Waist and hip circumferences were measured in a standing position between the lower costal margin and the iliac crest in the narrowest section. Hip circumferences were measured at the level of the greater trochanter. Blood pressure was measured five minutes after relaxing in an either sitting or lying position. Immediately before the drink was handed out, we inserted an antebrachial cannula for blood sampling or, where this was not possible; we drew blood with a butterfly needle. After the first withdrawal of fasting blood, the blood was immediately transported to the laboratory, and the drink then had to be consumed within a maximum of ten minutes. During the experiment, the participants were advised to stay in the hospital building and were only allowed to drink water. We took a sample of every drink; ten samples were randomized to control the fatty acid composition of the drink. Six tubes were filled with every blood collection: 4x EDTA, 1x lithium heparin, 1x serum. The samples were analyzed for their lipidomic profile, as well as for cellular parameters and serum cytokines. Special emphasis was put onto adipokines which might be regulated differently in persons with metabolic syndrome compared to the control group. Samples from each drink were aliquoted and stored at -80°C for further analysis.
2.4 Laboratory parameters
2.4.1 Lipid mass spectrometryMass spectrometry was developed by J.J. Thomson in 1910 [79]. It is an analytical laboratory technique to separate the components of a sample according to their mass [79]. Since the 1950s, gas chromatography has been coupled with mass spectrometry [80]. In this case the samples are vaporized into gas and then ionized. The quantity of ions at different deflections
is plotted as a spectrum of different masses [79]. Figure 12 shows our modern instrument for quadruple mass spectrometry with the CTC PAL HTS autosampler.
Figure 12: The laboratory instrument, an instrument for mass spectrometry with autosampler and Agilent pumps, API 4000 QTRAP. Samples were vaporized and ionized and plotted as a spectrum of different masses. Source: Gerhard Liebisch, University of Regensburg.
.
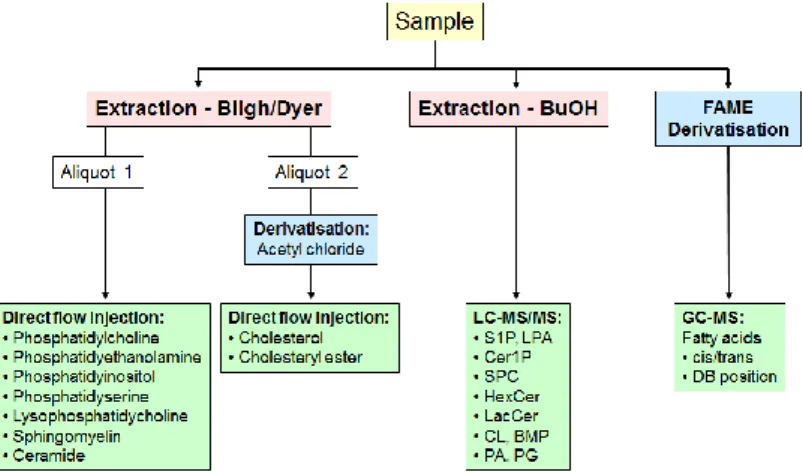
Figure 13 shows a short overview of the workflow of analyzing the different lipid classes.
Figure 13: Strategies for lipid analysis. On the left, the separation and identification of the phospholipids that were prepared by the method of Bligh and Dyer and then separated by electroflow separation is depicted, on the right the identification and quantification of the fatty acids is shown. Here, the first step is preparation, the second GC-MS. Source: Gerhard Liebisch, University of Regensburg.
Parameter Preparation procedure Reference value
Ceramides Bligh and Dyer
Fatty acids FAME 0.3-1 mmol/l
LPA 0.1 µM
LPC < 150 µM
Phosphatidylcholine Electrospray ionization tandem mass spectrometry with isotope correction algorithm
Plasmalogens Bligh and Dyer
SPM Electrospray ionization tandem mass spectrometry with isotope correction algorithm
Table 3: Parameter list of mass spectrometrically tested substances and reference values. Values found in [81], [82], [83].
Fatty acid analysis
Fatty acids (total hydrolysis and non-esterified fatty acids [NEFA]) were measured as methyl esters by GC/MS after derivatization according to methods published by Ecker, Liebisch et al.
[84]. Fatty acid methyl ester (FAMEs) were prepared by transesterification in one step reaction with acetyl chloride and methanol according to the protocol of Lepage and Roy [85].
Cyanopropyl polysilphenyl-siloxane columns are preferred to wax columns as they have a high temperature stability [85]. The inert gas helium was used as mobile phase and carrier.
The FAMEs were transported by the helium, which interacted with the solid phase. Each compound had its own retention time. The comparison of retention times with the standard analytics made it possible to identify the peaks. And with mass spectrometry as a detector, the contents of the samples could be determined. Sensitivity is gained by using a programmed temperature vaporizer, which can even be used for samples with low concentrations [85].
Preparation: Fatty acid methyl ester (FAMEs): 10µl plasma were methylated in PTFE screw capped pyrex tubes [85]. 1µl of C13:0 for quality control and 1µl C21:0 iso as internal standard were added in 50 µl Methanol [85]. Derivatization was performed by shaking 2ml of methanolic acetylchloride (10%) and 50µl n-hexane in a 95°C water bath for 1h [85]. At room temperature, 5ml of a 6-percent potassium carbonate solution were added. 100µl of the top- layer were transferred into a 500µl autosampler vial [85]. Gas chromatography coupled to mass spectrometry: An aliquot of 1µl FAMEs was separated by BPX70 column coated with 70% cyanopropyl polysilphenyl-siloxane using a GC 2010 coupled to a GSMS-QP2010 detector. PTV run in split mode 1:20 for 3s switched for 1.3min to the splitless mode and a split ratio of 1:100 until the end of the run [85]. The liner was packed with CarboFritTM [85].
The temperature was 50°C for 0.75min, then the temperature was increased by 40°C/min to 155°C and afterwards more slowly by 6 °C/min up to 210° and held there for 2min. Helium was used as carrier gas with a constant linear velocity of 50cm/s [85]. The detector temperature was kept at 250 °C and FAME identification was performed in scan mode.
Quantification was performed by selected ion monitoring (SIM) of the most intense fragments [85].
Cholesteryl ester analysis by ESI-MS/MS
This method is based on the creation of an aerosol from the analytic by the use of solvents. At a high voltage and under high pressure using argon gas, small charged droplets of the analytic were produced. After the solvent evaporates, the droplets decrease in size and disperse. The
ions were collected into the vacuum of the mass spectrometer and heated in order to leave room for the next analytic aerosol. Lipid extraction was performed in the presence of not naturally occurring lipid species as internal standards and the chloroform phase was dried in a vacuum centrifuge and dissolved in 10 mM ammonium acetate in methanol/chloroform (3:1 vol/vol). Samples were analyzed by ESI-MS/MS in positive ion mode after direct flow injection using the analytical setup and data analysis algorithms described previously by Liebisch et al. The triple quadrupole MS or tandem mass spectrometry allows to first determine the mass of the ion, then bring ions together with a gas and determine the mass again. Preparation: For lipid extraction, the method of Bligh and Dyer was used [86]. 100μl of a chloroform solution containing 100ng/μl of each cholesteryl heptadecanoate (CE 17:0), cholesteryl behenate (CE 22:0) and [25,26,26,26,27,27,27-D7]-cholesterol were placed into a glass centrifuge tube and evaporated [87]. For absolute quantification, a defined quantity of free cholesterol as well as different naturally occurring cholesteryl ester species were added [87]. The separated chloroform phase was dried and derivatized by adding 200μl of acetyl chloride/chloroform = 1/5 (v/v) for 60min at room temperature and the derivatization reagents were removed by vacuum centrifugation [87] It has to be considered that acetyl chloride decomposes to hydrochloric acid, which may corrode the vacuum centrifuge [87]. The residues were dissolved in 10 mM ammonium acetate in methanol/chloroform = 3/1 (v/v), resulting in a 200-fold dilution corresponding to the initial plasma volume, and 20μl of this solution were injected and data were acquired for 1.3min [87]. Mass spectrometry: Samples were quantified by direct flow injection analysis in an HTS PAL autosampler. A flow gradient was performed with a flow of 55 μl/min for 0.1min followed by 30μl/min for 1.0min and an increase to 250μl/min for 0.2 min [87]. The triple quadrupole mass spectrometer with positive ion source was used in a mode with capillary voltage 3.5kV, cone voltage 50V, collision energy 13eV with a collision gas pressure of 1.0 × 10⁻³ Torr argon, and quantification was achieved by a combination of selected reaction monitoring (SRM) for FC and precursor ion scanning of m/z 369.3 in positive ion mode specific to CE. SRM analysis for FC quantification includes two transitions: m/z 446.4 > 369.3 (CE 2:0) and m/z 453.4 > 376.3 (D7-CE 2:0) [87]. Labeled 13C3-FC and 13C3-CE species were monitored by a fragment ion of m/z 372.3 [87]. Lipid extracts were analyzed by thin layer chromatography as previously described by K. Simons et al. [87]. Samples were separated using silica gel HPTLC plates and a solvent mixture of n-hexane/n-heptane/diethyl ether/acetic acid (63/18.5/18.5/1, v/v). Plates were stained by immersion in a manganese/sulfuric acid reagent, followed by heating.