Comprehension: Preliminary Results for Experienced and Inexperienced Individuals
Michael Zimoch1, R¨udiger Pryss1, Thomas Probst1, Winfried Schlee2, and Manfred Reichert1
1 Institute of Databases and Information Systems, Ulm University, Germany
2 Department of Psychiatry and Psychotherapy, Regensburg University, Germany {michael.zimoch, ruediger.pryss, thomas.probst, manfred.reichert}@uni-ulm.de,
winfried.schlee@googlemail.com
Abstract. Process modeling constitutes a fundamental task in the con- text of process-aware information systems. Besides process model cre- ation, the reading and understanding of process models is of utmost im- portance. To better understand the latter, we have developed a concep- tual framework focusing on the comprehension of business process mod- els. By adopting concepts from cognitive neuroscience and psychology, the paper presents initial results from a series of eye tracking experiments on process model comprehension. The results indicate that experiences with process modeling have an influence on overall model comprehen- sion. In turn, with increasing process model complexity, individuals with either no or advanced expertise in process modeling do not significantly differ with respect to process model comprehension. The results further indicate that both groups face similar challenges in reading and compre- hending process models. The conceptual framework takes these results into account and provides the basis for the further experiments.
Keywords: Business Process Model Comprehension, Eye Tracking, Cognition
1 Introduction
Process models document the tasks, decisions, and actors of business processes following a specific goal. In practice, the latter is specified in terms of textual or graphical artifacts. Regarding graphical process models, a variety of visual shapes like oblongs, rhombuses, and circles, together with other symbols, are used. Besides syntactical rules, process models express pertinent aspects of the respective business process. In general, the use of graphical process representa- tions yields advantages compared to textual ones [1].
Regarding graphical process modeling, there exists a plethora of different modeling languages including Flow Chart [2], BPMN [3], EPC [4], or Gantt Chart [5]. Each modeling language, in turn, provides different graphical elements for documenting the business processes. Research on process model comprehen- sion has shown that appropriate symbols and visual elements foster the reading
as well as the comprehension of process models [6]. It is further known that individuals perceive graphical representations differently, resulting in modeling preferences based on a variety of personal factors [7]. Despite existing research in this field, there exist open issues on how these factors might influence pro- cess model comprehension.Cognitive neuroscience andpsychology, in turn, can provide valuable insights into process model comprehension. We are therefore developing aconceptual framework that incorporates methods and theories from these two disciplines, with a particular focus on the
– improvement of statistical and empirical evaluations existing in this context, – identification of rules on how to foster process model comprehension, – categorization (e.g., level of complexity or construct-related similarities) of
process models based on experimental data, and
– provision of directives towards creating better readable process models.
This paper discusses the results of a pilot eye tracking experiment that was conducted using the conceptual framework. The experiment evaluates process model comprehension based on measured eye movements of the subjects. In detail, the latter were tracked while comprehending different process models. By applying the conceptual framework, the experiment revealed preliminary but promising results with respect to process model comprehension.
The remainder of this paper is organized as follows: Section 2 presents theo- retical backgrounds and introduces the proposed conceptual framework. Section 3 discusses the experimental setting. Section 4 deals with the preparation and execution of the experiment. Obtained results from the experiment are presented and analyzed in Section 5. Finally, Section 6 discusses related work and Section 7 summarizes the paper.
2 Theoretical Backgrounds
This section introduces fundamentals required for understanding our work. Sec- tion 2.1 discusses relevant work on process modeling, whereas Section 2.2 deals with process modeling from the viewpoint of cognitive neuroscience and psychol- ogy. Finally, Section 2.3 presents the conceptual framework in detail.
2.1 Process Modeling
The documentation of business processes using a graphical representation has its origins back in the 19th century. Since the creation of Gantt Charts in 1899, many graphical process modeling languages (e.g., Flow Charts, Event-Driven Process Chains (EPC)) emerged as alternatives for a graphical documentation.
With its visual elements representing tasks, events, control flow, and actors, process modeling has become increasingly important [8]. In this context, high process model quality is crucial to increase the comprehensibility of business processes [9].
Note that the concrete scenario, in which business processes shall be used, is relevant with respect to the appropriation of a particular modeling language.
Which process modeling language fits best in a particular scenario, however, constitutes a challenging task.
2.2 Cognitive Neuroscience and Psychology
Cognitive neuroscience is dealing with biological as well as underlying processes (e.g., neural response to a stimulus). The rapid progression in this field let to new findings on cognitive processes and neural mechanisms (e.g., perception) [10]. Using specific measurement methods, along with useful technology from the research field of cognitive neuroscience (e.g., electrodermal activity), our understanding on how sensory information is processed by the human brain has significantly improved. Cognitive neuroscience overlaps with the field of cognitive psychology, with a stronger emphasis on the neural function of the brain. In turn, cognitive psychology is the scientific investigation of mental processes concerned with the observations in human functions such as attention, memory, information processes, and thinking [11]. Compared to cognitive neuroscience, emphasis is put on the use of methodological theories (e.g.,Cognitive Load Theory (CLT)).
In the context of business process modeling, this offers promising opportunities providing, for example, insights into the cognitive processes of individuals when reading and comprehending process models.
2.3 Conceptual Framework
The emphasis of the conceptual framework we developed is put on process mod- eling and on the influence personal factors have on process model comprehension.
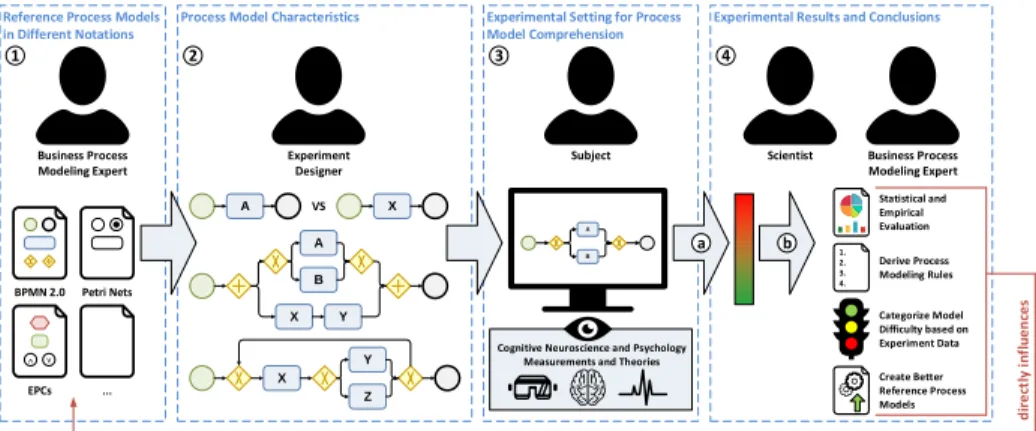
Fig. 1 illustrates the conceptual framework and its components:
Experimental Results and Conclusions Experimental Setting for Process
Model Comprehension Process Model Characteristics
Subject
A B
Categorize Model Difficulty based on Experiment Data
A
B
Create Better Reference Process Models
directly influences
2 3 4
Cognitive Neuroscience and Psychology Measurements and Theories
Derive Process Modeling Rules 1.
2.
3.
4.
Business Process Modeling Expert Scientist
a b
Statistical and Empirical Evaluation Reference Process Models
in Different Notations 1
Experiment Designer Business Process
Modeling Expert
...
BPMN 2.0 Petri Nets
EPCs
^ v
X Y Z
A VS X
X Y
Fig. 1: Conceptual Framework for Process Model Comprehension
(1) Reference process models in different notations.With the increas- ing adoption ofprocess-aware information systems (PAIS), more and more enter- prise repositories comprise large collections of business process models created by process modeling experts [12]. For graphically documenting business processes, there exists a variety of process modeling languages (e.g.,BPMN,EPC). Often, the chosen language for representing process models lacks consistency and, there- fore, the graphical representation varies significantly. In turn, the heterogeneous process model representations might affect process model comprehensibility [13].
In particular, non-experts are frequently confronted with challenges regarding how to properly read process models.
(2) Process model characteristics.There are factors related to process modeling that influence an individual’s capability to comprehend process models.
For example, the chosen graphical representation, level of complexity, or activ- ity labeling are such factors that must be carefully considered when designing experiments.
(3) Experimental setting for process model comprehension.Individ- uals perceive graphical representations differently, depending on personal factors.
For example, expertise in process modeling is an important factor in this con- text. What is easy to learn for a particular individual, might be more difficult for another one. Cognitive neuroscience and cognitive psychology are promising fields that might provide new means for research and observations. Throughout a series of experiments, which make use of concepts from cognitive neuroscience and psychology (e.g.,eye tracking, event-related potential), the identification of stumbling blocks and obstacles will be addressed by the conceptual framework.
(4) Experimental results and conclusions.The aggregated findings ob- tained from conducted experiments are analyzed by scientists using different methods (e.g.,clustering,similarity matching). The results are used to rate and classify individuals with respect to process model comprehension a(cf. Fig. 1).
This classification reflects the perceived difficulty of an individual regarding pro- cess model comprehension and the importance of personal factors in this context.
Taking the results into account, further steps and activities can be derived. For example, process modeling languages and visual constructs may be categorized into groups of different levels of complexity b(cf. Fig. 1). Finally, all outcomes serve as additional indicators on how to create better process models.
3 Experimental Setting
This section introduces the definition and planning of the experiment for mea- suring process model comprehension. Section 3.1 illustrates the context of the experiment and defines its goals. Section 3.2 introduces the hypotheses consid- ered for testing, whereas Section 3.3 presents the experimental setup. Finally, Section 3.4 discusses the design of the experiment.
3.1 Context Selection and Goal Definition
A potentially relevant factor for process model comprehension is the expertise in process modeling. This leads to the following research question:
Research Question
Does expertise in the domain of process modeling has a positive effect on reading and comprehending business process models?
To address this research question, the conceptual framework is used for an eye tracking experiment. Eye tracking constitutes a technique measuring eye movements in response to a visual stimulus (e.g., picture) [14]. Moreover, it is a cost-effective and unobtrusive method to gain deeper insights into human cog- nitive processes. Most common types of evaluated eye movements arefixations, saccades, andgaze paths [15]. Fixations constitute eye movements of very low ve- locity at a specific point in the stimulus, while saccades constitute quick changes of eye movement. Note that during saccadic eye movements, no visual informa- tion is perceived. A gaze path, in turn, represents the path (i.e., chronological order of fixations and saccades) the eyes take while analyzing a stimulus. Based on a controlled eye tracking experiment, participating subjects needed to com- prehend three process models and were asked to answer a set of comprehension questions related to these models, while their eye movements were recorded.
3.2 Hypothesis Formulation
Based on the research question, five hypotheses were derived that shall investi- gate whether intermediates (i.e., individuals with expertise in the field of process modeling) are more effective than novices (i.e., individuals with no expertise in the field of process modeling) in respect to process model comprehension:
H0,1: Intermediates need not less duration time for process model comprehension compared to novices.
H1,1: Intermediates need significantly less duration time for process model comprehension com- pared to novices.
H0,2: Intermediates do not achieve a better score for answering the questions compared to novices.
H1,2: Intermediates achieve a significantly better score for answering the questions compared to novices.
H0,3: Intermediates do not have a better response time for answering the questions compared to novices.
H1,3: Intermediates have a significantly better response time for answering the questions compared to novices.
H0,4: Intermediates do not have less fixations in process model comprehension compared to novices.
H1,4: Intermediates have significantly less fixations in process model comprehension compared to novices.
H0,5: Intermediates do not have a shorter gaze path in process model comprehension compared to novices.
H1,5: Intermediates have a significantly shorter gaze path in process model comprehension com- pared to novices.
3.3 Experimental Setup
This section describes subjects and objects as well as independent and dependent variables of the experiment.
Subjects.There were no prerequisites for participating in the experiment.
For the specification of groups (i.e., novices and intermediates), a median split (i.e., based on time spent on process modeling) was performed after experimental execution as done in other scientific fields (cf. Section 4.3).
Objects. In the experiment, subjects needed to comprehend three process models reflecting different levels of difficulty, i.e., level of complexity. The cre- ated process models were expressed in terms of theBusiness Process Model and Notation (BPMN) and were divided up into three levels of difficulty (i.e., easy, medium, and hard) [3]. To be more precise, the easy process model contains only basic modeling elements (e.g., activities) of BPMN. With rising level of difficulty, the total number of elements was increased and new BPMN elements, previously not contained in the process model, were added. Throughout process model com- prehension, the eye movements of the participating subjects were tracked and recorded. After analyzing a process model, the subjects had to answer fourtrue- or-false comprehension questions. The questions solely referred to the scenario semantics of the process models and were created to evaluate whether or not the subjects interpreted the models correctly.1
Independent variables.In the experiment, two independent variables were considered: the 1 level of difficulty for each considered process model and the 2 expertise level in process modeling from participating subjects.
Dependent variables.For each level of difficulty, the considered dependent variables are the 1duration required for comprehending a process model, the 2 achieved score regarding the comprehension questions, and the 3 needed response time for answering the questions. In the context of eye tracking, we recorded the 4number of fixationsand the 5length of the gaze path taken in the process model. Fig. 2 summarizes the research model of the experiment.
3.4 Experimental Design
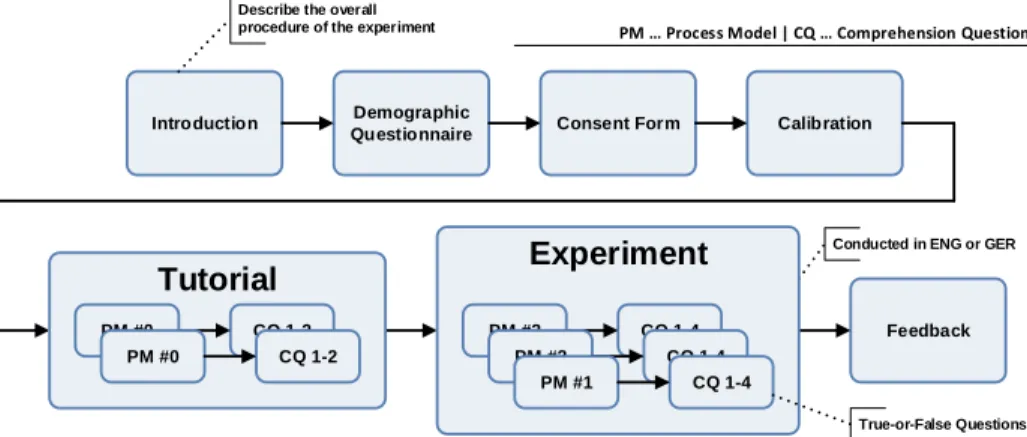
For the experimental setting, we apply the guidelines described in [16]. The procedure used for the experiment is as follows (cf. Fig. 3): First, participating subjects received an introduction and had to sign a consent form. Then, demo- graphic data was collected. Following this, the eye tracker was calibrated and subjects completed a tutorial. To eliminate the linguistic barrier and ambigui- ties, the experiment could be done in either English or German. After completing these mandatory steps, subjects were asked to read and comprehend the pro- vided process models. Starting with the process model reflecting an easy level of difficulty, followed by the medium, and, finally, the hard one had to be ac- complished. After each process model had been analyzed by the subjects, they
1 Material downloadable from:
www.dropbox.com/sh/peecwj4dyqwz9ew/AAAi4tewWOR7jJmPbz6gPsHpa?dl=0
Legend:
F: Theoretical Factor O: Operationalization of Factor Process Model Related Factors
F: Process Model Complexity O: Level of Difficulty
Personal Related Factors
F: Expertise in Process Modeling O: Hours Spent with Process Modeling
Perception of Process Model F: Process Model Comprehension O: Comprehension Duration
Answering Score Response Time Fixation Number Gaze Path Length
Fig. 2: Research Model
had to answer four questions related to the previously evaluated process model.
The process models were not visible while answering their related questions. The comprehension questions could be answered with ’true’, ’false’, or ’uncertain’.
We are aware of the fact that the pure comprehension of process models without any guidance (e.g., purpose) is uncommon. However, for the first experiment, we wanted to deliberately disclose the approaches for the pure comprehension of process models. Finally, subjects could provide feedback (i.e., textual or oral).
Introduction Demographic Consent Form Calibration Questionnaire
Feedback PM Process Model | CQ Comprehension Question
True-or-False Questions Conducted in ENG or GER Describe the overall
procedure of the experiment
Experiment
PM #3 CQ 1-4
PM #2 CQ 1-4
PM #1 CQ 1-4
Tutorial
PM #0 CQ 1-2
PM #0 CQ 1-2
Fig. 3: Experimental Design
Instrumentation and data collection procedure.For eye tracking, we used the SMI iView X Hi-Speed system2, which allows for accurate orbital eye tracking even over a longer time of recording. The tracking appliance was placed
2 http://www.smivision.com/en/gaze-and-eye-tracking-systems/products/
iview-x-hi-speed.html
in front of a monitor that provides the process models to subjects. Eye move- ments were tracked at a sampling rate of 240 Hz. For answering the comprehen- sion questions, subjects used a keyboard with three predefined keys providing answering options. Eye tracking data collected during the experiment was ana- lyzed, visualized, and exported with SMI BeGaze software [17]. In turn, demo- graphic data and qualitative feedback was gathered based on questionnaires.
4 Experimental Operation
Based on the provided experimental setting, Section 4.1 summarizes the exper- iment preparation. The execution of the experiment is described in Section 4.2, whereas Section 4.3 deals with the validation of the obtained experimental data.
4.1 Experimental Preparation
In order to compose a group with high heterogeneity, persons with manifold backgrounds (i.e., students, academics, and professionals) were invited to join the experiment. In particular, expertise in process modeling was not a prerequisite for joining the experiment. Moreover, subjects were not informed about the aspects we want to investigate. However, they were notified that the experiment takes place in the context of process model comprehension. For all subjects, anonymity was guaranteed. Before the experiment, three pilot studies with 12 subjects were performed. These studies were used to eliminate ambiguities and misunderstandings as well as to improve respective process models and related comprehension questions. Thereby, experts and novices in the field of process modeling, who did not participate in the experiment, were asked to rank and categorize used process models with respect to their level of difficulty.
4.2 Experimental Execution
The experiment was executed in a lab at Ulm University. Altogether, 36 sub- jects participated. Each experiment session lasted about 15 minutes and was operated as follows: 1The procedure of the experiment was explained, 2sub- jects signed a consent form, and 3a questionnaire, capturing different personal factors (i.e., work status and expertise in process modeling), was handed out.
Then, 4subjects were motioned to the front of the eye tracker and the appliance was individually calibrated. Following this, 5a brief tutorial was presented to the subjects in order to familiarize them with the functionality of the eye tracker.
After completing the tutorial and before starting the actual experiment, 6sub- jects got the additional instruction that they should perform the experiment as fast as possible but, at the same time, as careful as possible. Following Section 3.3, 7 subjects needed to evaluate three BPMN process models with different levels of difficulty (i.e., easy, medium, and hard). After subjects finished with the reading of a process model, they were asked to answer four questions related to the model. These questions could be answered with ’true’, ’false’ or ’uncertain’.
4.3 Data Validation
In total, data from 36 subjects were collected. 20 subjects were students, 12 were academics, and 4 were professionals. Furthermore, 19 were computer scientist, 4 were economist, 4 were psychologists, 4 were social workers, and 5 provided no precise statements. Moreover, 13 of them were female and 23 were male. Prior to the experiment, the median of the total hours spent by the subjects on process modeling was 20.5 hours. Based on their expertise in process modeling, we cate- gorized subjects into two groups, i.e., novices and intermediates. After a median split, subjects who have spent less than 20.5 hours on process modeling were characterized as novices. All other subjects were characterized as intermediates.
In the experiment, the group of novices then consisted of 15 subjects, whereas 21 subjects were in the group of intermediates. Moreover, results related to novices are of particular interest as some of them (i.e., 5) have never been facing BPMN and, hence, it is particularly interesting how they perform in the experiment. For evaluating the comprehension questions, all data sets were used. Regarding eye tracking data, six data sets were excluded due to invalidity, i.e., eye movements were not captured properly due to incorrect calibrations. In the end, eye track- ing data from 30 subjects was used for the subsequent evaluation and analysis.
Considering the excluded subjects, the group of novices composed 14 subjects and the one of intermediates consisted of 16 subjects.
5 Data Analysis and Interpretation
Section 5.1 presents descriptive statistics of the data gathered during the exper- iment and Section 5.2 tests the hypotheses. Factors threatening the validity of the results are discussed in Section 5.3. Finally, Section 5.4 discusses the results of the conducted experiment along the conceptual framework.
5.1 Empirical Evaluation and Descriptive Statistics
Table 1 presents mean and standard deviation (i.e., STD) for novices and inter- mediates. It shows the time needed (in ms) to comprehend the respective process models (i.e., process model comprehension duration) and the achieved answering scores. For analyzing the answers provided to the respective questions, a specific value was assigned to each option, i.e., ’true’ = 1, ’false’ = -1, and ’uncertain’ = 0. The response time for answering the questions (in ms), total fixation number, and total gaze path length (in px) are shown in Table 1 (i.e., theoretical factor and operationalization of factor).3
Regarding the easy process model, results indicate that intermediates tend to be more effective in terms of process model comprehension compared to novices.
Comprehension duration is shorter and the answers given to the questions are more precise. Furthermore, intermediates needed less fixations and the gaze path
3 Sample images downloadable from:
www.dropbox.com/sh/peecwj4dyqwz9ew/AAAi4tewWOR7jJmPbz6gPsHpa?dl=0
through the process model reflects a smaller distance, i.e., fewer eye movements through the respective process model.
For the process model with a medium level of difficulty, the experiment re- vealed results similar to the above ones. Overall, the score achieved for the given answers is decreasing; however, the answering score of novices is surpassing the one of intermediates.
For the process model with the highest level of difficulty, novices perform slightly better and faster regarding their answering score. In general, no signifi- cant differences could be observed.
Theoretical Factor
Operation.
of Factor
Both Novices Intermediates
Mean STD. Mean STD. Mean STD.
Difficulty Easy
Comprehension
Duration 34968 14728 39334 17744 31850 11606
Score 0.40 0.86 0.3 0.91 0.5 0.81
Resp. Time 6448 4352 6252 4432 6644 4298
Eye Tracking Fixations 112 38 123 43 98 25
Gaze Path 19901 7388 21682 8091 17570 5852
Difficulty Medium
Comprehension
Duration 54106 21957 63685 25062 47264 16912
Score 0.32 0.91 0.33 0.93 0.3 0.90
Resp. Time 8029 4083 7685 3330 8373 4647
Eye Tracking Fixations 191 59 207 66 171 43
Gaze Path 35649 11997 38284 12083 32203 11423
Difficulty Hard
Comprehension
Duration 69740 29027 75406 34803 65693 24193 Score -0.24 0.88 -0.17 0.92 -0.32 0.85 Resp. Time 9388 5126 8842 4675 9934 5450
Eye Tracking Fixations 230 81 231 97 228 56
Gaze Path 41438 15140 41904 17979 40829 11058 Table 1: Obtained Experimental Results
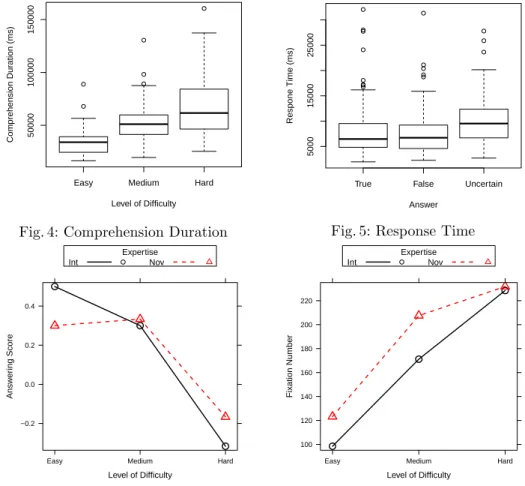
Figs. 4 - 7 show selected results of the experiment. Fig. 4 indicates that with rising level of difficulty the time needed for process model comprehension increases as well. While the response time for giving a correct or wrong answer is roughly the same, the frequency for giving ’uncertain’ answers increases over time (cf. Fig. 5). Fig. 6 illustrates that the achieved answering scores are decreasing with rising level of difficulty. The fixation number for novices is greater, but aligns with the number for intermediates in the final process model (cf. Fig. 7).
With increasing level of difficulty, the overall performance of comprehending a process model and correctly answering the related comprehension questions is decreasing for both novices and intermediates. Furthermore, the number of fixations and the length of gaze paths are increasing according to the level of difficulty. Concerning the easy process model, it appears that novices show a weaker performance compared to intermediates. In turn, the performance of novices is approaching the same level as the one of intermediates with rising
level of difficulty. It is remarkable, however, that the results do not differ signifi- cantly considering the fact that few novices (i.e., 5) have no experience in BPMN at all. Overall, it seems that BPMN process models can be intuitively compre- hended. These observations are based on descriptive statistics. For a more rigid investigation, the hypotheses are tested for statistical significance in Section 5.2.
Easy Medium Hard
50000100000150000
Level of Difficulty
Comprehension Duration (ms)
Fig. 4: Comprehension Duration
True False Uncertain
50001500025000
Answer
Respone Time (ms)
Fig. 5: Response Time
Expertise*Level.of.Difficulty effect plot
Level of Difficulty
Answering Score
−0.2 0.0 0.2 0.4
Easy Medium Hard
Expertise
Int Nov
Fig. 6: Answering Score
Expertise*Stimulus effect plot
Level of Difficulty
Fixation Number
100 120 140 160 180 200 220
Easy Medium Hard
Expertise
Int Nov
Fig. 7: Fixation Number
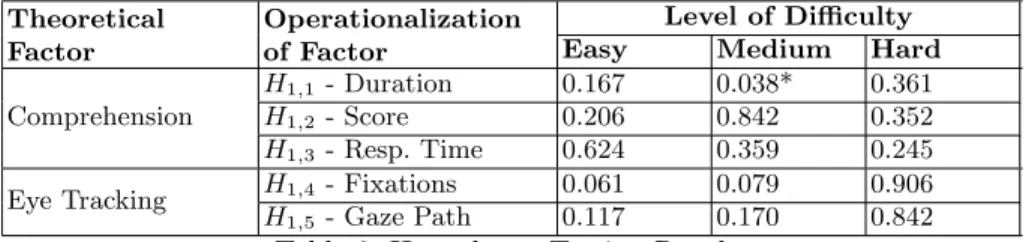
5.2 Hypotheses Testing
Section 5.1 indicates differences regarding novices and intermediates. In the fol- lowing, we test whether the observed differences are statistically significant (cf.
Table 2). We test the dependent variables with theStudent’s t-test. A successful t-test (withp < p0 at risk levelα= 0,05) will reject a null hypothesis [18].
The only hypothesis showing a significant result isH1,1regarding the medium level of difficulty. Furthermore, no statistically significant differences are observed
and, therefore, the hypotheses must be rejected. Based on this, the implica- tions will be raised that high expertise in the field of process modeling does not necessarily imply a better comprehension of process models. However, more experiments will be conducted to reevaluate these results.
Theoretical Factor
Operationalization of Factor
Level of Difficulty
Easy Medium Hard
Comprehension
H1,1 - Duration 0.167 0.038* 0.361
H1,2 - Score 0.206 0.842 0.352
H1,3 - Resp. Time 0.624 0.359 0.245 Eye Tracking H1,4 - Fixations 0.061 0.079 0.906 H1,5 - Gaze Path 0.117 0.170 0.842
Table 2: Hypotheses Testing Results
5.3 Threats to Validity
In general, any experiment bears risks that might affect its results. In particular, its levels of validity need to be checked and limitations be discussed. The selection of subjects and respective categorization into two groups (i.e., novices and inter- mediates) with respect to their expertise in process modeling done by a median split is a possible risk. It is debatable whether an individual can be considered as an intermediate having spent more than 21 hours on process modeling. A broader distribution with novices, intermediates, and experts needs to be evalu- ated as well. The considered scenarios constitute an additional risk. A familiar or recurring scenario might affect process model comprehension positively. There- fore, additional research on the influence of the considered scenarios on process model comprehension is needed. Further, the missing option to see the process model, while answering related questions, constitutes another threat to validity.
The process models must be memorized and, hence, there is a growing risk that given answers were guessed due to wrong or incomplete memorization. Another risk concerns the reflected level of difficulty from respective process models. The number of elements as well as the structures of these models might be imbal- anced between the different levels of difficulty. First results are promising, but their generalization needs to be confirmed by additional experiments.
5.4 Experimental Results and Conceptual Framework
The conducted experiment focused on BPMN process models. The considered factor related to process modeling was the level of difficulty. Subjects were di- vided into two groups (i.e., novices and intermediates). Furthermore, we used eye tracking to evaluate how subjects read and comprehend process models with varying levels of difficulty. The obtained results indicate that an increase in
model difficulty might affect process model comprehension. Upon these findings, we make the first decisive step towards the intended conceptual framework (i.e., statistical and empirical evaluation as well as categorization of process models based on their difficulty). In general, the reasons for this outcome might be man- ifold, ranging frommodeling topersonal factors. On one hand, familiarity of an individual with a process scenario and their following confrontation thereof as well as resulting impact on respective cognitive load may be a reason. On the other hand, the use of flattened (i.e., non-modular) or ramified process models might be another reason. Currently, we are conducting experiments measuring theheart rate variabilityandelectrodermal activity of subjects as well as making use of theConstrual Level Theory aiming on further objectives of the conceptual framework (i.e., identification of modeling rules) [19].
6 Related Work
In [20], various process modeling languages are assessed. In turn, [21] gives in- sights into the factors influencing the comprehension of process models. The influence of complexity on process model comprehensibility is investigated in [22], whereas [23] analyzes the effect of modularity on process understanding. A discussion of the factors influencing process model comprehension is presented in [24]. Regarding process modeling, only little work exists taking cognitive aspects into account as well. [25] discusses how a reduced cognitive load influences end user understanding of conceptual models, whereas [26] describes the cognitive difficulty of understanding different relations between process model elements.
Issues related to visual notations are discussed in [27], which defines a set of prin- ciples for designing cognitively effective visual notations. Based on thePhysics of Notations, [28] provides an approach that aims at operationalizing perceptual properties of notations. Furthermore, [7] explores which kind of process repre- sentation individuals prefer depending on their cognitive style.
Eye tracking is an emerging technique and related research is conducted in various application domains [29, 30]. In line with this trend, eye tracking is increasingly used in process modeling research. In [31], it is shown that task- based process models result in a change of pupil dilation as an evidence for higher mental effort. Findings how eye tracking can contribute to a more fine- grained understanding and evaluation of business process models by a subject’s perspective can be found in [32]. Furthermore, in [33] the research on the factors influencing process model comprehension tasks is addressed using eye tracking.
Common to the discussed approaches is their focus on the resulting process model. However, [34] evaluates the process of process modeling itself, whereas [35] identified fixation patterns with eye tracking for acquiring a better un- derstanding of factors impacting process model comprehension. Moreover, the research question on how process models are created by individuals is addressed.
Altogether, none of the discussed works deal with process model comprehen- sion as proposed by the presented conceptual framework.
7 Summary and Outlook
The paper presented a conceptual framework for the comprehension of business process models. From the perspective of cognitive neuroscience and psychology, the goal is to identify factors fostering the comprehension of process models with an emphasis put on process modeling and on the influence of personal factors.
First results from an eye tracking experiment were presented. We hypothesized that individuals with expertise in process modeling are more efficient regarding process model comprehension. In the end, the stated hypotheses need further research using the conceptual framework. The results indicate that novices are not struggling more than intermediates regarding process model comprehension.
The next step will be the consideration of other process modeling languages and recording methods as well as the use of theories originating from cognitive psychology. Additionally, we strive for an extensive examination considering the specific visual symbol sets of respective modeling languages. The overall goal with the conceptual framework is to provide rules for a better comprehension of process models as well as directives for creating better process models.
References
1. Ottensooser, A., Fekete, A., Reijers, H.A., Mendling, J., Meicstas, C.: Making Sense of Business Process Descriptions: An Experimental Comparison of Graphical and Textual Notations. In: J of Systems and Software. Volume 85. (2012) 596–606 2. Schultheiss, L.A., Heiliger, E.: Techniques of Flow-Charting. In: Proc 1963 Clinic
on Library Applications of Data Processeing. (1963) 62–78
3. OMG: Business Process Management & Notation 2.0 (2017) www.bpmn.org, last visited on 2017/02/27.
4. van der Aalst, W.M.P.: Formalization and Verification of Event-driven Process Chains. In: Inf & Soft Tech. (1999) 639–650
5. Wilson, J.A.: Gantt Charts: A Centenary Appreciation. In: European Journal of Operational Research. Volume 149. (2003) 430–437
6. Johansson, L.O., W¨arja, M., Carlsson, S.: An Evaluation of Business Process Model Techniques, Using Moodys Quality Criterion for a Good Diagram. In:
CEUR Workshop Proceedings. Volume 963. (2012)
7. Figl, K., Recker, J.: Exploring Cognitive Style and Task-Specific Preferences for Process Representations. In: Requir. Eng. (2014) 63–85
8. Indulska, M., Green, P., Recker, J., Rosemann, M.: Business Process Modeling:
Perceived Benefits. In: Proc 28th Int’l Conf on Concept Modeling. (2009) 458–471 9. Mendling, J., Reijers, H.A., van der Aalst, W.M.: Seven Process Modeling Guide-
lines (7PMG). In: Inf & Software Techn. (2010) 127–136
10. Baars, B.J., Gage, N.M.: Cognition, Brain, and Consciousness: Introduction to Cognitive Neuroscience. Academic Press (2010)
11. Anderson, J.R.: Cognitive Psychology and its Implications. WH Freeman/Times Books/Henry Holt & Co (1990)
12. Weber, B., Reichert, M., Mendling, J., Reijers, H.A.: Refactoring Large Process Model Repositories. In: Computers in Industry. (2011) 467–486
13. Mendling, J.: Metrics for Process Models: Empirical Foundations of Verifiation, Error Prediction, and Guidelines for Correctness. Springer (2008)
14. Majaranta, P.: Gaze Interaction and Applications of Eye Tracking: Advances in Assistive Technologies. IGI Global (2011)
15. Salvucci, D.D., Goldberg, J.H.: Identifying Fixations and Saccades in Eye-Tracking Protocols. In: Proc 2000 Symp on Eye Tracking Research & App. (2000) 71–78 16. Wohlin, C., Runeson, P., H¨ost, M., Ohlsson, M.C., Regnell, B., Wesslen, A.: Ex-
perimentation in Software Engineering - An Introduction. Kluwer (2000)
17. SMI: iView X Hi-Speed (2016) http://www.smivision.com/en/gaze-and-eye- tracking-systems/products/iview-x-hi-speed.html, last visited on 2017/02/27.
18. Sirkin, M.: Statistics for the Social Sciences. Volume 3. Sage (2005)
19. Zimoch, M., Kolb, J., Reichert, M.: Considering Social Distance as an Influence Factor in the Process of Process Modeling. In: BPMDS’16. (2016) 97–112 20. Kiepuszewski, B., Hofstede, A.H.M.T., Bussler, C.: On Structured Workflow Mod-
elling. In: Proc 12th Int’l Conf on Adv Inf Systems Engineering. (2000) 431–445 21. Melcher, J., Mendling, J., Reijers, H., Seese, D.: On Measuring the Understand-
ability of Process Models. In: BPM Workshops: LNBIP. (2009) 465–476
22. Mendling, J., Reijers, H.A., Cardoso, J.: What Makes Process Models Understand- able? In: Proc 5th Int’l Conf on Business Process Mgmt. (2007) 48–63
23. Reijers, H.A., Mendling, J.: Modularity in Process Models: Review and Effects.
In: Proc 5th Int’l Conf on Business Process Management. (2008) 20–35
24. Mendling, J., Strembeck, M., Recker, J.: Factors of Process Model Comprehension- Findings from a Series of Experiments. In: Decis. Support Syst. (2012) 195–206 25. Moody, D.L.: Cognitive Load Effects on End User Understanding of Conceptual
Models: An Experimental Analysis. In: Adv in Data and Inf Sys. (2004) 129–143 26. Figl, K., Laue, R.: Cognitive Complexity in Business Process Modeling. In: Ad-
vanced Information Systems Engineering. (2011) 452–466
27. Moody, D.: The ”Physics” of Notations: Toward a Scientific Basis for Constructing Visual Notations in Software Engineering. In: Trans. Softw Eng. (2009) 756–779 28. van der Linden, D., Zamansky, A., Hadar, I.: How Cognitively Effective is a Visual
Notation? On the Inherent Difficulty of Operationalizing the Physics of Notations.
In: Int’l Workshop on BPMDS. (2016) 448–462
29. Mele, M.L., Federici, S.: Gaze and Eye-Tracking Solutions for Psychological Re- search. In: Cognitive Processing. Volume 13. (2012) 261–265
30. Jacob, R.J.K., Karn, K.S.: Eye Tracking in Human-Computer Interaction and Usability Research: Ready to Deliver the Promises. In: Mind. Volume 2. (2003) 31. Dobesova, Z., Malcik, M.: Workflow Diagrams and Pupil Dilatation in Eye Tracking
Testing. In: Proc 13th Int’l Conf on Emer eLearning Tech & App. (2015) 59–64 32. Hogrebe, F., Gehrke, N., N¨uttgens, M.: Eye Tracking Experiments in Business Pro-
cess Modeling: Agenda Setting and Proof of Concept. In: Proc 4th Int’l Workshop on Enterprise Modelling and Information Systems Architectures. (2011) 183–188 33. Petrusel, R., Mendling, J.: Eye-Tracking the Factors of Process Model Compre-
hension Tasks. In: Proc 25th Int’l Conf on Adv Inf Sys Eng. (2013) 224–239 34. Martini, M., Pinggera, J., Neurauter, M., Sachse, P., Furtner, M., Weber, B.: The
Impact of Working Memory and the Process of Process Modelling on Model Qual- ity: Investigating Experienced versus Inexperienced Modellers. In: Scientific Re- ports. Volume 6. (2016)
35. Weber, B., Pinggera, J., Neurauter, M., Zugal, S., Martini, M., Furtner, M., Sachse, P., Schnitzer, D.: Fixation Patterns During Process Model Creation: Initial Steps Toward Neuro-Adaptive Process Modeling Environments. In: Proceedings 49th Int’l Conf on System Sciences. (2016) 600–609