Notations on Mental Load and Mental Effort
Michael Zimoch1, R¨udiger Pryss1, Thomas Probst2, Winfried Schlee3, and Manfred Reichert1
1 Institute of Databases and Information Systems, Ulm University, Germany
2 Dep for Psychotherapy and Biopsycho Health, Danube University Krems, Austria
3 Dep of Psychiatry and Psychotherapy, Regensburg University, Germany {michael.zimoch, ruediger.pryss, manfred.reichert}@uni-ulm.de, thomas.probst@donau-uni.ac.at, winfried.schlee@googlemail.com
Abstract. Over the last decade, plenty business process modeling nota- tions emerged for the documentation of business processes in enterprises.
During the learning of a modeling notation, an individual is confronted with a cognitive load that has an impact on the comprehension of a notation with its underlying formalisms and concepts. To address the cognitive load, this paper presents the results from an exploratory study, in which a sample of 94 participants, divided into novices, intermedi- ates, and experts, needed to assess process models expressed in terms of eight different process modeling notations, i.e., BPMN 2.0, Declara- tive Process Modeling, eGantt Charts, EPCs, Flow Charts, IDEF3, Petri Nets, and UML Activity Diagrams. The study focus was set on the sub- jective comprehensibility and accessibility of process models reflecting participant’s cognitive load (i.e., mental load and mental effort). Based on the cognitive load, a factor reflecting the mental difficulty for com- prehending process models in different modeling notations was derived.
The results indicate that established modeling notations from industry (e.g., BPMN) should be the first choice for enterprises when striving for process management. Moreover, study insights may be used to deter- mine which modeling notations should be taught for an introduction in process modeling or which notation is useful to teach and train process modelers or analysts.
Keywords: Business Process Modeling Notations, Cognitive Load, Men- tal Load, Mental Effort, Human-centered Design
1 Introduction
Business process models specify in terms of textual or graphical artifacts the business processes in an enterprise [1]. In this context, insights on the compre- hension of process models demonstrate thatprocess model comprehension plays an important role when analyzing and optimizing processes [2, 3]. As a result, enterprises are confronted with an influx of process modeling notations (e.g., Business Process Model and Notation (BPMN) 2.0 [4], Event-driven Process
Chains (EPCs) [5], orFlow Charts [6]) for the documentation of their business processes within process models. However, for an effective use of process models, the latter must ensure that the processes of an enterprise are comprehended correctly by all involved stakeholders.
In prior research, we investigated process model comprehension in order to re- veal factors fostering or thwarting respective comprehension [7, 8]. Furthermore, focusing on cognitive neuroscience and psychology, we proposed valuable lessons learned on how to optimize empirical studies for a deeper investigation on pro- cess model comprehension [9].
To enhance our previous work on process model comprehension, this work pre- sents the results obtained from an exploratory process model comprehension study. In detail, a sample consisting of n = 38 novices, n = 21 intermediates, andn= 35 experts in the domain of process modeling are confronted with pro- cess models expressed in terms of eight differentprocess modeling notations. The objective of the study was to evaluate the perceived cognitive load (i.e., effort being used in the working memory) of participants caused when comprehending respective modeling notations. Based on the results we obtained, we derived for eachprocess modeling notation a mental difficulty level.
This work contributes to the field of process model comprehension in two ways.
First, in research, we want to learn more about the cognitive load and adverse effects when comprehending process models in terms of different modeling no- tations [10]. The obtained insights can foster related empirical investigations in this context. Second, in practice, enterprises can be supported in making decision about the adoption of a particularprocess modeling notationor which modeling tool should be used when adopting process-oriented thinking.
The remainder of the paper is structured as follows: Section 2 introduces theo- retical backgrounds. Study setting and operation are explained in Section 3. In Section 4, the obtained results are described empirically and discussed. Finally, Section 5 discusses related work, while Section 6 summarizes the paper and gives an outlook on future work.
2 Theoretical Background
Thecognitive load can be defined as a multidimensional construct representing an individuals cognitive capacity used to work on or to solve a task as well as to address a problem [11]. Thereby, cognitive load has a causal dimension re- flecting the interaction between task- (e.g., inherent difficulty of the task) and subject-specific characteristics (e.g., knowledge about a topic). Particularly,cog- nitive load is comprised of the assessment dimensions describing the measurable aspectsmental load andmental effort [12, 13]. Themental load relates to a task, which indicates the cognitive capacity needed to cope with the complexity of a task. Juxtaposingmental load, themental effort is subject-specific and refers to the invested cognitive capacity of an individual while working on a task [14].
In many fields (e.g., psychology, education), the observation as well as measure- ment of thecognitive loadhas become crucial. Reasons for this are that a reduced
cognitive load has a positive impact on the working memory, thus promoting in- formation processing and assuring a greater success in learning processes [15].
In turn, a high cognitive load (i.e., overloading the working memory) inhibits information processing leading to confusion and a higher risk of making mista- kes. As a consequence,cognitive load should be kept at an appropriate level [16].
Therefore, an appropriate level of cognitive load can be ensured from the ideal interplay ofmental load andmental effort. Particularly, by designing tasks and presenting information in such way that an individual is not confronted with challenges, demanding more capacity in the working memory [17].
3 Study Setting
Anyprocess modeling notation has its own strengths and weaknesses regarding, for example, model conformance checking or expressibility [23]. Considering this fact, enterprises are confronted with the important decision about whichprocess modeling notation fulfills their requirements and covers all their needs. Some of the process modeling notations are offering an extensive syntax to express business processes in a fine-grained level. On the other, somenotations provide only a limited set, which is, however, sufficient for correctness verification of process models [24]. For an effective use of process modeling notations, their formalisms and methodologies must be comprehended correctly. Thereby, the acquisition of knowledge about aprocess modeling notationrepresents a cognitive task. In this context, several aspects of a modeling notation are learned more easily and quickly, while, on the other, some aspects are difficult to learn, having different impact on thecognitive loadof an individual. However, this effect cannot be generalized and, hence, is completely different between individuals. Especially
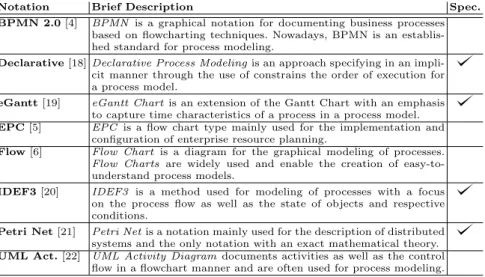
Notation Brief Description Spec.
BPMN 2.0[4] BPMN is a graphical notation for documenting business processes based on flowcharting techniques. Nowadays, BPMN is an establis- hed standard for process modeling.
Declarative[18]Declarative Process Modelingis an approach specifying in an impli- cit manner through the use of constrains the order of execution for a process model.
eGantt[19] eGantt Chartis an extension of the Gantt Chart with an emphasis to capture time characteristics of a process in a process model.
EPC[5] EPC is a flow chart type mainly used for the implementation and configuration of enterprise resource planning.
Flow[6] Flow Chart is a diagram for the graphical modeling of processes.
Flow Charts are widely used and enable the creation of easy-to- understand process models.
IDEF3[20] IDEF3 is a method used for modeling of processes with a focus on the process flow as well as the state of objects and respective conditions.
Petri Net[21] Petri Netis a notation mainly used for the description of distributed systems and the only notation with an exact mathematical theory.
UML Act.[22] UML Activity Diagramdocuments activities as well as the control flow in a flowchart manner and are often used for process modeling.
Table 1: Process Modeling Notations used in the Study
novices without any knowledge in process modeling are often confronted with difficulties how to properly comprehendprocess modeling notations. To address this issue, we conduct an exploratory comprehension study in which novices, intermediates, and experts from the domain Thereby, we want to investigate the impact of modeling notations on the cognitive load (i.e., mental load and mental effort) of individuals. In detail, we agree on using the followingnotations as described in Table 1. Aside well-known modeling notations (e.g., BPMN), we chosenotations that are rarely seen in the process repositories of enterprises (e.g.,IDEF3). Table 1 contains an additional columnspecific(i.e., Spec.), stating whether the use of a modeling notationis more focused on particular aspects.
3.1 Study Planning
Participants.All participants have an academic background. In detail, students and research associates as well as professionals, who take a distance e-learning course, are invited for the study at Ulm University. There are no prerequisites for participating in the study and all participants are recruited on a voluntary basis. Further, all participants have given their consent.
Object.Participants need to assess eight different process models (cf. Table 1) regarding their subjective comprehensibility and accessibility. With this asses- sment, we want to draw conclusions about the perceivedmental load andmental effort of the participants. Thereby, the process models reflect three different le- vels of complexity (i.e.,easy,medium, andhard). To be more precise, the easy process model contains only basic modeling elements. With rising level of com- plexity, the total number of elements is increased and new elements, previously not contained in the process model, are added. For eachlevel of complexity, pro- cess models are created using the mentioned eight process modeling notations respectively (cf. Table 1). As the semantic description of the process models is not relevant in this context, we use abstract labels (i.e., alphabetic letters) for the single modeling elements.1 Furthermore, it is ensured that all process mo- dels are comparable within a specificlevel of complexity. Therefore, experts and novices in the domain of process modeling, who were not participating in the study, ranked and compared the used process models.
Instrumentation.There are three different questionnaires in the study. First, apre-study questionnaireis used gathering demographic data (e.g., age, gender) and asking about prior knowledge on process modeling notations. In addition, participants were asked about their familiarity with specificmodeling notations.
Second, a mid-study questionnaire is used providing four items regarding the mental load (i.e., comprehensibility and accessibility of the process models): the 1 process model is comprehensible, the 2process model is accessible, the 3 used modeling constructs (e.g., split and join) are comprehensible, and the 4 the process flow is understood properly. All items are rated on a 7-point Likert scale, ranging from 0 (i.e., strongly disagree) to 6 (i.e., strongly agree).
Third, apost-study questionnaire is used with four items capturing the mental
1 Material:https://www.dropbox.com/sh/4shyxdy2p4xsf71/AAAfY1EMfwrluYA2BQ-g4z18a?dl=0
effort of participants: the 1 mental demand for performing the task is high, the 2 task is complex, the 3overall performance during the task, and the 4 effort level for performing the task. All items are rated on a 7-point Likert scale, ranging from 0 (i.e., strongly disagree) to 6 (i.e., strongly agree).
In addition, in thepost-questionnaireparticipants need to categorize the assessed process models according their subjective preferences regarding thecomprehen- sibility as well asaccessibility, beginning from the simplest to the most difficult process model. Finally, participants are able to leave qualitative feedback.
3.2 Study Design and Procedure
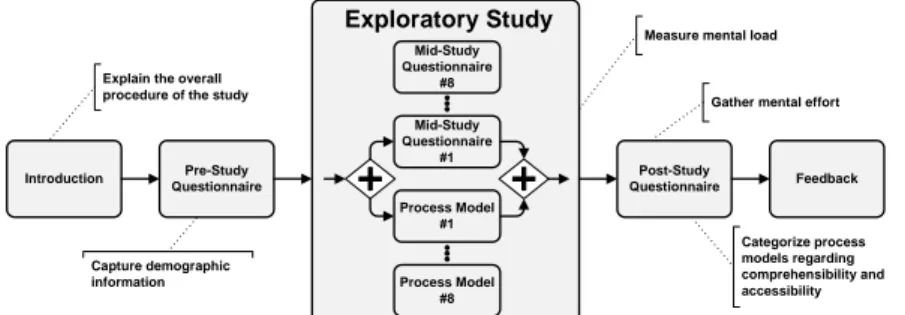
The design and procedure of the study is based on the guidelines set out by [25] on how to systematically plan, conduct, and evaluate studies. Precedent, a pilot study with four students and four research associates was conducted for the improvement of the process models and to ensure their comparability with each other. Moreover, the pilot study was used to eliminate potential ambigui- ties as well as misunderstandings. Further, the chosen language in the study is German. Within a period of two weeks, several sessions for conducting the study are offered to the participants. Each session took about 20 minutes and ran as follows: An introduction is given to the participants, in which the procedure of the study is explained and the study materials (i.e., process models, questionnai- res) are handed out. Afterwards, the participants need to answer the pre-study questionnaire. Following this, they are asked to read and assess eight randomly selected process models. Thereby, it is ensured that participants need to assess each modeling notation in a study run. For each assessed process model, the participants have to answer statements regarding subjective comprehensibility andaccessibility (i.e.,mental load). After completing this step, participants ans- wer the post-study questionnaire, providing information about perceivedmental effort and they need to categorize assessed process models in a ranking system.
The study procedure is illustrated in Figure 1.
Introduction Pre-Study Questionnaire
Exploratory Study
Mid-Study Questionnaire
#1
Process Model
#1
Process Model
#8 Mid-Study Questionnaire
#8
Post-Study
Questionnaire Feedback
Capture demographic information
Explain the overall
procedure of the study Gather mental effort
Categorize process models regarding comprehensibility and accessibility Measure mental load
Fig. 1: Study Design
4 Data Analysis and Interpretation
In total, data from 94 participants were collected. A median split is performed to categorize the participants into samples of novices, intermediates, and experts.
Therefore, we determine the median for the number of process models a partici- pant has analyzed and created during the last 12 months. Consequently,n= 38 novices,n= 21 intermediates, andn= 35 experts participate in the study. Each participant assesses eight randomly selected process models regarding subjective comprehensibilityandaccessibility(i.e.,mental load), resulting inn= 752 asses- sed process models. Table 2 summarizes the detailed distribution of the assessed process modeling notations for eachlevel of complexity.
Process Modeling Notations
BPMN Declarative eGantt EPC Flow IDEF3 Petri UML Act.
Leve
l Easy 30 31 33 31 36 28 34 35
Medium29 32 33 36 28 35 33 31
Hard 36 31 28 27 30 31 27 27
Table 2: Number of Assessed Process Models
4.1 Descriptive Statistics
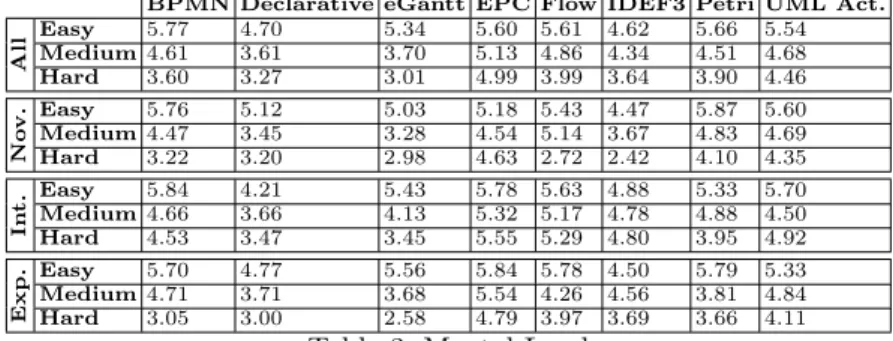
The obtained data regarding the perceivedmental load for eachprocess modeling notations are presented in Table 3 as means for the entire sample size as well as each sample respectively (i.e., novices, intermediates, and experts). Higher values indicate lessmental load. As described in Section 3.1,mental load is determined with four aggregated items. As a prerequisite, all response variables must show a high reliability [26]. For this purpose,Cronbach’s α(i.e., several items are an accurate estimate of an accumulated item) is calculated.2 For mental load, a Cronbach withα= 0.79 was calculated.
BPMN Declarative eGantt EPC Flow IDEF3 Petri UML Act.
All
Easy 5.77 4.70 5.34 5.60 5.61 4.62 5.66 5.54 Medium4.61 3.61 3.70 5.13 4.86 4.34 4.51 4.68 Hard 3.60 3.27 3.01 4.99 3.99 3.64 3.90 4.46
Nov
. Easy 5.76 5.12 5.03 5.18 5.43 4.47 5.87 5.60 Medium4.47 3.45 3.28 4.54 5.14 3.67 4.83 4.69 Hard 3.22 3.20 2.98 4.63 2.72 2.42 4.10 4.35
Int. Easy 5.84 4.21 5.43 5.78 5.63 4.88 5.33 5.70 Medium4.66 3.66 4.13 5.32 5.17 4.78 4.88 4.50 Hard 4.53 3.47 3.45 5.55 5.29 4.80 3.95 4.92
Exp.
Easy 5.70 4.77 5.56 5.84 5.78 4.50 5.79 5.33 Medium4.71 3.71 3.68 5.54 4.26 4.56 3.81 4.84 Hard 3.05 3.00 2.58 4.79 3.97 3.69 3.66 4.11
Table 3: Mental Load
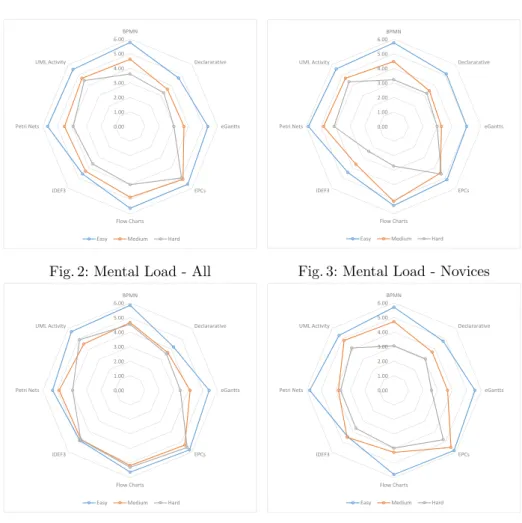
Figures 2 - 4 depict the two-dimensional data (i.e.,process modeling notati- ons,level of complexity) regarding themental loadfor the entire sample and each sample respectively (i.e., novices, intermediates, and experts) as radar charts.
Thereby, higher values stand for lessmental load on the used scale.
2 According to [26],α >0.6 acceptable reliability; 0.7< α <0.9 good reliability
0.00 1.00 2.00 3.00 4.00 5.00 6.00
BPMN
Declararative
eGantts
EPCs
Flow Charts IDEF3
Petri Nets UML Activity
Easy Medium Hard
Fig. 2: Mental Load - All
0.00 1.00 2.00 3.00 4.00 5.00 6.00
BPMN
Declararative
eGantts
EPCs
Flow Charts IDEF3
Petri Nets UML Activity
Easy Medium Hard
Fig. 3: Mental Load - Novices
0.00 1.00 2.00 3.00 4.00 5.00 6.00
BPMN
Declararative
eGantts
EPCs
Flow Charts IDEF3
Petri Nets UML Activity
Easy Medium Hard
Fig. 4: Mental Load - Intermediates
0.00 1.00 2.00 3.00 4.00 5.00 6.00
BPMN
Declararative
eGantts
EPCs
Flow Charts IDEF3
Petri Nets UML Activity
Easy Medium Hard
Fig. 5: Mental Load - Experts
Regarding the easy level of complexity (cf. Figures 2 - 4), several process modeling notations (e.g., BPMN,Petri Nets, andUML Activity Diagrams) are close to the maximum of the scale (i.e., 6 - reflecting less mental effort). Ho- wever, comparing the values obtained from each sample, there is an indication that easy process modelsexpressed inDeclarative or IDEF3 appear to be more challenging to comprehend and, consequently, demand a highermental load from the participants. In general, with risinglevel of complexity, an erratic decrease in the mental load is observable (cf. Table 2). In detail, instead of an uniform decrease of the values for themental load, for severalmodeling notations, an ab- rupt decline can be seen in the samples. For example, there is a significant drop in themental loadbetween theeasy andmedium BPMN process modelsin each sample. For novices and intermediates, there is only a little decline in themental load between themedium andhard BPMN model. However, experts show again a significant drop in themental load forBPMN process models. Another example
concerns the process models expressed in terms of EPCs. There are only slight decreases in the mental load, which indicates that the comprehension of EPC process models appears to be feasible throughout thelevels of complexity.
Table 4 shows the mental effort (ME) for the entire sample as well as each sample respectively (i.e., novices, intermediates, and experts). Mental effort is determined by four aggravated items (cf. Section 3.1), here, Cronbach resulted inα= 0.83. Higher values stand for lessmental effort. The study task demands a moderatemental effort from all samples. Further, there are only minimal dif- ferences in themental effort between novices, intermediates, and experts.
All Novices Inter. Experts ME2.84 2.76 2.89 2.94
Table 4: Mental Effort
4.2 Discussion
It is obvious that with risinglevel of complexity the mental load regarding the process modeling notations is decreasing (cf. Figure 2). Despite the compara- bility of the process models, however, it is interesting to see how the mental load is decreasing in a different manner between novices, intermediates, and ex- perts. For example, the mental load from intermediates regarding the medium andhard process model is about the same. In turn, for novices and experts, the differences between these two levels of complexity are clearly discernible. The same can be observed regarding theIDEF3 process models. Further, the results provide a good indication about the mental load when comprehending process models in particularmodeling notations. More complex process models expressed inDeclarative, IDEF3, oreGantt appear to be more challenging to comprehend.
Reason might be that thesenotations are not as widespread in practice as other notations. Often, amongst others, tertiary educational institutions are teaching more commonnotations widely used in practice such asBPMN and EPCs.
While there are different characteristics for the mental load, however, themen- tal effort needed for process model comprehension is approximately the same between novices, intermediates, and experts. Although the mental effort for comprehending a process model is on a moderate level, however, process mo- del comprehension is a complex matter that needs to be taken into account.
Based on the study results, Figure 6 presents the derived mental difficulty for eachprocess modeling notation and respectivelevel of complexity. Therefore, for each process model, the percentage proportion is calculated based on the cate- gorization the participants indicated in thepost-study questionnaire (cf. Section 3.1). Therefore, we considered respective position of each process model as well as their level of complexity. The calculated percentage proportion serves as a factor used for multiplying the aggravated constructs mental load and mental effort to derive the mental difficulty[27].
As shown in Figure 6, regarding aneasy level of complexity, almost all values, except forDeclarative andIDEF3, are still in the green range. This means that
0 1 2 3 4 5 6
BPMN Declarative eGantt EPC Flow IDEF3 Petri UML Act.
Easy Medium Hard
Process Modeling Notations
Mental Difficulty
Fig. 6: Mental Difficulty
the comprehension of such process models should not be a challenge. With rising level of complexity, the values for the comprehension of process models tend towards the orange or red range respectively. However, none of the values is located completely in the red range and, consequently, it seems to be that process models can be comprehended independently of themodeling notation and level of complexity. In addition, the results confirm the further use of the widespread and establishedmodeling notations such asBPMN andEPCs.
4.3 Threats to Validity
Study results can only be accurately interpreted when limitations are also dis- cussed.First, the comparison of the differentprocess modeling notationscan also be seen as a comparison like the idiom apples and oranges. Particular modeling notations are usually not used for the direct modeling of business processes, but for other purposes (e.g.,Petri Netsare mainly used for the verification of process models) and, hence, a direct comparison is difficult.Second, the classification of participants into the samples of novices, intermediates, and experts solely based on a median split by considering the number of process models a participant has analyzed and created during the last 12 months may be oversimplified. Hence, results might differ significantly with experts in process modeling with several years of experience. Third, the size of the process models might not be repre- sentative. In general, real world process models are usually much larger than the models we used in the study. Fourth, in addition, to ensure comparability between the process models, the latter are modeled only with basic modeling elements because somemodeling notationsdon’t have the expressiveness for the documentation of complex processes. Fifth, the respective level of complexity reflected by the process models constitutes another threat. The models might be considerably unbalanced between the level of complexity and, hence, working
memory capacity of participants, especially for novices, may be exceeded. Se- venth, specific process modeling notations (e.g., BPMN) may be considered as easy to comprehend since these notations are more familiar than others (e.g., IDEF3), thus resulting in a positive impact onmental load andmental effort.
5 Related Work
A review of existing businessprocess modeling notationsin literature is presented in [23]. Further, the authors present a framework for the classification of mo- deling notationsaccording their purpose. [28] discusses an evaluation ofmodeling notations and proposes a meta-model to capture the concepts of the evaluated notations. In turn, [29] compares and discusses different process modeling met- hods based on aspects like process model representation and tool support.
Concerning research on process model comprehension, [30] gives insights into subject-specific characteristics (e.g., theoretical knowledge) influencing process model comprehension. In turn, [31] evaluates different process modeling notati- ons with respect to their comprehensibility. A discussion about factors having an influence on thecomprehension of process models is presented in [32].
Regarding cognitive aspects, a measure to determine the cognitive complexity for process models is proposed in [33]. Further, [34] shows an approach to reduce the cognitive load when comprehending process models by applying patterns for im- proving the model comprehensibility. The empirical assessment of participants’
mental effort, while creating or comprehending process models, is demonstrated in [35]. The mental effort needed between inexperienced and experienced mo- delers to create process models is investigated in [36].
Altogether, there are several works regarding the comparison ofprocess modeling notations. However, to the best of our knowledge, none of the discussed works deal with such a comparison of process modeling notations, while taking the cognitive load (i.e.,mental load andmental effort) of participants into account.
6 Summary and Outlook
This paper presented the impact of different process modeling notations on the cognitive load (i.e., mental load and mental effort) of n= 38 novices, n= 21 intermediates, andn= 35 experts in the domain of process modeling. Therefore, study participants needed to comprehend and assess process models of different levels of complexity (i.e., easy, medium, hard) in terms of eight different mo- deling notations, i.e.,BPMN 2.0,Declarative Process Modeling,eGantt Charts, EPCs, Flow Charts, IDEF3, Petri Nets, and UML Activity Diagrams. We gat- hered information related to the mental effort and mental load (i.e., cognitive load) of participants while performing the study task. Based on the cognitive load, we derived a factor representing themental difficulty for eachprocess mo- deling notation. The high availability of process modeling notations resulted in a strong demand from enterprises to compare and evaluate these notations in
order to find an appropriate one covering the needs of an enterprise. The presen- tedmental difficultymay support enterprises in making this decision considering the perceivedcognitive load of an individual, while comprehending process mo- dels expressed in terms of different modeling notations. In addition, the results from this paper may help in answering questions about which modeling nota- tions should be supported with a greater emphasis in modeling tools. Further, the results show that the use of establishedmodeling notations (e.g.,BPMN) is recommendable for enterprises and future process modelers as well as analysts.
Future research is needed in order to determine more precise indications about an individuals cognitive load while comprehending process models. Besides an in-depth statistical analysis of the results, for example, instead of using abstract labels the process model elements could be described with concrete labels. Furt- her, participants should be confronted with process models from real projects expressed in terms of the assessedmodeling notations. Finally,cognitive load is only one factor having an effect on the comprehension of process models expres- sed in differentmodeling notationsand, therefore, the consideration of additional factors (e.g.,expressiveness,level of automation) will be subject of future studies.
References
1. Nowak, A., et al.: Flexible Information Design for Business Process Visualizations.
In: 5th Int’l Conf on Service-Oriented Comp and App (SOCA’12). (2012) 1–8 2. Bandara, W., Indulska, M., Chong, S., Sadiq, S.: Major Issues in Business Process
Management: An Expert Perspective. (2007) 1240–1251
3. Gulla, J.A., Brasethvik, T.: On the Challenges of Business Modeling in Large-Scale Reengineering Projects. In: Int’l Conf on Requirements Engineering. (2000) 17–26 4. OMG: Business Process Management & Notation 2.0 (2018) www.bpmn.org, last
visited on 2018/02/27.
5. van der Aalst, W.M.P.: Formalization and Verification of Event-driven Process Chains. In: Inf & Soft Tech. (1999) 639–650
6. Schultheiss, L.A., Heiliger, E.: Techniques of Flow-Charting. In: Proc 1963 Clinic on Library Applications of Data Processeing. (1963) 62–78
7. Zimoch, M., et al.: Cognitive Insights into Business Process Model Comprehen- sion: Preliminary Results for Experienced and Inexperienced Individuals. In: Proc BPMDS’17. (2017) 137–152
8. Zimoch, M., et al.: Using Insights from Cognitive Neuroscience to Investigate the Effects of Event-Driven Process Chains on Process Model Comprehension. In: Proc 1st Int’l Conf on Cognitive Business Process Management. (2017) 446–459 9. Zimoch, M., et al.: Eye Tracking Experiments on Process Model Comprehension:
Lessons Learned. In: Proc BPMDS’17. (2017) 153–168
10. Zugal, S., Pinggera, J., Weber, B.: Assessing Process Models with Cognitive Psy- chology. In: EMISA. Volume 190. (2011) 177–182
11. Paas, F., et al.: Cognitive Load Measurement as a Means to Advance Cognitive Load Theory. In: Educational Psychologist. Volume 38. (2003) 63–71
12. Wickens, C.D.: Multiple Resources and Mental Workload. In: Human Factors.
Volume 50. (2008) 449–455
13. Paas, F.G., Van Merri¨enboer, J.J.: The Efficiency of Instructional Conditions:
An Approach to Combine Mental Effort and Performance Measures. In: Human Factors. Volume 35. (1993) 737–743
14. Krell, M.: Evaluating an Instrument to Measure Mental Load and Mental Ef- fort Considering Different Sources of Validity Evidence. In: Cogent Education.
Volume 4. (2017)
15. Sweller, J.: Cognitive Load During Problem Solving: Effects on Learning. In:
Cognitive Science. Volume 12. (1988) 257–285
16. Ayres, P.: Impact of Reducing Intrinsic Cognitive Load on Learning in a Mathe- matical Domain. In: Applied Cognitive Psychology. Volume 20. (2006) 287–298 17. Baddeley, A.: Working Memory. In: Science. Volume 255. (1992) 556–559 18. van Der Aalst, W.M., et al.: Declarative Workflows: Balancing Between Flexibility
and Support. In: Comp Sci-Res and Dev. Volume 23. (2009) 99–113
19. Lanz, A., Kolb, J., Reichert, M.: Enabling Personalized Process Schedules with Time-Aware Process Views. In: International Conference on Advanced Information Systems Engineering. (2013) 205–216
20. Kim, C.H., Yim, D.S., Weston, R.: An Integrated Use of IDEFO, IDEF3 and Petri Net Methods in Support of Business Process Modelling. In: Proc Instof Mech Eng, Part E: J of Process Mech Eng. (2001) 317–329
21. Murata, T.: Petri Nets: Properties, Analysis and Applications. In: Proceedings of the IEEE. Volume 77. (1989) 541–580
22. Dumas, M., Ter Hofstede, A.H.: UML Activity Diagrams as a Workflow Specifi- cation Language. In: Int’l Conf on the UML. (2001) 76–90
23. Aguilar-Saven, R.S.: Business Process Modelling: Review and Framework. In:
International Journal of Production Economics. Volume 90. (2004) 129–149 24. White, S.A.: Process Modeling Notations and Workflow Patterns. In: Workflow
Handbook. (2004) 265–294
25. Wohlin, C., Runeson, P., H¨ost, M., Ohlsson, M.C., Regnell, B., Wesslen, A.: Ex- perimentation in Software Engineering - An Introduction. Kluwer (2000)
26. Kline, P.: Handbook of Psychological Testing. Volume 2. Routledge (1999) 27. Sweller, J.: Cognitive Load Theory, Learning Difficulty, and Instructional Design.
In: Learning and Instruction. Volume 4. (1994) 295–312
28. List, B., Korherr, B.: An Evaluation of Conceptual Business Process Modelling Languages. In: Proc Symp on Applied Computing (SAC’06). (2006) 1532–1539 29. Wang, W., Ding, H., Dong, J., Ren, C.: A Comparison of Business Process Mo-
deling Methods. In: Int’l Conf on SOLI’06. (2006) 1136–1141
30. Mendling, J., Recker, J., Reijers, H.A., Leopold, H.: An Empirical Review of the Connection Between Model Viewer Characteristics and the Comprehension of Conceptual Process Models. In: Information Systems Frontiers. (2018) 1–25 31. Kiepuszewski, B., Hofstede, A.H.M.T., Bussler, C.: On Structured Workflow Mo-
delling. In: Proc 12th Int’l Conf on Adv Inf Systems Engineering. (2000) 431–445 32. Mendling, J., Strembeck, M., Recker, J.: Factors of Process Model Comprehension- Findings from a Series of Experiments. In: Decis. Support Syst. (2012) 195–206 33. Gruhn, V., Laue, R.: Adopting the Cognitive Complexity Measure for Business
Process Models. In: 5th Int’l Conf on Cog Inf (ICCI’06). (2006) 236–241
34. Gruhn, V., Laue, R.: Reducing the Cognitive Complexity of Business Process Models. In: 8th Int’l Conf on Cognitive Informatics (ICCI’09). (2009) 339–345 35. Zugal, S., Pinggera, J., Reijers, H., Reichert, M., Weber, B.: Making the Case for
Measuring Mental Effort. In: EESSMod’12. (2012)
36. Martini, M., et al.: The Impact of Working Memory and the Process of Process Modelling on Model Quality: Investigating Experienced versus Inexperienced Mo- dellers. In: Scientific Reports. Volume 6. (2016)