1 | P a g e
2 | P a g e
Molecular and behavioral study of the FoxP locus in Drosophila melanogaster
DISSERTATION ZUR ERLANGUNG DES
DOKTORGRADES DER NATURWISSENSCHAFTEN (DR. RER. NAT.) DER FAKULTÄT FÜR BIOLOGIE UND VORKLINISCHE MEDIZIN
DER UNIVERSITÄT REGENSBURG
vorgelegt von Ottavia Palazzo
aus Turin, Italien
im Jahr 2020
3 | P a g e Das Promotionsgesuch wurde eingereicht am:
Datum – Date of application for admission Die Arbeit wurde angeleitet von:
Prof. Dr. Björn Brembs Unterschrift:
Ottavia Palazzo
4 | P a g e
Table of Contents
Abstract
... 61. Introduction
... 71.1 Drosophila as a model organism ... 7
1.2 CRISPR/Cas9 as a powerful genetic tool in flies ... 7
1.2.1 HDR in flies ... 8
1.2.2 tRNA-based vectors ... 10
1.3 The Fox genes ... 10
1.3.1 FoxP in vertebrates ... 11
1.3.2 FoxP in Drosophila ... 13
1.4 Aim of the study ... 14
2. Materials and methods
... 162.1 Fly strains ... 16
2.2 In-silico sequences alignment ... 16
2.3 Transgenic flies generation ... 17
2.4 Immunohistochemistry ... 20
2.5 Image acquisition and analysis ... 21
2.6 RT-qPCR ... 21
2.7 Behavior ... 22
2.8 Statistical analysis ... 23
3. Results
... 273.1 FoxP-isoB expression in the Drosophila brain ... 27
3.2 FoxP-isoB is expressed in different types of neurons ... 30
3.3 FoxP isoforms are differentially expressed ... 34
3.4 FoxP-isoB knockout flies are impaired in locomotor behavior ... 37
5 | P a g e
3.5 FoxP-all isoform knockout and comparison with FoxP-isoB mutant ... 40
3.6 Area-specific conditional FoxP knockout ... 42
3.7 Time-specific conditional FoxP knockout ... 47
4. Discussion
... 494.1 FoxP is expressed in various neuropils and cell-types ... 49
4.2 FoxP is required for normal locomotor behavior ... 52
5. Conclusion
... 545.1 Conclusions and future perspectives ... 54
6. Bibliography
... 566.1 Research papers and reviews ... 56
6.2 Websites ... 66
7. Attachments
... 677.1 Supplementary figures ... 67
8. List of figures
... 699. List of tables
... 7010. Acknowledgements
... 70Bonus section
... 74Eidesstattliche Erklärung
... 766 | P a g e
Abstract
The human FOXP2 gene has been identified as a key component for the development of language. Such vocal learning is a form of motor learning that proceeds slowly from babbling in toddlers (or subsong in zebra finches) towards fluent speech in adults (or crystallized song in zebra finches). This particular learning process can be conceptualized as operant self-learning, in which the organism learns the correct actions only by evaluating the outcomes of its previous behavior, in the absence of other sensory cues. In the fruit fly Drosophila, the dFoxP orthologue has been shown to also be involved in operant self-learning of yaw torque (attempted rotations around the vertical body axis) in tethered flies, an experiment conceptually analogous to vocal learning. However, despite those findings, the expression, function and mechanisms of action of dFoxP remain to be elucidated. In this work, we thus generated four transgenic lines using the CRISPR/Cas9 technique to unravel the expression pattern of FoxP and its function in locomotor behavior and object fixation. We find that the different FoxP isoforms are expressed in neurons, but not in glia and that those isoforms are differentially expressed. Furthermore, we detect FoxP expression in, e.g., the protocerebral bridge, the fan shaped body and in motorneurons, but not in the mushroom bodies. Finally, we discover that FoxP expression during development, but not adulthood, is required for normal locomotion and landmark fixation in walking flies.
7 | P a g e
1. Introduction
1.1 Drosophila as a model organism
For over a century the fruit fly Drosophila melanogaster has been used as a powerful genetic tool for biological research (Roote and Prokop 2013) while helping founding the field of classical genetics. The reason why this insect has grown in importance in research during the decades are multiple: they are easy and cheap to keep, the generation time takes about 10 days, which allows a rapid research progression, furthermore they are particularly useful for performing both forward and reverse genetics (Brembs 2016).
Moreover, what makes the fruit fly a perfect model organism for biologists is the rich availability of genetic tools developed in more than a century as well as well-organized databases and stock centers that allow to easily combine classic genetic approaches with molecular genetic ones. One of the molecular techniques that in the last decade have been utilized and optimized is the CRISPR/Cas9 system, which is significantly advancing the ability of researchers to engineer targeted genome modifications for functional studies of genes and genetic elements (Gratz et al., 2015). Ultimately, another reason for the fly’s success in biological research is their ease of handling, that together with their ability to perform many behaviors (from simple motor actions to complex social interactions), makes them particularly suitable to be used for various behavioral paradigms (Sokolowski, 2001).
1.2 CRISPR/Cas9 as a powerful genetic tool in flies
As previously said, one of the molecular techniques that have known drastic advancement in the last decade is the DNA modification by CRISPR/Cas9 (Clustered Regularly Interspaced Short Palindromic Repeats/Cas9).In 2012, Doudna and Charpentier were the first to propose that CRISPR/Cas9 could be used for programmable editing of genomes (Jinek et al., 2012).
This mechanism is born in bacteria and archaea as a defense system developed to resist viral infections (Horvath and Barrangou, 2010). The main components of this immune response are firstly the short palindromic repeats, which are interspaced by spacer DNA regions that are identical to ones of bacteriophages, while the second components are
8 | P a g e the Cas genes, which will generate the Cas proteins that are going to act as helicases and endonucleases. When the attacking bacteriophage injects the DNA in the receiving bacterial cell, the latter will transcribe the Cas proteins and the spacer DNA (that recognize the injected sequence), which together are going to neutralize the foreign piece of DNA.
This system can then be engineered and optimized in order to be used in all living cells to modify pieces of chosen genome in a precise fashion. This can be achieved by simply using the single Cas protein from Streptococcus pyogenes (the Cas9) (Jinek et al., 2012) and an engineered gRNA (that roughly corresponds to the RNA transcribed from the spacer DNA in bacteria) which is assembled in order to contain a sequence homologous to the one in the correct place in the target genome.
The first approach of this technology that was used to mutate the DNA of living cells is based on the non-homologous end joining mechanism (NHEJ) (Lieber, 2010), which exploits the natural repair mechanism that is most active in the cells. At its core, in NHEJ the broken ends can be ligated without a homologous template and it is susceptible to frequent mutation errors due to nucleotide insertions and/or deletions (indels). The second approach that could be used is instead the homologous directed repair (HDR) (Heyer et al., 2010; Gratz et al., 2014). In this case the repair of the broken DNA strands will occur in a more precise fashion thanks to the presence of a homologous template. It is important to mention that in most cells, both of these repair pathways are active, however the HDR pathway is generally less efficient that the NHEJ pathway in the absence of a homologous template (Iliakis et al., 2004).
1.2.1 HDR in flies
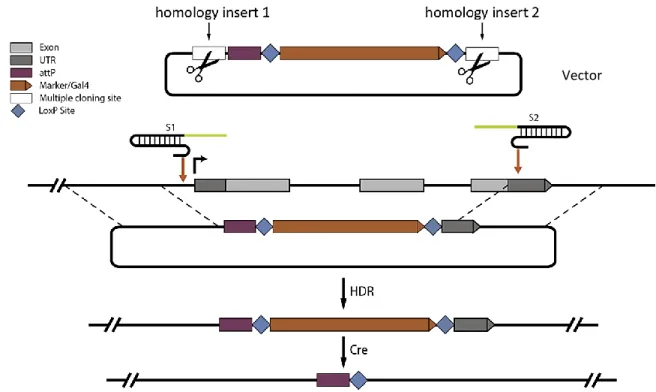
The previously mentioned HDR technique, being the more versatile and precise one, has now been widely used and optimized for the fruit fly. The strong point of this system is that it employs homologous DNA sequences as templates for precise repair, allowing the precise incorporation of exogenous DNA fragments (e.g. Gal4, the driver component from the UAS/Gal4 system, Duffy, 2002), including visual markers to aid during the screening (Gratz et al., 2014). It roughly consists in the creation of a vector incorporating the two homology inserts and the screenable marker (e.g. the fluorescent 3xP3-DsRed (Horn and Handler, 2005)), (Fig. 1.1) flanked by LoxP sites, plus the creation
9 | P a g e of the vector(s) containing the sequence for the gRNA(s). The constructs will be subsequently injected into fly embryos which express Cas9 in the germline under the regulatory control of vasa (Kondo and Ueda, 2013;Bassett and Liu, 2014). Ultimately, this cassette could be easily accessed at a later time thanks to the presence of the LoxP sites in order to eliminate the visible marker (CRE-mediated removal).
To sum up, this technique can be used to precisely modify DNA by the insertion of exogenous sequences in the gene of interest thanks to homologous repair. It is important to mention that the results will change depending on using one or two gRNA: using one single gRNA will result in the clean insertion of DNA, while using two gRNA, besides the insertion of the DNA (e.g. the visible marker), will result in the deletion of part of the gene sequence.
Fig. 1.1: CRISPR/Cas9 HDR. Graphic explanation of an example of the CRISPR/Cas9 HDR technique. Here we firstly see the vector with the two homology domains, subsequently, we see the gRNAs (S1 and S2) that will guide the Cas9 in the correct place in the genome where the cut will be performed. Thanks to the presence of the homologous template (the homology inserts in the vector) the repair of the broken DNA will be specific and DNA fragments will be exchanged. It will be possible to access the cassette again later and remove the visible marker, if required, thanks to a CRE-mediated cut in the LoxP sites. Modified from Gratz et al., 2014.
Vector
10 | P a g e 1.2.2 tRNA-based vectors
Another CRISPR/Cas9 technique that has been particularly useful to modify target DNAs is based on the production of multiple gRNAs starting from a single construct (Xie et al., 2015; Port and Bullock, 2016). In this technique are used plasmids (vectors) that are inspired by a tRNA-gRNA expression system in which the endogenous tRNA processing machinery liberates multiple functional gRNAs from a single precursor transcript in the nucleus. Once the gRNAs are processed and freed from the neighboring tRNAs, they will recognize the right sequences in the host genome and, in the presence of a Cas9, the cut will be performed. Where there are multiple gRNAs, multiple cuts will occur, likely producing frameshifts, and the gene will be mutated.
When the cloned plasmid is injected in a recombinant fly embryo containing an integrase and attP sites, it will integrate in the genome thanks to the attB sites found in the plasmid itself. Ultimately, it is important to mention that if tRNA-gRNA sequences are under the expression of a UAS promoter (the effector component from the UAS/Gal4 system), what it is obtained is a conditional line, where the KO can be induced at a chosen time or place, just by the election of the appropriate driver line.
Fig. 1.2: CRISPR/Cas9 tRNA-based vectors technique. Schematic representation of part of the vector used for the CRISPR/Cas9 tRNA-based vectors technique: a chosen number of tRNAs and gRNAs sequence are found behind a UAS promoter. The tRNA processing machinery (RNases) liberates multiple functional gRNAs from a single precursor transcript, which are going to collaborate with the Cas9 in order to mutate the genome. Modified from Port and Bullock 2016.
1.3 The Fox genes
The family of Fox genes groups a large number of transcription factors that share a common sequence-specific DNA binding domain: the forkhead domain. It is an evolutionary ancient family of genes and the first member was discovered in Drosophila
UAS
11 | P a g e (Weigel et al., 1989), in which, when mutated, gives the insect the typical fork-head appearance.
In eukaryotes, the forkhead domain has been identified in organisms starting from unicellular to fungi and finally animals, but not in plants (Hannenhalli and Kaestner 2009;
Shimeld et al., 2009). There are 50 FOX genes in the human genome, around 44 in the mouse genome and 18 in Drosophila, which, up till now, have been classified and divided in 19 subfamilies (from FoxA to FoxS). It has been shown that they serve a wide range of functions, spanning from the regulation of glucose homeostasis (FoxO), to chromatin remodeling (FoxA) and vocal learning (FoxP) (Jackson et al., 2010). This latter subfamily of the Fox genes has grown in relevance in the last 20 years because of its important role for speech acquisition in humans.
1.3.1 FoxP in vertebrates
The FoxP subfamily has a distinguishing feature: besides the forkhead domain, it possesses another conserved domain called leucine zipper, which allows the components of the subfamily to form homodimers and heterodimers. The possibility to form heterodimers is due to the fact that in vertebrates there are 4 FoxP paralogues: FoxP1-4 (Takahashi et al., 2009; Song et al., 2012; Bacon and Rappold, 2012). The presence of 4 members is likely due to the occurrence of three duplication events after the evolutional split of vertebrates from invertebrates (Santos et al., 2011) (Fig. 1.3). Each of the different paralogues is expressed in different tissues and serves different functions, coordinating important developmental processes within various organs (Golson and Kaestner, 2016): FoxP1 regulates the development of lungs, heart, brain and gut (Wang et al., 2004; Shu et al., 2007; Horn et al., 2010), FoxP2 is widely expressed in the nervous tissue and, in humans and birds, is associated to vocal learning (Chabout et al., 2016; Schatton and Scharf, 2016;
Reuter et al., 2017; French et al., 2019; Co et al., 2020), FoxP3 regulates T-cell specification and is important in the immune system (Fontenot et al., 2003), while FoxP4 is expressed during the development of lungs and gut (Lu et al., 2002).
FoxP1 and FoxP2 in particular, have been studied extensively in birds and mammals (especially humans) because of their linkage to neurodevelopmental disorder,
12 | P a g e including autism spectrum disorder (ASD), intellectual disability (ID) and speech and language disorders.
Deletions or mutations (the vast majority of them in the DNA binding domain) of the FoxP1 paralogue in humans lead to a neurodevelopmental disorder named FOXP1 syndrome (Siper at al., 2017). People affected by this disease present a broad spectrum of symptoms like language impairment, ASD, ID and complex psychiatric presentations characterized by anxiety, obsessive-compulsive traits, and attention deficits (Horn et al., 2010; Palumbo et al., 2013; Siper at al., 2017; Meerschaut et al., 2017).
Mutations of FoxP2 lead instead to more selective deficits if compared to the ones caused by its close paralog FoxP1, most of them in the sphere of language acquisition. It was the first gene discovered to be involved in this kind of disability after the recognition of an autosomal point mutation in a multigenerational family (“KE” family) exactly in the fork head domain, which impairs the ability of the protein to bind DNA (Lai et al., 2001).
The people affected by this monogenic disease present apraxia of speech and orofacial dyspraxia, and the areas of the brain that seems to be affected by FOXP2 mutations are cortex, cerebellum and the basal ganglia (Chabout et al., 2016; Schatton and Scharff, 2016;
Reuter et al., 2017; French et al., 2019; Co et al., 2020).
Due to the human relevance, FoxP2 has been greatly studied in numerous model organisms, for example in mice, where it was analyzed in the cortex, striatum and cerebellum (den Hoed and Fisher, 2020). However, even though mice are more closely related to human, the greatest efforts for the study of FoxP2 have been done in birds (zebra finches), because of the parallelisms between the circuitries encoding birdsong and human speech (Doupe and Kuhl, 1999). In this species of birds, similar to human imitative learning, the song is learned by mimicking of conspecific, and young males learn the songs from an adult male tutor. This behavior relies on a set of brain nuclei collectively known as the song control circuit (Heston and White, 2015). The neural expression patterns of FoxP2 are conserved between humans and songbirds (Enard, 2011; Heston and White, 2015), including expression in the basal ganglia. In zebra finches in particular, FoxP2 is enriched in Area X, which is the song-dedicated basal ganglia nucleus necessary for vocal learning (Haesler et al., 2004; Haesler et al., 2007). The knockdown of FoxP2 in Area X of juvenile
13 | P a g e males leads to inaccurate song learning, indicating that adequate FoxP2 levels are necessary for normal vocal learning (Haesler et al., 2004; Haesler et al., 2007; Kosubek-Langer and Scharff 2020).
This kind of vocal learning, that proceeds slowly from babbling in toddlers (or subsong in zebra finches) towards fluent speech in adults (or crystallized song in zebra finches), is a kind of motor learning that can be conceptualized as operant self-learning (counterposed to operant world-learning), in which the organism learns the correct actions to perform only by evaluating the outcomes of its previous behavior, in the absence of other sensory cues (Skinner, 1938; Skinner, 1963; Brembs, 1996; Brembs and Heisenberg, 2000;
Brembs and Heisenberg, 2001).
1.3.2 FoxP in Drosophila
As previously stated, the original forkhead (fkh) gene was identified in the fruit fly Drosophila melanogaster (Weigel et al., 1989), where mutations cause defects in head fold involution during embryogenesis, causing the characteristic “fork head”. In contrast to chordates with four FoxP family members, only one orthologue of the FoxP subfamily is present in flies (dFoxP), which originates three different transcripts by alternative splicing (Castells-Nobau et al., 2019; Mendoza et al., 2014; Santos et al., 2011): FoxP-isoform A (FoxP-iA), FoxP-isoform B (FoxP-iB) and FoxP-isoform IR (Intron Retention; FoxP-iIR) (Fig. 3.1A). Comparison of the protein sequences of the forkhead domain of dFoxP and murine FoxP1-4 orthologues reveal a high degree of conservation, with an overall of 62 % amino acids identity (Santos et al., 2011). The only paralogue in mice that conserve the alternative splicing is FoxP1 which, therefore, is the most closely related to the invertebrate FoxP, at least at the gene structure level (Fig. 1.3).
Analogous to vocal learning, data suggest that FoxP in Drosophila is involved in the same kind of learning of another orthologue: FoxP2. Operant self-learning of yaw torque (attempted rotations around the vertical body axis) in tethered flies is conceptually analogous to vocal learning: flies tethered at a torque meter first initiate variable exploratory actions followed by a reduction in behavioral variability as a result of sensory feedback (Guo et al., 1996; Ernst and Heisenberg, 1999; Brembs and Heisenberg, 2000;
Brembs and Heisenberg, 2001; Brembs and Wiener, 2006). Thus, also in flies, alterations
14 | P a g e of the dFoxP gene cause deficits in operant self-learning. Furthermore, data suggest that FoxP-iB, in particular, may be specifically important for operant self-learning (Mendoza et al., 2014).
However, besides the studies performed on operant self-learning, there are still contradicting evidences on where dFoxP is expressed and in which circuitries it participates (DasGupta et al., 2014; Lawton et al., 2014; Groschner et al., 2018; Castells-Nobau et al., 2019).
1.4 Aim of the study
The currently available reports as to the expression pattern of the FoxP gene have been contradictory (DasGupta et al., 2014; Lawton et al., 2014; Groschner et al., 2018;
Castells-Nobau et al., 2019) and nothing is known as to whether the different isoforms are differentially expressed in different cell types, as well as the role that they play in each of the nervous system areas. Furthermore, the tools that have been developed so far to study this gene have demonstrated to be obsolete and contradicting, thus leading to potential misconceptions.
Fig. 1.3: Main events of FoxP gene structure evolution in the animal reign. In the diagram on the left he three arrows shows the duplication events. In the diagram on the right are shown the form of alternative splicing.
Only the 6th and the 7th – 8th exons are shown.
Modified from Santos et al., 2011.
15 | P a g e In order to shed some light on this gene, in this work we exploit state of the art CRISPR/Cas9 techniques to specifically target the different isoforms of dFoxP directly in the gene locus, firstly to see their expression pattern, and subsequently to understand their involvement in motor behavior. We find out that different isoforms of dFoxP are differentially expressed in various cell types and neuropils of the fly brain (and ventral nerve cord), but not in the mushroom bodies, and, furthermore, we demonstrate that dFoxP is required for normal locomotion and object fixation, especially during development.
16 | P a g e
2. Materials and methods
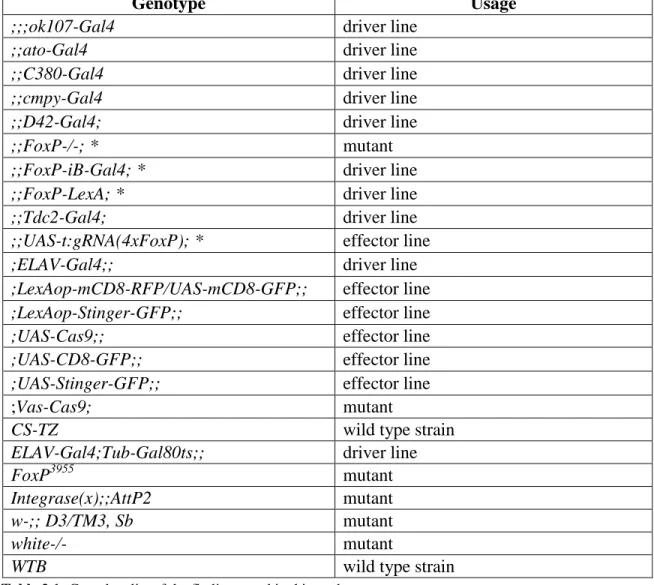
2.1 Fly strains
Fly stocks were reared on standard food (Agar 0.8 %, sugar molasses 2.2 %, malt extract 8 %, yeast 1.8 %, soy flour 1 %, corn flour 8 %, Nipagin 0.3 %) and maintained at 18 °C (Table 1). Before experimental use, flies were kept at 25 °C, in a 12/12 hours light/dark regime at 60 % relative humidity for at least one generation. All crosses were raised at 25 °C (except for the ones involving the temperature sensitive Gal4 inhibitor Tub- Gal80ts (McGuire et al., 2003; 2004) that were raised at 18 °C) using 4-6 females and 2-4 males. For expression pattern visualizations, the FoxP-iB-Gal4 and FoxP-LexA driver line, respectively, were crossed with the appropriate effector lines containing different GFP or RFP variants (Table 2.1). For behavioral analysis involving the UAS-t:gRNA(4xFoxP) effector line we crossed it first with UAS-Cas9, and subsequently with the appropriate driver line for each experiment (ELAV-Gal4, D42-Gal4, C380-Gal4, cmpy-Gal4, ato-Gal and ELAV-Gal4;Tub-Gal80ts). For conditional knock-out experiments, two genetic constructs need to be brought together for the method to work. The endonuclease Cas9 needs to be present as well as the guide RNA to provide a target for the nuclease. Hence, the appropriate control groups express only one component of the CRISPR/Cas9 combination. One line drives expression only of the Cas9 endonuclease (i.e., xxx- Gal4>UAS-Cas9, without gRNAs) and the other drives expression only of the gRNAs (i.e., xxx-Gal4>UAS-t:gRNA(4xFoxP) without Cas9). In this fashion, each strain not only controls for potential insertion effects of the transgenes used, but also for potential detrimental effects of expressing the components alone, irrespective of the excision of the target gene. For the behavioral analysis involving the FoxP-KO mutant and the FoxP-iB- Gal4 driver line we performed a backcrossing with a WTB strain in order to get the same genetic background as the WTB control.
2.2 In-silico sequences alignment
The transcript and protein sequences of the different FoxP isoforms were downloaded from https://flybase.org and aligned with Clustal Omega for multiple sequence
17 | P a g e alignment. The protein domains were analyzed with the NCBI Conserved Domain Search tool, and the stop codons were identified with ExPASy Translate tool (Fig. 3.1A).
2.3 Transgenic flies generation
We used CRISPR/Cas9 Homology Directed Repair (HDR) to edit the FoxP locus (Gratz et al., 2014) and generated t-RNA based vectors for producing multiple clustered regularly-interspaced (CRISPR) gRNAs from a single transcript (Port et al., 2016). We created a total of two driver lines (FoxP-iB-Gal4 and FoxP-LexA), one mutant line (FoxP- KO) and one effector line (UAS-t:gRNA(4xFoxP)). For the first 3 fly lines, that were created with the HDR technique (Gratz et al., 2014), we followed a protocol of PCR- amplification (Table 2.2) of the homology insert from genomic DNA of Vas/Cas9 flies (10
l Phusion buffer (Table 2.3), 0.5 l Phusion polymerase, 1 l dNTPs, 2.5 l fw primer, 2.5 l rv primer, 1 l template DNA, to 50 l sterile H₂O), the amplicons were run on Agarose (0.8 %) gel to have a size dependent electrophoretic separation where the electrophoresis was performed at 120 V. Subsequent extraction of the bands from Agarose gel was performed following the E.Z.N.A. Gel Extraction Kit from VWR/Omega (Table 2.3), restriction enzyme digestion of both the inserts and the vector (5 l Cutsmart buffer, 1
l restriction enz.1, 1 l restriction enz.2, all from New England BioLabs (Table 2.3), 5 l vector or 25 l insert, to 50 l sterile H₂O) was then performed and left overnight in a water bath at 37 C. Next, after the restriction reaction, we again performed the gel extraction procedure. The subsequent ligation reaction was carried out for 1 night at 18 C, with a vector amount of 50 ng and with a vector to insert ratio of 1 to 3 that is usually used for cohesive end ligations (50 ng vector, X ng insert, 1 l T4 Ligation buffer and 1 l T4 DNA ligase from Thermo Fisher Scientific (Table 2.3), to 10 l sterile H₂O). Subsequently, we performed the heatshock transformation using competent DH5-E. coli which were finally plated on a petri dish and put overnight at 37 C. As a control we performed the same ligation procedure and heatshock transformation with the same vector which however had no insert to incorporate. The subsequent day a colony PCR (Table 2.4) was performed in order to find clones which had incorporated the ligated plasmid: 20 single colonies were
18 | P a g e chosen randomly from the petri dish with sterile pipette tip and each one was rinsed in its PCR reaction cup and then put into a test tube with 3 ml of LB amp selection medium (2 l LSB buffer, 1 l Taq polymerase (Table 2.3), 1 l dNTPs, 1 l fw primer, 1 l rv primer, to 20 l sterile H₂O). The clones that resulted positive in the PCR were let grow on a shaker overnight at 37 C and then midiprepped following the Qiafilter Midi-Kit from QIAGEN protocol (Table 2.3). This procedure was then performed a second time in order to incorporate the second homology insert into the vector. Finally, we created the vector containing the gRNAs following a similar procedure: digestion of the appropriate vector (15 l vector, 2 l NEB 2.1 buffer and 1 l restriction enz. from New England BioLabs (Table 2.3), to 20 l sterile H₂O) and annealing of the oligos (1 l oligo 1, 1 l oligo 2, 1 l T4 Ligase buffer, 1 l T4 polynucleotide kinase from New England BioLabs (Table 2.3), to 10 l H₂O), gel extraction, ligation, heatshock transformation, colony PCR and midiprep as previously explained. All constructs were verified via the Sanger sequencing LightRun Tube of Eurofins Genomics: the DNA was diluted to a suitable concentration in 7.5 µl and 2.5 µl of M13 primer (fw or rv) were added (10 µM). Here follow the specifics for each different line that we cloned:
FoxP-iB-Gal4: To create an isoform-specific driver line, we inserted a Gal4 sequence into exon 8, which is specific to isoform B. Two 1 kb homology fragments were
PCR-amplified (primers Hom1: fw 5’-
GGGGGCGGCCGCCGTGGAAGGTAAAATGCCCCATATATG-3’, rv 5’-
GGGGCCGCGGCCCTCGTGTAAGGAAAGGTTCGTACGAATCGC-3’; primers Hom2:
fw 5’-GGGGGGCGCGCCACAAGTGCTTTGTACGTTATGAA-3’, rv 5’-
GGGGGGTACCGGTCACTGAGTATCGTTAATGATC-3’) and digested with the appropriate restriction enzymes (Hom1: NotI and SacII, Hom2: AscI and KpnI) to be ligated in the pT-GEM(0) (Addgene plasmid # 62891; RRID: Addgene_62891) vector (Diao et al., 2015) which contained a Gal4 sequence and a 3xP3-DsRed-SV40 sequence for selection of transformants. The gRNA sequences used are: sense 5’-
CTTCGACGTACAAAGCACTTGTGTA-3’, and asense 5’-
AAACTACACAAGTGCTTTGTACGTC-3’. They were annealed and cloned inside a pU6-gRNA (Addgene plasmid # 53062; RRID:Addgene_53062) vector (Shan et al., 2013), previously digested with BbsI restriction enzyme.
19 | P a g e FoxP-LexA: To create a driver line that reflects expression of all FoxP isoforms, we inserted a LexA sequence into exon 3. Two 1 kb homology fragments were PCR-amplified (primers Hom1: fw 5’-GGGGGCGGCCGCCAGGAATGGCGGCATATGAGT-3’, rv 5’- GGGGCCGCGGCCCTCTATTACGGTAAGCGGACTCCGG-3’; primers Hom2: fw 5’-
GGCCGGTACCATAGCATAGGCCGACCCATC-3’, rv 5’-
GGCCACTAGTTCACATTCTCAACCCGCATAAAGC-3’) and digested with the appropriate restriction enzymes (Hom1: NotI and SacII, Hom2: KpnI and SpeI) to be ligated in the pT-GEM(0) vector which contained a LexA sequence and a 3xP3-DsRed- SV40 sequence for selection of transformants. The gRNA sequences used are: sense 5’-
CTTCGGGTCGGCCTATGCTATTTA-3’, asense 5’-
AAACTAAATAGCATAGGCCGACCC-3’. They were annealed and cloned inside a pU6- gRNA vector previously digested with BbsI restriction enzyme.
FoxP-KO: To prevent expression of any isoform of the FoxP gene, we removed part of exon 1, the complete exon 2 and part of exon 3. Two 1 kb homology fragments were
PCR-amplified (primers Hom1: fw 5’-
GGGGCTAGCCAAAATAAGATGTGTCTGGTTTCCTTG-3’, rv 5’-
GGGCCGCGGGCATGGCGAACTCATCGTG-3’, primers Hom2: fw 5’-
GGGGACTAGTAGAGGGAAAGTTTTGCCGG-3’, rv 5’-
GGGGCTGCAGTATGAAGGGACAGATTGTGCCGG-3’) and digested with the appropriate restriction enzymes (Hom1: NheI and SacII, Hom2: SpeI and PstI) to be ligated in the pHD-DsRed-attP (Addgene plasmid # 51019; RRID: Addgene_51019) vector which contains a 3xP3-DsRed sequence for selection of transformants. The gRNA sequences used are: gRNA1 sense 5’-CTTCGCGGATGATAGTACTTCCGCA-3’, asense
5’-AAACTGCGGAAGTACTATCATCCGC-3’; gRNA2 sense 5’-
CTTCGAAGGACGTGCCCGGAAGAGA-3’, asense 5’-
AAACTCTCTTCCGGGCACGTCCTTC-3’. They were annealed and were cloned inside a pU6-gRNA vector previously digested with BbsI restriction enzyme.
For the creation of the last fly line, we followed a different cloning strategy based on Port et al., 2016. Selected oligos which allowed cloning 4 gRNAs from 3 overlapping PCR products, were PCR amplified (Table 2.2) with the vector backbone as a template (previously digested with the appropriate restriction enzyme as previously described) (10 l
20 | P a g e Q5 polymarease buffer, 0.5 l Q5 polymerase (Table 2.3), 1 l dNTPs, 2.5 l fw primer, 2.5 l rv primer, 1 ng vector DNA, to 50 l sterile H₂O). Subsequently, an electrophoresis run and a gel extraction protocol, as previously described, were performed. Next, we performed a Gibson Assembly reaction (50 ng of digested plasmid, 2 fold molar excess of each insert, 10 l NEBuilder HiFi DNA Assembly Master Mix from New England BioLabs (Table 2.3), to 20 l sterile H₂O) which consists in the cloning of the oligos in a linearized plasmid (restriction enzyme digestion as previously explained) for 60 minutes at 50 °C. The following steps of the cloning are equivalent the ones explained previously. Here follow the specifics for this cloning procedure:
UAS-t:gRNA(4xFoxP): To create a UAS isoform-unspecific conditional effector line we phosphorylated and annealed 3 sets of oligos (1. fw 5’- CGGCCCGGGTTCGATTCCCGGCCGATGCAGAGCATCGATGAATCCTCAAGTTTC
AGAGCTATGCTGGAAAC-3’, rv 5’-
GCTCGGATATGAACTCGGGCTGCACCAGCCGGGAATCGAACC-3’; 2. fw 5’-
GCCCGAGTTCATATCCGAGCGTTTCAGAGCTATGCTGGAAAC-3’, rv 5’-
ACGGCATATGCCATGAGCAATGCACCAGCCGGGAATCGAACC-3’; 3. fw 5’-
TTGCTCATGGCATATGCCGTGTTTCAGAGCTATGCTGGAAAC-3’, rv 5’-
ATTTTAACTTGCTATTTCTAGCTCTAAAACAACCATGTTCCGTATTCAGATGCAC CAGCCGGGAATCGAACC-3’) that were cloned with a single Gibson Assembly reaction in a pCFD6 (Addgene plasmid # 73915; RRID: Addgene_73915) vector (Port and Bullock, 2016) which was previously digested with BbsI restriction enzyme.
After the constructs were created, they were eluted in Ampuwa® water, diluted to the needed concentration and supplemented with a suitable amount of Injection Buffer (10x; KCl 5 mM, NaPO4 (pH 6.8) 0.1 mM) to be injected into dechorionated early embryos (30-45 min old) (;Vas-Cas9; for the FoxP-iB-Gal4, FoxP-LexA and FoxP-KO and Integrase(x);;AttP2 for UAS-t:gRNA(4xFoxP)). The resulting transformants were selected and crossed two times with the balanced flies w-;;D3/TM3, Sb.
2.4 Immunohistochemistry
21 | P a g e Three to six days-old adults were fixated in 4 % paraformaldehyde (PFA) at 4 °C for 2 hrs (30 minutes for the staining involving the FoxP antibody) and dissected in phosphate-buffered saline with 0.01 % Triton X-100® detergent (PBST). For larval staining, 3rd instar larvae were selected, dissected in 0.01 % PBST and fixated in 4 % PFA at room temperature (RT) for 30 min. Clean brains were washed 3 times in 0.01 % PBST for a total time of 45 min and then blocked with 10 % normal goat serum (NGS) for 1 hr.
Subsequently, the brains were incubated with the appropriate primary antibody for 1-2 nights at 4 °C (Table 2.5). After 3 washing steps of 15 min each, the brains were incubated with the secondary antibody (Table 2.6) for 5-7 hrs at RT. After an additional 15 min washing step, the brains were placed on glass microscope slides and mounted with the antifade mounting medium Vectashield (Vector Laboratories, Burlingame, CA).
2.5 Image acquisition and analysis
All of the images were acquired with a Leica SP8 confocal microscope (RRID:
SCR_018169), images were scanned at a frame size of 1024x1024 pixels at 200 or 100 Hz.
The objectives were 20x dry and 20x/40x/60x oil immersion. Images were processed with ImageJ software (National Institutes of Health, USA) (RRID: SCR_003070) (Rueden et al., 2017), only general adjustments to color, contrast, and brightness were made. The cell counting was performed with IMARIS 9.0 (Oxford instruments) software on UAS-Stinger- GFP stacks, using the Spots tool for spots counting. For the FoxP-iB-Gal4/FoxP-LexA count (Fig. 3.5B), five brains were counted for each genotype at both larval (3rd instar) and adult (3 days old) stages. The colocalization analysis was performed with the ImageJ Colocalization Threshold tool (Tony Collins and Daniel James White) (Fig 3.6B).
2.6 RT-qPCR
The knockout efficiency was assessed using RT-qPCR (see Figs. 3.1D, 3.5E). We extracted RNA from 20 flies for each genotype (white -, heterozygous mutant and homozygous mutant, both backcrossed to white -) (Table 2.1), following a protocol from peqGOLD TriFast of VWR (Table 2.3). The RNA was subsequently transcribed into cDNA
22 | P a g e followingthe OneStep RT-PCR Kit from QIAGEN (Table 2.3) (1 μl gDNA wipe out buffer 7x, 500 ng of template RNA, to 7 μl H2O; followed by the addition, after the pause of the PCR thermocycler program, of 2 μl Quantiscript RT buffer 5x, 0.5 μl Quantiscript reverse transcriptase, 0.5 μl Oligo(dT) primer); the thermocycler program used was: 42 °C for 2 minutes, 4 °C pause to add the reverse transcriptase mix as explained before, and manual restart at 42 °C for 30 minutes, 95 °C for 3 minutes and finally 10 °C ∞. Subsequently, we performed the qPCR . Primer sequences were identical to those used by (Mendoza et al., 2014). For the qPCR reaction we used a Bio-Rad CFX Connect Real-Time PCR Detection System thermocycler and the Bio-Rad CFX manager software to store and analyze the data.
Every sample was run in triplicate in a 96-well plate in a total volume of 10 μl. The mixture contained 5 μl sybrGreen master mix ORA™ qPCR Green ROX H Mix, 2X, from highQu;
Table 2.3), 0.5 μl from each primer, 1 μl of 1:10 diluted cDNA and 3 μl sterile H₂O. As reference, we used the housekeeping gene rp49 (ribosomal protein 49), while as a negative control we used the same reaction mix without cDNA. The qPCR thermocycler program used is listed in Table 2.7. The experiments were repeated 2 to 4 times.
2.7 Behavior
All behavioral experiments were performed in Buridan’s paradigm (RRID:
SCR_006331). In this experiment, we analyzed both temporal components of walking behavior (often subsumed under ‘general locomotion’) and spatial components such as fixation of landmarks or the straightness of the walking trajectory. Buridan’s paradigm (Fig. 7A) consists of a round platform with a diameter of 117 mm which is surrounded by a water-filled moat. The platform is situated at the bottom of a uniformly illuminated white cylinder, 313 mm in height and 293 mm in diameter (Colomb et al., 2012). Two black stripes are placed on the inside of the cylinder, opposite to each other, serving as the only visual cues for the flies. Two days-old female flies were collected and their wings were clipped under CO₂ anesthesia. After one night recovery at 25 °C they were tested in Buridan’s paradigm for 15 minutes (doi.org/10.17504/protocols.io.c7vzn5). The position of the fly is recorded by a camera (Logitech Quickcam Pro 9000) connected to a computer running our BuriTrack software (http://buridan.sourceforge.net). The analysis software
23 | P a g e CeTrAn (Colomb et al., 2012) (https://github.com/jcolomb/CeTrAn/tree/master/CeTrAn) extracts a variety of parameters from the sored trajectories. From the parameters extracted by CeTrAn, we used the temporal parameters median speed, distance travelled, number of walks and activitytime and the spatial parameters stripe deviation and meander. It furthermore traces occupancy plots. Around 10 to 20 flies were analyzed per genotype. For the experiment involving Tub-Gal80ts (Fig. 3.13C-F), flies were raised at 18 °C, moved to 30 °C for 12 hrs (embryos) or 48 hrs (pupae and adults) and subsequently left at 25 °C for the rest of the development (embryos and pupae) or overnight for recovery (adults) before testing.
2.8 Statistical analysis
All graphs were created and statistical analysis was performed using GraphPad Prism 6 (GraphPad Software, Inc., California, USA) (RRID: SCR_002798) software. The variances were compared with an F-test: where the variances were considered equal we used a Student’s t-test (two-tailed) or one way ANOVA followed by Tukey's post hoc test, where they were instead considered significantly different (p<0.005) we used a Mann- Whitney U-test or a Kruskal-Wallis followed by Dunn's post hoc test. The initial behavioral experiments (Fig. 3.8) were carried out with a sample size which, from experience, would be sufficient to detect medium to large effects, i.e., N~20. We then used these results to perform a power analysis for the subsequent experiments. We found that effect sizes such as those exhibited in the speed, meander or stripe fixation parameters required a sample size of up to 18 to reach 80 % statistical power at an alpha of 0.5 % (Benjamin et al., 2018), while effects such as those in the activity time parameter would require up to 100 flies. We corroborated these analyses with Bayesian analyses, where the activity time parameter yielded a Bayes factor of below one, while the other effects yielded Bayes factor values beyond 100. Therefore, we set the target sample size for all subsequent Buridan experiments to 18 and p<0.005 was considered significant. Data are expressed as averages
± SEM or averages ± SD and each case is indicated in the legend of each figure.
24 | P a g e Step Temperature Time Nr. of Cycles
Denaturation 98 °C 30 s
Denaturation 98 °C 10 s
Annealing 60 or 65 °C 30 s
Elongation 72 °C 60 s GoTo step 2 x 30
Elongation 72 °C 2 min
Storage 10 °C ∞
Genotype Usage
;;;ok107-Gal4 driver line
;;ato-Gal4 driver line
;;C380-Gal4 driver line
;;cmpy-Gal4 driver line
;;D42-Gal4; driver line
;;FoxP-/-; * mutant
;;FoxP-iB-Gal4; * driver line
;;FoxP-LexA; * driver line
;;Tdc2-Gal4; driver line
;;UAS-t:gRNA(4xFoxP); * effector line
;ELAV-Gal4;; driver line
;LexAop-mCD8-RFP/UAS-mCD8-GFP;; effector line
;LexAop-Stinger-GFP;; effector line
;UAS-Cas9;; effector line
;UAS-CD8-GFP;; effector line
;UAS-Stinger-GFP;; effector line
;Vas-Cas9; mutant
CS-TZ wild type strain
ELAV-Gal4;Tub-Gal80ts;; driver line
FoxP3955 mutant
Integrase(x);;AttP2 mutant
w-;; D3/TM3, Sb mutant
white-/- mutant
WTB wild type strain
Table 2.1: Complete list of the fly lines used in this study
Table 2.2: PCR program for Phusion and Q5-HF polymerases
25 | P a g e
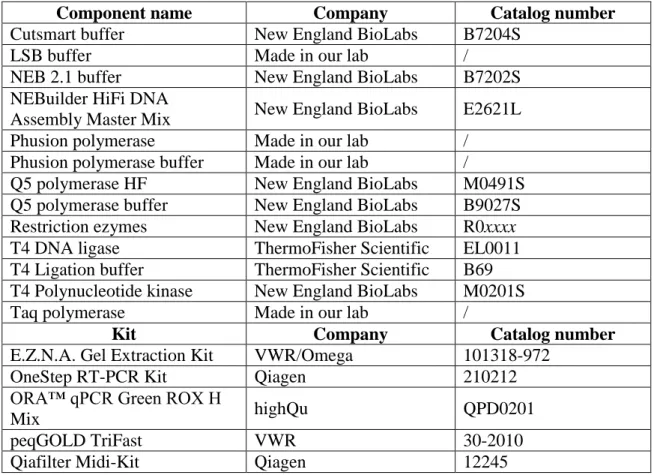
Component name Company Catalog number
Cutsmart buffer New England BioLabs B7204S
LSB buffer Made in our lab /
NEB 2.1 buffer New England BioLabs B7202S
NEBuilder HiFi DNA
Assembly Master Mix New England BioLabs E2621L
Phusion polymerase Made in our lab /
Phusion polymerase buffer Made in our lab /
Q5 polymerase HF New England BioLabs M0491S
Q5 polymerase buffer New England BioLabs B9027S Restriction ezymes New England BioLabs R0xxxx
T4 DNA ligase ThermoFisher Scientific EL0011
T4 Ligation buffer ThermoFisher Scientific B69 T4 Polynucleotide kinase New England BioLabs M0201S
Taq polymerase Made in our lab /
Kit Company Catalog number
E.Z.N.A. Gel Extraction Kit VWR/Omega 101318-972
OneStep RT-PCR Kit Qiagen 210212
ORA™ qPCR Green ROX H
Mix highQu QPD0201
peqGOLD TriFast VWR 30-2010
Qiafilter Midi-Kit Qiagen 12245
Step Temperature Time Nr. of Cycles
Denaturation 95 °C 5 min
Denaturation 95 °C 25 s
Annealing 50 or 60 °C 30 s
Elongation 72 °C 60 s GoTo step 2 x35
Elongation 72 °C 10 min
Storage 10 °C ∞
Table 2.3: Complete list of the components and kits used in this study
Table 2.4: Colony PCR program for Taq polymerase
Antigen Host Dilution Incubation Source RRID Chaoptin-
11 mouse 1:500 1 night
Developmental Studies
Hybridoma Bank
AB_528161
ChAT mouse 1:250 1 night DSHB AB_528122
ELAV rat 1:100 1 night DSHB AB_528218
FoxP guinea
pig 1:200 2 nights Lawton et al.,
2014 /
GABA rabbit 1:250 2 nights GeneTex AB_2037030
nc82 mouse 1:500 1 night DSHB AB_2314866
p-SMAD1/5 mouse 1:250 2 nights Cell Signaling AB_491015
26 | P a g e Technology
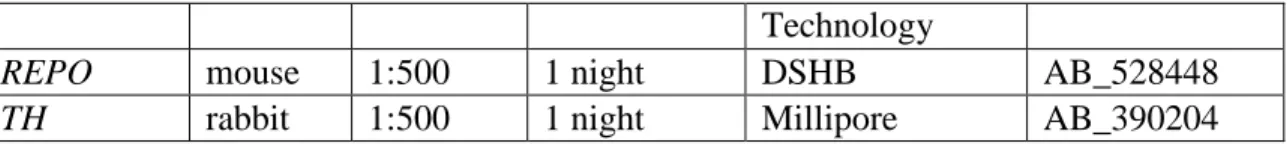
REPO mouse 1:500 1 night DSHB AB_528448
TH rabbit 1:500 1 night Millipore AB_390204
Table 2.5: Complete list of the primary antibodies used in this study
Table 2.7: qPCR program
Table 2.6: Complete list of the secondary antibodies used in this study
Antigen Host Dilution Incubation Source RRID Alexa-Fluor-
Anti-mouse 555 goat 1:250 5 hours ThermoFisher
Scientific AB_2535844 Alexa-Fluor-
Anti-rabbit 555 goat 1:250 5 hours ThermoFisher
Scientific AB_2535849 Alexa-Fluor-
Anti-rat 555 goat 1:250 5 hours ThermoFisher
Scientific AB_2535855 Anti-guinea pig
Cy™3 goat 1:200 7 hours Jackson
ImmunoResearch AB_2337423
Step Temperature Time Nr. of Cycles
Denaturation 95 °C 2 min
Denaturation 95 °C 10 s
Annealing 60 °C 10 s
Elongation, measurement 65 °C 30 s GoTo step 2 x39
Denaturation 95 °C 10 s
Melting curve, measurement 65 °C – 95 °C + 0.5 °C / 5s
27 | P a g e
3. Results
All raw data are publicly accessible with an Attribution 4.0 International (CC BY 4.0) license at https://figshare.com.
On the following results we based a Research Paper soon to be available on Open Biology (https://royalsocietypublishing.org/journal/rsob).
3.1 FoxP-isoB expression in the Drosophila brain
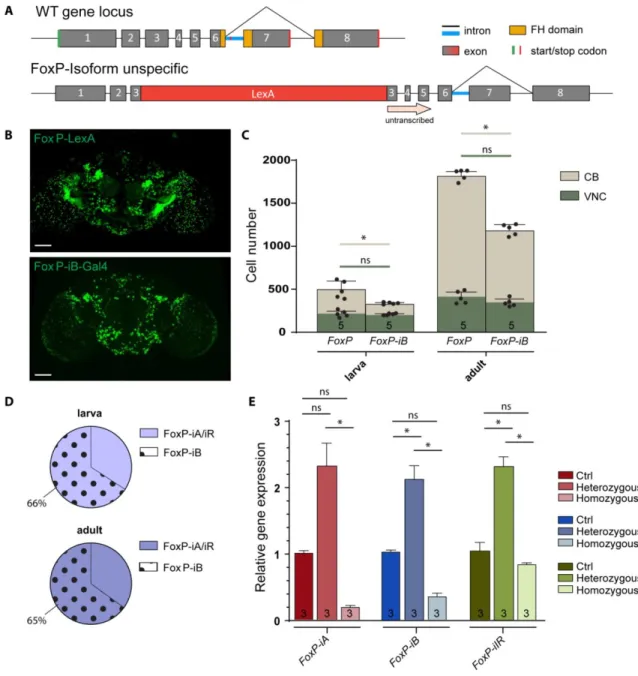
The WT FoxP gene is a transcription factor that binds the DNA thanks to FH domain (Fig. 3.1A, yellow boxes); the gene is built by 7 introns and 8 exons (1-8), and the DNA binding domain lies in exon 6, exon 7 and exon 8. Those last two exons are subjected to alternative splicing to originate different protein isoforms: an isoform A (iA) which results from the coupling of exon 6 with exon 7, an isoform B (iB) which instead carries exon 8, and an isoform IR (iIR) which results from the translation of exon 6 and the translation of the first part of the subsequent intron. While the first two isoforms contain a complete and functioning DNA binding domain (with a difference between the two sequences of only 10 amino acid (Fig.3.1A, dashed box)), the IR results to be truncated due to the presence of a stop codon in the intron sequence (Fig. 3.1A, red line), making unlikely for it to exploit the function of the transcription factors. Of the three FoxP isoforms, iB was most directly associated with the learning phenotype discovered by (Mendoza et al., 2014).
Therefore, we inserted the sequence of the yeast transcription factor Gal4 (driver component of the UAS/Gal4 binary system) into exon 8, which is exclusive to iB (Fig.
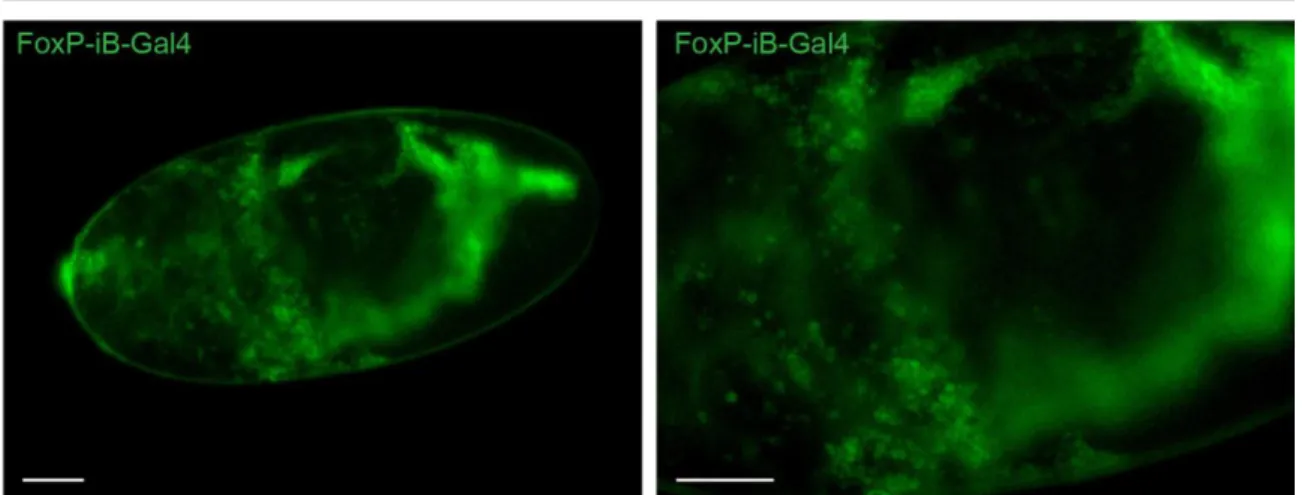
3.1A). This insertion leads to the expression of the Gal4 transcription factor only in FoxP- iB positive cells. At the same time, the insertion also disrupts the forkhead-box (FH) DNA binding domain of the FoxP gene, preventing the FoxP protein to act as a transcription factor, effectively mutating the gene for this function. Consequently, we tested for Gal4 reporter gene expression and FoxP expression levels (Fig. 3.1). Observing Gal4 expression with different green fluorescent proteins (GFPs) under control of the UAS promoter (to which Gal4 binds), revealed that FoxP-iB is expressed throughout the whole development of the fly, from embryo (Supplemetary Fig. S1) to adult, in both brain and ventral nerve
28 | P a g e cord (VNC) (Fig. 3.1B). In 3rd instar larvae we can clearly see expression in the central brain (but not in the optic lobes) and in the VNC, while in the adult the main expression domains in the neuropil comprise protocerebral bridge, gnathal ganglia (subesophageal zone), vest, saddle, noduli, and superior medial protocerebrum. GFP-positive cell body clusters could be found in the cortex of both the central brain and around the optic lobes (Fig. 3.1B). We next validated the expression pattern of our iB-specific driver line to the staining of an available isoform unspecific polyclonal antibody (Lawton et al., 2014). We observed complete colocalization of the driver line with the antibody staining in both larvae and adults, i.e., there were no GFP-positive cells that were not also labeled by the FoxP antibody (Fig. 3.1C). The cells only stained for the FoxP antibody and not for GFP are presumably cells expressing the other FoxP isoforms (iA and iIR, Fig. 3.5). Notably, in contrast to previous reports (DasGupta et al., 2014; Groschner et al., 2018) but consistent with (Castells-Nobau et al., 2019), we did not detect any FoxP expression in mushroom body cells, neither with our driver line, nor with the antibody.
Postulating that our transgene disrupted expression of FoxP gene, we measured mRNA levels of all three isoforms with RT-qPCR (Fig.3.1D). With one of the primers placed over the Gal4 insertion site, we observed approximately half the wild type FoxP-iB expression levels in heterozygous animals, while FoxP-iB expression was nearly abolished in the homozygous transgenes. We did not observe any change in the other two isoforms in neither hetero- nor homozygous mutants.
29 | P a g e
30 | P a g e Fig. 3.1: FoxP-iB expression in the Drosophila nervous system. (A) Schematic representation of the FoxP gene locus before (above) and after (below) insertion of a Gal4 sequence into exon 8. (B) FoxP-iB- Gal4>CD8-GFP expression pattern costained with nc82 in 3rd instar larvae, adult brain and adult VNC. (C) Driver line costained with a polyclonal FoxP antibody in larval and adult brain. The yellow arrowheads indicate colocalization, while the red ones indicate cells only positive for the antibody staining. (D’) RT- qPCR for FoxP-iA, iB and IR on controls and hetero and homozygous FoxP-iB-Gal4 mutant. (D’’) Primers used for the RT-qPCR. Data are expressed as means ± SEM. *p<0.005. Scale bars: 50 μm.
3.2 FoxP-isoB is expressed in different types of neurons
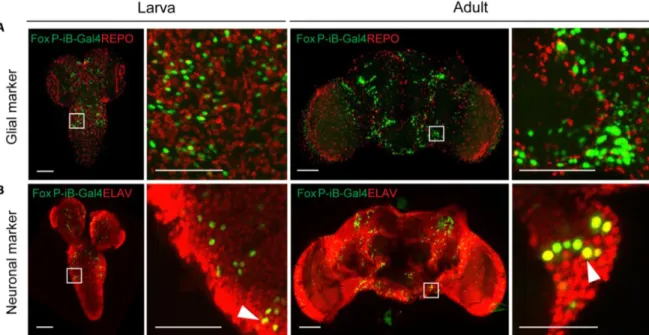
With FoxP involved in learning and expression patterns suggesting neuronal expression (Fig. 3.1), we investigated whether the observed expression was exclusively neuronal, or if there were also FoxP-iB expressing glial cells. Therefore, we stained 3rd instar larva and adult brains with antibodies against ELAV (neuronal marker) and REPO (glial marker). At both developmental stages, the two stainings reveal exclusive FoxP-iB- mediated GFP colocalization with ELAV without any colocalization with REPO (Fig. 3.2), suggesting that FoxP-iB is expressed exclusively in neurons. These data are consistent with results published previously (Castells-Nobau et al., 2019; K. Lawton, 2014), validating the methods employed here.
We next investigated in more detail the type of neurons in which FoxP is expressed (Fig 3.3). Using a variety of antibodies used as markers for different neuronal cell types we detected FoxP-iB expression in most of the cell types investigated. Except for the anti-TH, all of the antibodies used here proved to be working better in the larval nervous system, so we mostly analyzed 3rd instar larvae. Extensive colocalization was observed with p- SMAD1/5 (a motorneuron marker) in the VNC but not in the central brain (CB). Some FoxP-iB neurons were positive for ChAT (cholinergic) or GABA (inhibitory) both in the VNC and in the CB.These data are consistent with the study performed by Schatton et al., 2018 in honeybees where they found colocalization between AmFoxP positive neurons and GABAergic, cholinergic and monoaminergic markers. Finally, a few FoxP-iB positive neurons were found to colocalize with Tyrosine hydroxylase (dopaminergic neurons) in the CB only. No colocalization was found between FoxP-iB and Chaoptin (a marker for photoreceptor neurons; Pollock et al., 1990) (Fig. 3.4).
31 | P a g e We also crossed the FoxP-LexA line (see Results section 3.3) with LexAop-RFP- UAS-CD8-GFP and Tdc2-Gal4 to investigate any potential tyraminergic or octopaminergic FoxP neurons, but despite a close proximity between the two cell types, no colocalization was found (Fig. 3.4).
Fig. 3.2: Only neurons, not glia, are expressing FoxP-iB in the Drosophila brain. Immunohistochemistry on FoxP-iB-Gal4>Stinger-GFP flies with REPO (glia, A) and ELAV (neurons, B) markers. Note the lack of colocalization of FoxP-iB driven GFP with the glial marker in both 3rd instar larvae and adult brains (A). In contrast, exclusive colocalization of FoxP-driven GFP with the neuronal marker was observed in both developmental stages (white arrowheads indicate typical examples). Scale bars: 50 μm.
32 | P a g e Fig. 3.3: FoxP-iB is expressed in various types of neurons. Immunohistochemistry on FoxP-iB-Gal4>CD8- GFP flies using different antibodies. (A) Some of the FoxP-iB positive neurons colocalize with p-SMAD1/5 in the VNC but not in the central brain. (B-C) FoxP-iB neurons positive for ChAT or GABA have been found in both the VNC and CB. (D) Only ew FoxP-iB neurons colocalize with TH and only in the CB. White arrowheads indicate examples of colocalization. Scale bars 25 μm.
33 | P a g e Fig. 3.4: FoxP-iB is not expressed in photoreceptor or octopaminergic cells. The immunohistochemistry for a photoreceptor cell marker (upper row) reveal no colocalization between Chaoptin and FoxP-iB. The cross of a FoxP-LexA line with LexAop-RFP-UAS-CD8-GFP and Tdc2-Gal4 (two lower rows) show also no colocalization but a great proximity between the two cell types, suggesting a possible communication between the two, in both CB (central brain) and VNC (ventral nerve cord). Scale bars: 50 μm.
34 | P a g e 3.3 FoxP isoforms are differentially expressed
As the antibody staining against the FoxP protein indicated more cells expressing FoxP than our iB-specific driver line was reporting (Fig. 3.1B), we created a second driver line, designed to drive expression in all FoxP cells, irrespective of isoform. We inserted a sequence for the bacterial LexA transcription factor in exon 3 (Fig. 3.5A), which have a mechanism of action similar to Gal4. Driving Stinger-GFP expression with each driver line revealed a more expansive pattern for the isoform unspecific driver (Fig. 3.5B), as the FoxP antibody staining had suggested (Fig. 3.1B). This visual impression was corroborated by a quantification of stained nuclei (Fig. 3.5C). This quantification allowed us to trace the proliferation of FoxP cells from around 500 in 3rd instar larvae to around 1800 in three days-old adults. In contrast, there are only about 300 cells expressing FoxP-iB in the 3rd larval instar and around 1300 in three days-old adults. We noticed that the largest differences in terms of cell number between FoxP-LexA and FoxP-iB-Gal4 flies (both larvae and adults) were found in the CB, while the VNC numbers varied considerably less.
For instance, in 3rd instar larvae and in three days-old adults, 66 % and 65 %, respectively, of the total number of FoxP neurons in the Drosophila nervous system express iB. As with our previous insertion, also this one was expected to disrupt expression of the FoxP gene.
To investigate the extent of this disruption on the mRNA level, we again performed RT- qPCR. In contrast to the results from our previous insertion, as expected, this insertion affected all isoforms. In heterozygous flies, the expression level was increased, while in homozygous flies it was decreased (Fig. 3.5E). It is important to note that the reverse primers for these isoforms were chosen to target sequences downstream of the insertion site (see Fig. 3.1A).
In order to directly compare the expression patterns of our two driver lines, we used them to drive reporter genes fluorescing at different wavelengths (i.e., LexAop-RFP;UAS- CD8-GFP) and analyzed their patterns in adult flies (Fig. 3.6). In this way, we labeled all FoxP-expressing neurons red and neurons that specifically expressed FoxP-iB in green (Fig. 3.6A). We used the “Colocalization Threshold” tool from ImageJ, which computes false colors to enhance the comparison between the two driver lines and let the differences stand out (see M&M) (Fig. 3.6B). We can see that the other two isoforms are expressed also in the antennal lobe, lobula and fan shaped body (Fig. 3.6A, red arrowhead; Fig. 3.6B,
35 | P a g e blue areas). Since this las mutant results homozygous for the mutation for FoxP-iB, it is important to mention that, as control, we performed a cell count on both heterozygous and homozygous FoxP-iB-Gal4 mutants, in order to identify any cell loss in the latter, but no significant change was encountered (Fig. 3.7).
Fig. 3.5: FoxP-iB is expressed in a subset of FoxP-expressing neurons. (A) Schematic representation of the FoxP gene locus after LexA insertion. This is an isoform unspecific construct with the insertion of a LexA sequence in exon 3. (B) Expression pattern of FoxP-LexA and FoxP-iB-Gal4 driving Stinger-GFP. (C) Cell counting performed with IMARIS on FoxP-LexA and FoxP-iB-Gal4>Stinger-GFP (3rd instar larvae and 3 days-old adults) in both CB and VNC. (D) Pie charts that summarize the results from (C). (E) RT-qPCR on FoxP-LexA flies (control, hetero- and homozygous flies). Data are expressed as means ± SD in (C) and as means ± SEM in (E). *p<0.005 Scale bars: 50 μm.
36 | P a g e Fig. 3.6: FoxP-iB expression pattern compared to the one of FoxP. (A-B) Confocal images of 3rd instar larva and adult brains that express FoxP-iB-Gal4>CD8-GFP (green) and FoxP-LexA>CD8-RFP (red) together.
The image shows in green the areas that express FoxP-iB, in red the total FoxP expression in the Drosophila brain (AL: antennal lobe, PVP: posterior ventrolateral protocerebrum, FSB: fan shaped body, Lo: lobula) and in yellow the areas that are staind by both the construct (CeCl: cell cluster, GG: gnathal ganglion, PB:
protocerebral bridge). Scale bars: 50 μm.
37 | P a g e Fig. 3.7: There is no cell loss in homozygous mutants for FoxP-iB. A cell count performed on both heterozygous and homozygous mutants for FoxP-iB show that there is no significative difference in cell number, thus no cell loss in homozygous mutants.
3.4 FoxP-isoB knockout flies are impaired in locomotor behavior
Mutations in the FoxP gene do not only affect operant self-learning. For instance, different alleles also affect flight performance and other locomotion behaviors to different degrees (Castells-Nobau et al., 2019; Lawton et al., 2014; Mendoza et al., 2014). Because of the FoxP pleiotropy affecting various innate motor behaviors independently from motor learning, we turned to Buridan’s paradigm (Colomb et al., 2012; Götz, 1980) as a powerful tool to measure several locomotor variables. Buridan’s paradigm allows us to test a broad panel of behavioral parameters covering both temporal parameters such as speed or general activity time and spatial parameters such as the straightness of a fly’s trajectory (meander) or the degree to which the animal is heading towards one of the two vertical landmarks (stripe fixation), (Fig. 3.8A). With our insertions constituting novel alleles impairing FoxP expression (Figs. 3.1, 3.4), we started by testing the heterozygous and homozygous driver strains without any effectors. Consistent with previous findings of impaired locomotor behavior in FoxP manipulated flies (Castells-Nobau et al., 2019; Lawton et al., 2014;
Mendoza et al., 2014) and the qPCR results showing reduced FoxP expression (Fig. 3.1D), our FoxP-iB-Gal4 insertion shows abnormalities in Buridan’s paradigm both in temporal as well as in spatial parameters (Fig. 3.8). While the homozygous flies walked more slowly, spent more time at rest and fixated the stripes less strongly than wild type control flies, heterozygous flies did not show the same trend. While in general the differences to wild type flies were less pronounced than for homozygous flies, the temporal parameters tended generally towards the other direction, i.e., the heterozygous flies tended to be faster and
38 | P a g e more active than wild type controls, leading to significantly more distance traveled during the experiment (Fig. 3.8B). In contrast, for the temporal parameter stripe deviation (a quantification of stripe fixation, Fig. 3.8C), the heterozygous flies come to lie between homozygous mutants and wild type controls. Thus, this FoxP allele exhibits differential dominance: recessive (or intermediate) in some phenotypes and overdominant in others.
Overall, however, the differences between wild type controls and heterozygous flies were much less dramatic than those between wild type flies and homozygous insertions. With different effect sizes in each parameter, we selected two representative parameters for the temporal and the spatial domain, respectively, for comparison of all subsequent lines:
walking speed, activity time, meander and stripe fixation. Examples of single trajectories travelled by the flies can be seen in Supplementary Fig. S2 (upper row).
Because our insertion is located in the same exon as the insertion in the FoxP3955 mutant, we tested the FoxP3955 mutant flies in Buridan’s paradigm and found changes in several temporal parameters, similar to those observed in our driver line (Fig. 3.8D).
However, meander and stripe fixation appear unchanged in these flies. Thus, besides the deficits in operant self-learning and flight performance as reported previously (Mendoza et al., 2014), the FoxP3955 mutant flies are also deficient in several temporal parameters of walking behavior in Buridan’s paradigm. This walking phenotype is consistent with previous findings of walking deficits associated with FoxP manipulations (Castells-Nobau et al., 2019; Lawton et al., 2014), but was not detected in a previous publication where walking deficits were tested (DasGupta et al., 2014).
39 | P a g e
40 | P a g e Fig. 3.8: FoxP-iB mutant flies are impaired in several parameters in Buridan’s paradigm. (A) Schematic of Buridan's paradigm. A fly with shortened wings is put in the center of a platform inside a circular arena with two opposing black stripes on the walls. A camera records the position of the fly and the BuriTrack software stores the position data for later analysis with CeTrAn. (B) Temporal parameters. Median speed denotes the instantaneous speed when a fly is walking. Activity time denotes the time spent walking. Distance traveled measures the distance covered by the fly during the experiment. (C) Spatial parameters. Stripe deviation measures the angular deviation from heading towards the center of the stripe to which the fly is oriented. Red dashed line indicates angular stripe deviation of a random walk.(D) The transition plots show the distribution of the platform locations that the flies transitioned through. (E) Buridan’s paradigm on CS flies and FoxP3955 mutants. Meander is a measure for the straightness of a fly’s trajectory. *p<0.005.
3.5 FoxP-all isoform knockout and comparison with FoxP-isoB mutant
With such dramatic motor alterations when only FoxP-iB, which is only expressed in about 65% of all FoxP-positive neurons (Fig. 3.5), is removed (Fig. 3.8) it is interesting to study the effects of removing the remaining isoforms for a complete FoxP knockout. To avoid unwanted potential side-effects of expressing a different protein in its stead, we created a third fly line where the entire second exon is removed together with parts of exons 1 and 3. We validated this mutant with the polyclonal antibody we used before (Fig. 3.1).
While the antibody detected the FoxP gene product in control flies, there was no signal in our homozygous knock-out flies (Fig. 3.9A, B). Analogous to the behavioral characterization in the FoxP-iB insertion line, we tested both heterozygous and homozygous FoxP-KO deletion mutants in Buridan’s paradigm (Fig. 3.9C-F). The results of this experiment closely resemble the ones from the FoxP-iB-Gal4 insertion line, with homozygous mutants being both significantly less active (Fig. 3.9C) and fixating the stripes less strongly than the heterozygous mutants and the controls (Fig. 3.9D, E). Also for this allele, the heterozygous FoxP-KO mutants show higher values for all temporal parameters compared to the wild type controls, while there is no difference in stripe deviation. Thus, also the FoxP-KO allele exhibits differential dominance. Examples of single trajectories travelled by the flies can be seen in Supplementary Fig. S2 (lower row).
A direct comparison of the data from the two homozygous alleles (FoxP-iB and FoxP-KO) showed only a small difference in walking speed (Fig. 3.9F), but no significant difference for all the other parameters considered if not just a small trend. Thus, removing the other FoxP isoforms had hardly any effect beyond the consequences of removing only FoxP-iB alone.
41 | P a g e Fig. 3.9: Deleting the entire FoxP gene has similar consequences in Buridan’s paradigm as deleting only FoxP-iB. (A) Schematic representation of the deletion (FoxP-KO) and the wild type (WT) gene locus. (B) Immunohistochemistry staining for the FoxP gene product in wild type and FoxP-KO mutant brains. (C) Temporal parameters. See Fig. 7 and M&M for definitions. Note the overdominance of the heterozygous FoxP-KO flies. Stripe deviation (D) and transition plots (E) show weaker stripe fixation of homozygous FoxP-KO flies. (F) Comparing FoxP-KO and FoxP-iB flies reveal only a small difference in walking speed.
*p<0.005. Scale bars: 25 μm.