royalsocietypublishing.org/journal/rsob
Research
Cite this article:Palazzo O, Rass M, Brembs B. 2020 Identification ofFoxPcircuits involved in locomotion and object fixation inDrosophila.
Open Biol.10: 200295.
https://doi.org/10.1098/rsob.200295
Received: 14 September 2020 Accepted: 10 November 2020
Subject Area:
genetics/neuroscience/molecular biology
Keywords:
FoxP,Drosophila, behavioural biology, molecular biology
Author for correspondence:
Björn Brembs
e-mail: bjoern@brembs.net
Identification of FoxP circuits involved in locomotion and object fixation in Drosophila
Ottavia Palazzo, Mathias Rass and Björn Brembs
Institut für Zoologie - Neurogenetik, Universität Regensburg, Regensburg, Germany OP, 0000-0002-3061-9643; MR, 0000-0001-7509-0336; BB, 0000-0001-7824-7650
TheFoxPfamily of transcription factors is necessary for operant self-learning, an evolutionary conserved form of motor learning. The expression pattern, molecular function and mechanisms of action of theDrosophila FoxPortholo- gue remain to be elucidated. By editing the genomic locus of FoxP with CRISPR/Cas9, we find that the three differentFoxPisoforms are expressed in neurons, but not in glia and that not all neurons express all isoforms.
Furthermore, we detectFoxPexpression in, e.g. the protocerebral bridge, the fan-shaped body and in motor neurons, but not in the mushroom bodies.
Finally, we discover thatFoxPexpression during development, but not adult- hood, is required for normal locomotion and landmark fixation in walking flies. WhileFoxPexpression in the protocerebral bridge and motor neurons is involved in locomotion and landmark fixation, theFoxPgene can be excised from dorsal cluster neurons and mushroom-body Kenyon cells without affecting these behaviours.
1. Introduction
The family ofForkhead Box(Fox) genes comprises a large number of transcription factors that share the evolutionary conserved forkhead/winged-helix DNA- binding domain [1]. In mammals, the FoxPsubfamily (FoxP1-4) members [2]
are abundantly expressed during the development of multiple cell types, such as cardiomyocytes, neurons, lung epithelial secretory cells and T-cells [3].
In particular,FoxP1andFoxP2have generated interest because of their roles in regulating the development of cognitive processes such as speech and language acquisition [4–13].
Humans with FOXP1 deletions present with mild mental retardation, delayed onset of walking, gross motor impairments and significant language and speech deficits [8]. Mutations in FOXP2 cause a severe speech and language disorder characterized by deficits in language processing, verbal dys- praxia and impaired grammatical skills, without affecting other traits severely [4,5]. The function ofFoxPgenes in vocal learning appears to be evolutionary conserved as knock-outs of the zebra finch orthologue of human FOXP2 during the critical song learning period alters the structure of the crystallized song in the adults [14]. Such vocal learning is a form of motor learning that pro- ceeds slowly from highly variable ‘babbling’ (in humans) and ‘subsong’(in zebra finches) towards more stereotypic language and crystallized song, respectively. This specific kind of learning has been classified as a form of oper- ant learning [15–17]. It was recently shown that, as in humans and zebra finches, also in flies,FoxPis involved in such operant learning [18].
The original forkhead (fkh) gene was identified in the fruit fly Drosophila melanogaster [19], where mutations cause defects in head fold involution during embryogenesis, causing the characteristic ‘fork head’. In contrast to chordates with fourFoxPfamily members, only one orthologue of theFoxPsub- family is present in flies (dFoxP). The dFoxPgene gives rise to three different
© 2020 The Authors. Published by the Royal Society under the terms of the Creative Commons Attribution License http://creativecommons.org/licenses/by/4.0/, which permits unrestricted use, provided the original author and source are credited.
transcripts by alternative splicing [2,18,20]: FoxP-isoform A (FoxP-iA), FoxP-isoform B (FoxP-iB) and FoxP-isoform IR (Intron Retention;FoxP-iIR) (figure 1a). The currently available reports as to the expression pattern of theFoxPgene have been contradictory and nothing is known as to whether the different isoforms are differentially expressed in different cell types.
To resolve these issues we have tagged the endogenous FoxPgene, analysed the isoform-specific expression patterns and compared them with the expression of a selection of cell-type-specific markers.
Flies with a mutatedFoxPgene not only show impairments in operant learning, but also in motor coordination and performance of inborn behaviours [18,20–22]. While isoform- specific alleles did show different phenotypes as well as different degrees of severity of these impairments, it remains unknown which neurons requireFoxPexpression at what devel- opmental stage(s) for normal locomotor behaviour. We therefore knocked out the FoxP gene in a spatiotemporally controlled manner and analysed spatial and temporal parameters of loco- motor behaviour in the resulting mutants in Buridan’s paradigm.
2. Material and methods
2.1. Fly strains
Fly stocks were maintained at 18°C (table 1). Before exper- imental use, flies were kept at 25°C, in a 12/12 h light/dark regime at 60% relative humidity for at least one generation.
All crosses were raised at 25°C (except for the ones involving the temperature-sensitive Gal4 inhibitor Gal80ts [23,24] that were raised at 18°C) using four to six females and two to four males. For expression pattern visualizations, the FoxP- iB-Gal4andFoxP-LexAdriver line, respectively, were crossed with the appropriate effector lines containing different GFP or RFP variants (table 1). For behavioural analysis involving the UAS-t:gRNA(4xFoxP), this effector line was always first crossed with a UAS-Cas9 line, and the resulting double- effector offspring with the appropriate driver line for each experiment (ELAV-Gal4, D42-Gal4, C380-Gal4, cmpy-Gal4, ato-Gal4andELAV-Gal4;Tub-Gal80ts).
For local knock-out experiments, two genetic constructs need to be brought together for the method to work effectively.
The endonuclease Cas9 needs to be present as well as the guide RNA (gRNA) to provide a target for the nuclease. Hence, the appropriate control groups express only one component of the CRISPR/Cas9 combination. One line drives expression only of the Cas9 endonuclease (i.e.xxx-Gal4 > UAS-Cas9,with- out gRNAs) and the other drives expression only of the gRNAs (i.e. xxx-Gal4 > UAS-t:gRNA(4xFoxP) without Cas9). In this fashion, each strain not only controls for potential insertion effects of the transgenes used, but also for potential detrimental effects of expressing the components alone, irrespective of the excision of the target gene.
For the behavioural analysis involving theFoxP-KOmutant and theFoxP-iB-Gal4driver line we crossed the lines back into Wild-Type Berlingenetic background for at least six generations in order to get the same genetic background as theWTBcontrol.
2.2. In-silico sequences alignment
The transcript and protein sequences of the different FoxP isoforms were downloaded from https://flybase.org and
aligned withClustal Omegafor multiple sequence alignment.
The protein domains were analysed with theNCBI Conserved Domain Searchtool, and the stop codons were identified with ExPASy Translatetool (figure 1a).
2.3. Transgenics
We used CRISPR/Cas9 Homology-Directed Repair (HDR) to edit theFoxPlocus [25] and generated t-RNA based vectors for producing multiple clustered regularly interspaced (CRISPR) gRNAs from a single transcript [26]. We created a total of two driver lines (FoxP-iB-Gal4 and FoxP-LexA), one mutant line (FoxP-KO) and one effector line (UAS-t:gRNA(4xFoxP)).
2.3.1. FoxP-iB-Gal4
To create an isoform-specific driver line, we inserted a Gal4 sequence into exon 8, which is specific to isoform B. Two 1 kb homology fragments were PCR-amplified (primers Hom1: fw 50-GGGGGCGGCCGCCGTGGAAGGTAAAATG CCCCATATATG-30, rv 50-GGGGCCGCGGCCCTCGTGTA AGGAAAGGTTCGTACGAATCGC-30; primers Hom2: fw 50-GGGGGGCGCGCCACAAGTGCTTTGTACGTTATGAA-30, rv 50-GGGGGGTACCGGTCACTGAGTATCGTTAATGATC-30) and digested with the appropriate restriction enzymes (Hom1:
NotI and SacII, Hom2: AscI and KpnI) to be ligated in the pT- GEM(0) (Addgene plasmid no. 62891; RRID:Addgene_62891) vector [27] which contained a Gal4 sequence and a 3xP3-RFP- SV40 sequence for selection of transformants. The gRNA sequences used are: sense 50-CTTCGACGTACAAAGCACTTG TGTA-30, and asense 50-AAACTACACAAGTGCTTTGTACG TC-30. They were annealed and cloned inside a pU6-gRNA (Addgene plasmid no. 53062; RRID:Addgene_53062) vector [28], previously digested with BbsI restriction enzyme.
2.3.2. FoxP-LexA
To create a driver line that reflects expression of allFoxPiso- forms, we inserted a LexA sequence into exon 3. Two 1 kb homology fragments were PCR-amplified ( primers Hom1:
fw 50-GGGGGCGGCCGCCAGGAATGGCGGCATATGAGT- 30, rv 50-GGGGCCGCGGCCCTCTATTACGGTAAGCGGAC TCCGG-30; primers Hom2: fw 50-GGCCGGTACCATAGCA- TAGGCCGACCCATC-30, rv 50-GGCCACTAGTTCACATTCT CAACCCGCATAAAGC-30) and digested with the appropri- ate restriction enzymes (Hom1: NotI and SacII, Hom2: KpnI and SpeI) to be ligated in the pT-GEM(0) vector which con- tained a LexA sequence and a 3xP3-RFP-SV40 sequence for selection of transformants. The gRNA sequences used are:
sense 50-CTTCGGGTCGGCCTATGCTATTTA-30, asense 50-A AACTAAATAGCATAGGCCGACCC-30. They were annealed and were cloned inside a pU6-gRNA vector previously digested with BbsI restriction enzyme.
2.3.3. FoxP-KO
To prevent expression of any isoform of theFoxPgene, we removed part of exon 1, the complete exon 2 and part of exon 3. Two 1 kb homology fragments were PCR-amplified (primers Hom1: fw 50-GGGGCTAGCCAAAATAAGATGTGT CTGGTTTCCTTG-30, rv 50-GGGCCGCGGGCATGGCGAACT CATCGTG-30, primers Hom2: fw 50-GGGGACTAGTAGAGG GAAAGTTTTGCCGG-30, rv 50-GGGGCTGCAGTATGAAGG
royalsocietypublishing.org/journal/rsobOpenBiol.10:200295
2
(b)
(c)
(d)
(a) WT gene locus
protein isoforms
IsoB-specific driver line Isoform A Isoform B
7 8 Isoform IR
1 2 3 4 5 6 7 8
1
1 2 3 4 5 6 7 8
2 3 4 5 6 7 8 Gal4 8
intron exon FH domain start/stop codon
untranscribed
adult
adult
larva
larva
100 bp
D' n.s. D'' primers
Ctrl heterozygous homozygous Ctrl heterozygous homozygous Ctrl heterozygous homozygous
FoxP-ilR FoxP-iB
FoxP-iA
IB IlR
IlR IA IB
n.s. IA
n.s.
n.s.
n.s.
n.s.
*
*
0 4 4 4 3 3 3 2 2 2
0.5
relative gene expression
1.0 1.5
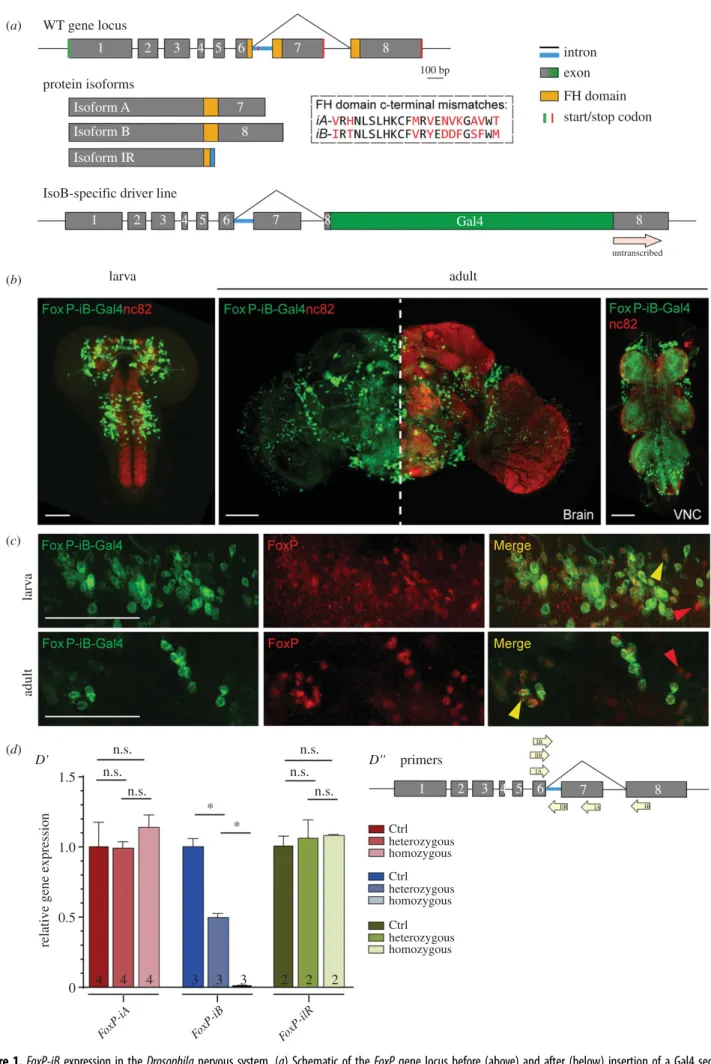
Figure 1.FoxP-iBexpression in theDrosophilanervous system. (a) Schematic of theFoxPgene locus before (above) and after (below) insertion of a Gal4 sequence into exon 8. (b)FoxP-iB-Gal4 > CD8-GFPexpression pattern costained with nc82 in 3rd instar larvae, adult brain and adult VNC. (c) Driver line costained with a polyclonal FoxP antibody in larval and adult brain. The yellow arrowheads indicate colocalization, while the red ones indicate cells only positive for the antibody staining. (d0) RT-qPCR for FoxP-iA, iB and IR on controls and hetero and homozygousFoxP-iB-Gal4mutant. (d00) Primers used for the RT-qPCR. Data are expressed as means ± s.e.m. *p< 0.005. Scale bars: 50 µm.
royalsocietypublishing.org/journal/rsobOpenBiol.10:200295
3
GACAGATTGTGCCGG-30) and digested with the appropriate restriction enzymes (Hom1: NheI and SacII, Hom2: SpeI and PstI) to be ligated in the pHD-DsRed-attP (Addgene plas- mid no. 51019; RRID:Addgene_51019) vector which contains a 3xP3-DsRed sequence for selection of transformants. The gRNA sequences used are: gRNA1 sense 50-CTTCGCGGATG ATAGTACTTCCGCA-30, asense 50-AAACTGCGGAAGTACT ATCATCCGC-30; gRNA2 sense 50-CTTCGAAGGACGTGCCC GGAAGAGA-30, asense 50-AAACTCTCTTCCGGGCACGTC CTTC-30. They were annealed and were cloned inside a pU6- gRNA vector previously digested with BbsI restriction enzyme.
2.3.4. UAS-t:gRNA(4xFoxP)
To create an isoform-unspecific conditional effector line we phosphorylated and annealed three sets of oligos (1. fw 50- CGGCCCGGGTTCGATTCCCGGCCGATGCAGAGCATCGA TGAATCCTCAAGTTTCAGAGCTATGCTGGAAAC-30, rv 50- GCTCGGATATGAACTCGGGCTGCACCAGCCGGGAATCG AACC-30; 2. fw 50-GCCCGAGTTCATATCCGAGCGTTTCA GAGCTATGCTGGAAAC-30, rv 50-ACGGCATATGCCATGA GCAATGCACCAGCCGGGAATCGAACC-30; 3. fw 50-TTGC TCATGGCATATGCCGTGTTTCAGAGCTATGCTGGAAAC-30, rv 50-ATTTTAACTTGCTATTTCTAGCTCTAAAACAACCA TGTTCCGTATTCAGATGCACCAGCCGGGAATCGAACC-30)
that were cloned with a single Gibson Assembly reaction in a pCFD6 (Addgene plasmid no. 73915; RRID:
Addgene_73915) vector [26] which was previously digested with BbsI restriction enzyme.
After the constructs were created, they were injected into early embryos (;Vas/Cas9;for theFoxP-iB-Gal4, FoxP-LexAand FoxP-KO and Integrase(x);;AttP2 for UAS-t:gRNA(4xFoxP)).
The resulting transformants were crossed two times with the balanced fliesw-;; D3/TM3, Sb.
2.4. Immunohistochemistry
Three to 6 day-old adults were fixed in 4% paraformaldehyde (PFA) at 4°C for 2 h and dissected in 0.01% phosphate-buf- fered saline with Triton®X-100 detergent (PBST). For larval staining, third instar larvae were selected, dissected in 0.01% PBST and fixed in 4% PFA at room temperature (RT) for 30 min. Clean brains were washed three times in 0.01%
PBST for a total time of 45 min and then blocked with 10%
normal goat serum (NGS) for 1 h. Subsequently, the brains were incubated with the appropriate primary antibody for one to two nights at 4°C (table 2). After three washing steps of 15 min each, the brains were incubated with the sec- ondary antibody (table 3) for 5–7 h at RT. After an additional 15 min washing step, the brains were placed on glass micro- scope slides and mounted with the antifade mounting medium Vectashield®(Vector Laboratories, Burlingame, CA).
2.5. Image acquisition and analysis
All images were acquired with a Leica SP8 confocal microscope (RRID: SCR_018169), images were scanned at a frame size of 1024 × 1024 pixels at 200 or 100 Hz. The objectives were 20×
dry and 20×/40×/60× oil immersion. Images were processed with IMAGEJ software (National Institutes of Health, Maryland, USA; RRID: SCR_003070) [29], only general adjustments to colour, contrast and brightness were made. Cell counting was performed with IMARIS 9.0 (Oxford instruments, UK) soft- ware on UAS-Stinger-GFP stacks, using the tool for spots counting. For the FoxP-iB-Gal4/FoxP-LexA count (figure 4b), five brains were counted for each genotype at both larval (3rd instar) and adult (2–3 days old) stages. The colocalization analysis was performed with the ImageJ Colocalization Threshold tool (Tony Collins and Daniel James White) (figure 5b). The three-dimensional rendering (figure 12b) was performed with IMARIS 9.0 software on the Drosophila standard brain from https://www.virtualflybrain.org.
2.6. RT-qPCR
The knock-out efficiency was assessed using RT-qPCR (figures 1dand 4e). We extracted RNA from 20 flies for each genotype (white−, heterozygous mutant and homozygous mutant, both with a white−background), following the Tri- Fast™ protocol from peqlab (a VWR company) (catalogue no. 30–2010). The RNA was subsequently transcribed into cDNA using the OneStep RT-PCR Kit from QIAGEN (catalo- gue no. 210212) with the following thermocycler programme: 42°C for 2 min, 4°C pause until manual restart at 42°C for 30 min, 95°C for 3 min and finally 10°C∞. Sub- sequently, we performed the qPCR. Primer sequences were identical to those used by Mendozaet al. [18]. For the qPCR reaction, we used a Bio-Rad CFX Connect Real-Time PCR Table 1.Complete list of thefly lines used in this study.
genotype use RRID
;;;ok107-Gal4 driver line
;;ato-Gal4; driver line BDSC_6480
;;cmpy-Gal4; driver line BDSC_50422
;;D42-Gal4; driver line BDSC_8816
;;FoxP-/-;a mutant /
;;FoxP-iB-Gal4;a driver line /
;;FoxP-LexA;a driver line /
;;UAS-t:gRNA(4xFoxP);a effector line /
;ELAV-Gal4;; driver line
;LexAop-mCD8-RFP-UAS-mCD8- GFP;;
effector line
;LexAop-Stinger-GFP;; effector line
;Tdc2-Gal4;; driver line BDSC_9313
;UAS-Cas9;; effector line
;UAS-CD8-GFP;; effector line
;UAS-Stinger-GFP;; effector line
;Vas-Cas9 mutant
C380-Gal4;;; driver line BDSC_80580
CS-TZ wild-type strain
ELAV-Gal4;Tub-Gal80ts;; driver line
FoxP3955 mutant
Integrase(x);;AttP2 mutant
w-;; D3/TM3, Sb balancer
white-/- mutant
WTB wild-type strain
aTheflies strains marked are the ones that we created in the present work.
royalsocietypublishing.org/journal/rsobOpenBiol.10:200295
4
Detection System thermocycler and the Bio-Rad CFX manager software to store and analyse the data. Every sample was run in triplicate in a 96-well plate in a total volume of 10 µl. The mix- ture contained 5 µl sybrGreen master mix (ORA™qPCR Green ROX H Mix, 2X, from highQu, catalogue no. QPD0201), 0.5 µl from each primer, 1 µl of 1 : 10 diluted cDNA and 3 µl H2O.
As reference, we used the housekeeping generp49(ribosomal protein 49), while as a negative control we used the same reaction mix without cDNA. The qPCR reaction programme used was:
95°C for 2 min, 95°C for 10 s, 60°C for 10 s, 65°C for 30 s (from step 2 to 4 × 39 rounds), 95°C for 10 s, and finally from 65°C to 95°C for +0.5°C/5 s. The experiments were repeated two to four times.
2.7. Behaviour
All behavioural experiments were performed in Buridan’s paradigm (RRID: SCR_006331) [30]. In this experiment, we analysed both temporal components of walking behaviour (often subsumed under ‘general locomotion’) and spatial components such as fixation of landmarks or the straightness of the walking trajectory. Buridan’s paradigm (figure 6a) con- sists of a round platform with a diameter of 117 mm which is surrounded by a water-filled moat. The platform is situated at the bottom of a uniformly illuminated white cylinder, 313 mm in height and 293 mm in diameter [31]. Two black stripes are placed on the inside of the cylinder, opposite each other, serving as the only visual cues for the flies. Two day-old female flies were collected and their wings were clipped under CO2 anesthesia. After one night recovery at 25°C, they were tested in Buridan’s paradigm for 15 min (doi:10.17504/protocols.io.c7vzn5). The position of the fly is recorded by a camera (Logitech Quickcam Pro 9000) con- nected to a computer running our BuriTrack software (http://buridan.sourceforge.net.)
The analysis software CeTrAn [31] (https://github.com/jco- lomb/CeTrAn) extracts a variety of parameters from the scored trajectories. From the parameters extracted by CeTrAn, we used the temporal parameters median speed (the median of all instan- taneous speed data points measured when the fly is walking), distance travelled, number of walks (sections of the trajectory which connect the platform areas closest to the two stripes) and activity time (fraction of time spent walking), as well as the spatial parameters stripe deviation (angular deviation of the fly’s head- ing from the centre of the stripe in the frontal visual field) and meander (a measure of the tortuosity of the fly’s trajectory). Tran- sition plots visualize the areas on the platform that the flies most frequently visited. More details in [31].
For the experiment involvingTub-Gal80ts(figure 8e–hand 11a,b), flies were raised at 18°C, moved to 30°C for 12 h (embryos) or 48 h ( pupae and adults) and subsequently left at 25°C for the rest of the development (embryos and pupae) or overnight for recovery (adults) before testing.
2.8. Statistical analysis
All graphs were created and statistical analysis was performed using GraphPad Prism 6 (GraphPad Software, Inc., California, USA; RRID: SCR_002798) software. Sample variances were compared with anF-test. In the absence of significantly differ- ent variances, we used Student’st-tests (two-tailed) or one way ANOVAs followed by Tukey’s post hoc test for multiple comparisons. If the F-test was significant at p< 0.005 (see below), we used a Mann–WhitneyU-test or a Kruskal–Wallis ANOVA followed by Dunn’s post hoc test for multiple comparisons. Alpha values were set to 0.5%, in order to reduce the chances of false-positives, following the arguments detailed in [32], where BB is an author. Whenever null hypothesis significance testing was performed using the non- parametric tests, it is indicated in the figure legends. All other tests were performed using parametric tests.
Table 2.Complete list of the primary antibodies used in this study.
antigen host dilution incubation source RRID
Chaoptin-11 mouse 1 : 500 1 night DSHB AB_528161
ChAT mouse 1 : 250 1 night DSHB AB_528122
ELAV rat 1 : 100 1 night DSHB AB_528218
FoxP guinea pig 1 : 200 2 nights Lawtonet al. [21] /
GABA rabbit 1 : 250 2 nights GeneTex AB_2037030
nc82 mouse 1 : 500 1 night DSHB AB_2314866
p-SMAD1/5 rabbit 1 : 250 2 nights Cell Signaling Technology AB_491015
REPO mouse 1 : 500 1 night DSHB AB_528448
TH rabbit 1 : 500 1 night Millipore AB_390204
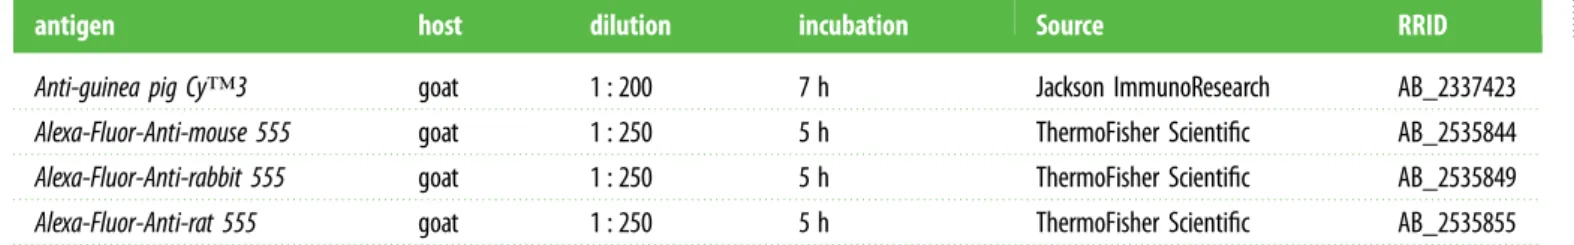
Table 3.Complete list of the secondary antibodies used in this study.
antigen host dilution incubation Source RRID
Anti-guinea pig Cy™3 goat 1 : 200 7 h Jackson ImmunoResearch AB_2337423
Alexa-Fluor-Anti-mouse 555 goat 1 : 250 5 h ThermoFisher Scientific AB_2535844
Alexa-Fluor-Anti-rabbit 555 goat 1 : 250 5 h ThermoFisher Scientific AB_2535849
Alexa-Fluor-Anti-rat 555 goat 1 : 250 5 h ThermoFisher Scientific AB_2535855
royalsocietypublishing.org/journal/rsobOpenBiol.10:200295
5
The initial behavioural experiments (figure 6) were carried out with a sample size which, from experience, would be suffi- cient to detect medium to large effects, i.e.N∼20. We then used these results to perform a power analysis for the sub- sequent experiments. We found that effect sizes such as those exhibited in the speed, meander or stripe fixation parameters required a sample size of up to 18 to reach 80% statistical power at an alpha of 0.5% [32], while effects such as those in the activity time parameter would require up to 100 flies. We corroborated these analyses with Bayesian analyses, where the activity time parameter yielded a Bayes factor below one, while the other effects yielded Bayes factor values beyond 100. Therefore, we set the target sample size for all subsequent Buridan experiments to 18 andp< 0.005 was considered sig- nificant. Data are expressed as averages ± s.e.m. or averages
± s.d., and each case is indicated in the legend of each figure.
3. Results
3.1. FoxP-iB expression in the Drosophila brain
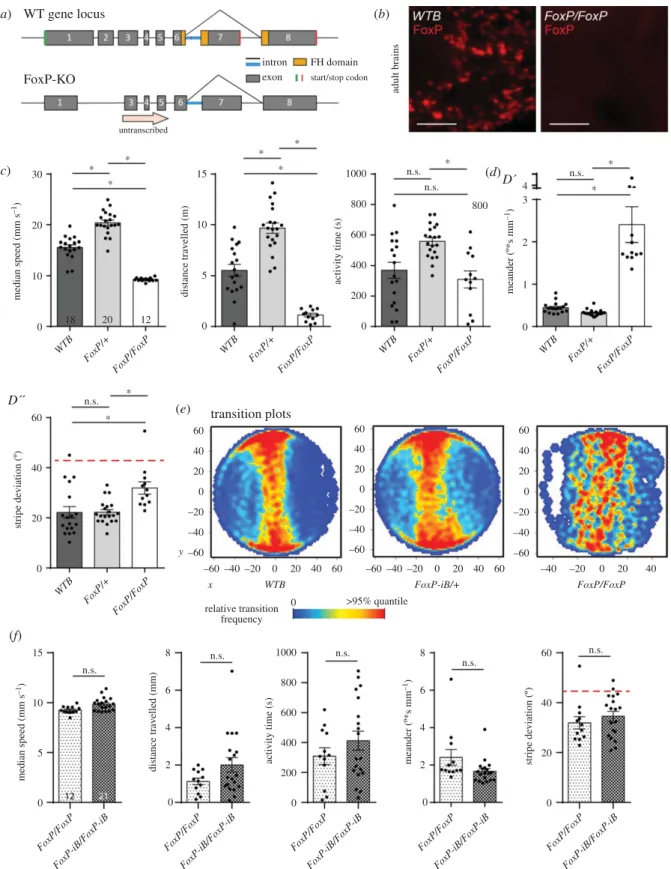
TheFoxPtranscription factor binds DNA with the forkhead (FH) box domain (figure 1a, yellow boxes; raw data depos- ited at doi:10.6084/m9.figshare.12607700). The gene consists of seven introns and eight exons. The FH box is split into different segments spanning exons 6, 7 and 8. The last two exons (7 and 8) are subjected to alternative splicing, leading to two different protein isoforms: isoform A (FoxP-iA), which results from splicing exon 6 to exon 7, and isoform B (FoxP-iB) where instead exon 8 is spliced to exon 6. A third, intron-retention isoform is transcribed by failing to splice the intron between exon 6 and 7 out (FoxP-iIR). While the first two isoforms contain a complete and putatively function- ing FH box (with 10 amino acids different between the two;
figure 1a, dashed box), the putative FoxP-iIR FH box appears to be truncated due to a stop codon in the intron sequence (figure 1a, red line), putting the transcription factor function of this isoform in doubt. Of the three FoxP isoforms,FoxP-iB was most directly associated with the learning phenotype dis- covered by Mendoza et al. [18]. Therefore, we inserted the sequence of the yeast transcription factor Gal4 into exon 8, the exon which is exclusive toFoxP-iB(figure 1a). This insertion leads to the expression of the Gal4 transcription factor only in FoxP-iBpositive cells. At the same time, the insertion also dis- rupts the FH box DNA-binding domain of the FoxP gene, putatively preventing the FoxP protein to act as a transcription factor, effectively mutating the gene for this function.
Observing Gal4 expression with different green fluorescent proteins (GFPs) under control of the UAS promoter (to which Gal4 binds), revealed thatFoxP-iBis expressed throughout the whole development of the fly, from embryo (data deposited at doi:10.6084/m9.figshare.12607652) to adult, in both brain and ventral nerve cord (VNC) (figure 1b). In 3rd instar larvae, we observe expression in the central brain (but not in the optic lobes) and in the anterior portion of the VNC. In the adult ner- vous system, the main neuropil expression domains comprise protocerebral bridge, gnathal ganglia (suboesophageal zone), vest, saddle, noduli and superior medial protocerebrum. GFP- positive cell body clusters could be found in the cortex of the central brain and around the optic lobes (figure 1b).
We next validated the expression pattern of ouriB-specific driver line to the staining of an available isoform-unspecific
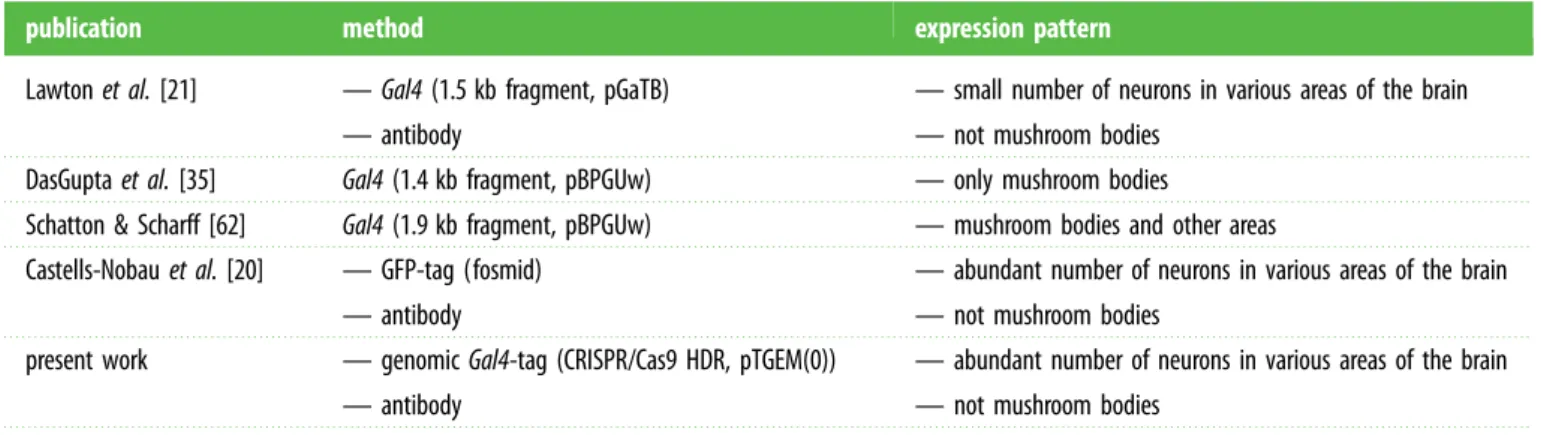
polyclonal antibody [21]. We observed complete colocaliza- tion of the driver line with the antibody staining in both larvae and adults, i.e. there were no GFP-positive cells that were not also labelled by the FoxP antibody (figure 1c). The cells only stained for the FoxP antibody and not for GFP are presumably cells expressing the other FoxP isoforms (FoxP-iAandFoxP-iIR, figure 4). Notably, in contrast to pre- vious reports [34,35] but consistent with [20], we did not detect anyFoxPexpression in mushroom body (MB) neurons, neither with our driver line, nor with the antibody.
Postulating that our transgene disrupted expression of the FoxPgene, we measured mRNA levels of all three isoforms with RT-qPCR (figure 1d). With one of the primers placed over the Gal4 insertion site, we observed approximately half the wild-typeFoxP-iBexpression levels in heterozygous animals, while wild-typeFoxP-iBexpression was essentially abolished in the homozygous transgenes. We did not observe any significant changes in the other two isoforms. However, this disruption of theFoxP-iBisoform did not have an effect on the development of theFoxP-positive neurons, as both het- erozygous and homozygous FoxP-iB-Gal4 mutants showed the same number of GFP-labelled cell nuclei (data deposited at doi:10.6084/m9.figshare.12932705).
3.2. FoxP-iB is expressed in a variety of neurons, but not glia
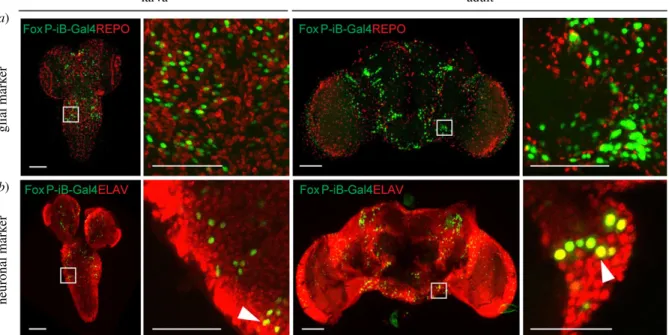
With FoxP involved in learning and expression patterns suggesting neuronal expression (figure 1), we investigated whether the observed expression was exclusively neuronal, or if there were alsoFoxP-iBexpressing glial cells. Therefore, we stained 3rd instar larva and adult brains with antibodies against ELAV (neuronal marker) and REPO (glial marker). At both developmental stages, the two stainings reveal exclusive FoxP-iB-mediated GFP colocalization with ELAV without any colocalization with REPO (figure 2a,b; raw data deposited at doi:10.6084/m9.figshare.12607706), suggesting thatFoxP-iBis expressed exclusively in neurons. These data are consistent with results published previously [20,36], validating the methods employed here.
We next investigated in more detail the types of neurons in whichFoxP-iB is expressed. Using a variety of antibodies (figure 3; raw data deposited at 10.6084/m9.figshare.12607712) used as markers for different neuronal cell types we detected FoxP-iBexpression in most of the cell types investigated. For technical reasons, we stained adult brains only with the anti- TH antibody, while the remaining markers were used on larval nervous systems. Extensive colocalization was observed with p-SMAD1/5 (a motor neuron marker) in the VNC but not in the central brain (CB) (figure 3a). SomeFoxP-iBneurons were positive for ChAT (cholinergic) or GABA (inhibitory) both in the VNC and in the CB (figure 3b,c). Finally, a few FoxP-iBpositive neurons were found to colocalize with tyrosine hydroxylase (dopaminergic neurons) in the CB only (figure 3d).
These data are consistent with the study performed by Schatton et al.[37] in honeybees where they found colocalization between AmFoxP-positive neurons and GABAergic, cholinergic and monoaminergic markers. No colocalization was instead found in photoreceptor cells stained with Chaoptin (data deposited at doi:10.6084/m9.figshare.12607643), a marker for photoreceptor cells [38].
royalsocietypublishing.org/journal/rsobOpenBiol.10:200295
6
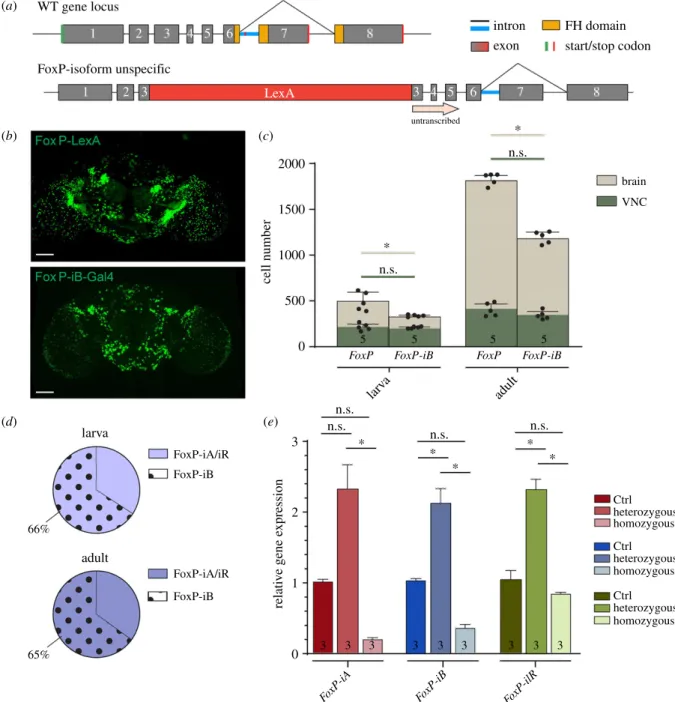
3.3. FoxP-iB is expressed in a subset of FoxP-expressing neurons
As the antibody staining against the FoxP protein indicated more cells expressing FoxP than our FoxP-iB-specific driver line was reporting (figure 1b), we created a second driver line, designed to drive expression in all FoxP cells, irrespective of isoform. We inserted a sequence for the bacterial LexA [39]
transcription factor into exon 3 (figure 4a; raw data deposited at doi:10.6084/m9.figshare.12607730). Comparing Stinger- GFPexpression from each driver line revealed a more expan- sive pattern for the isoform-unspecific driver (figure 4b), one that matches very well with the FoxP antibody staining (figure 1b). This visual impression was corroborated by a quantification of stained nuclei comparing between both dri- vers (figure 4c). This quantification allowed us to trace the proliferation of FoxP cells from around 500 in 3rd instar larvae to around 1800 in 3 day-old adults. By contrast, there are only about 300 cells expressingFoxP-iBin the 3rd larval instar and only around 1300 in 3 day-old adults. We noticed that the largest differences in terms of cell number between FoxP-LexA and FoxP-iB-Gal4 flies (both larvae and adults) were found in the CB, while the VNC numbers differed con- siderably less. Taken together, in 3rd instar larvae and in 3 day-old adults, 66% and 65%, respectively, of the total number of FoxP neurons in the Drosophila nervous system expressFoxP-iB.As with our previous insertion, also this one was expected to disrupt expression of theFoxPgene. To inves- tigate the extent of this disruption on the mRNA level, we again performed RT-qPCR. As expected, this insertion affected all isoforms. In heterozygous flies, the expression level was increased, while in homozygous flies it was decreased (figure 4e). It is important to note that here, in contrast to the FoxP-iB insertion, all primers are binding sequences down- stream of the insertion site (figure 1a,d) and so are amplifying all transcripts, with or without the insertion. Poss- ibly, the FoxP protein is involved in its own regulation such
that in heterozygotes, the missing gene copy leads to a com- pensatory increase in transcription rate, but in homozygous mutant animals without any FoxP protein, only basal expression levels remain.
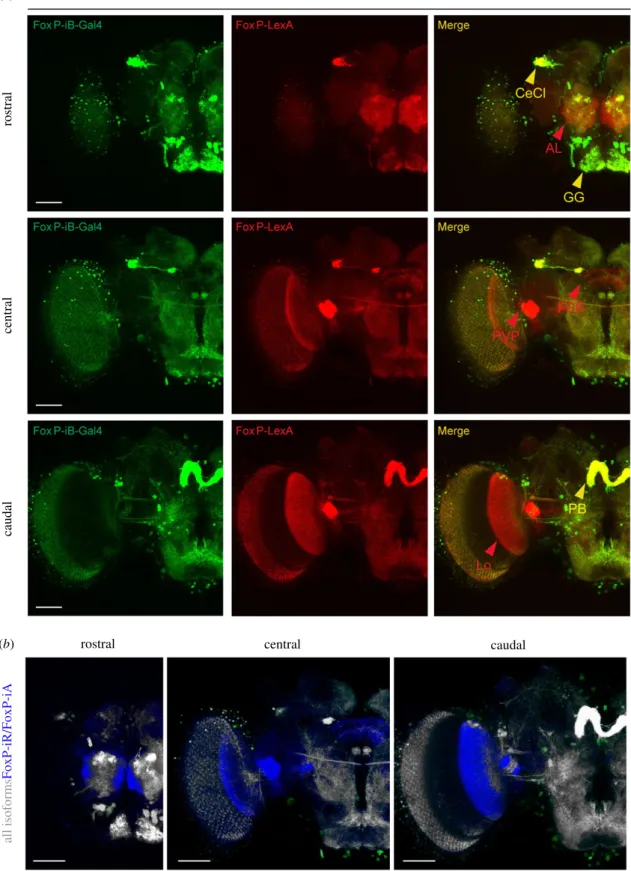
In order to directly compare the expression patterns of our two driver lines, we used them to drive reporter genes fluores- cing at different wavelengths (i.e.LexAop-RFP;UAS-CD8-GFP) and analysed their patterns in adults (figure 5; raw data depos- ited at doi:10.6084/m9.figshare.12607763). In this way, we labelled all FoxP-expressing neurons red and neurons that specifically expressedFoxP-iBgreen. We used the‘Colocaliza- tion Threshold’ tool from ImageJ, which computes false colours to enhance the comparison between the two driver lines and let the differences stand out (see Material and methods). The other two isoforms are expressed in additional areas (the antennal lobe, the lobula, the fan-shaped body and the posterior ventrolateral protocerebrum) compared toFoxP- iBexpression (figure 5a, red arrowheads; figure 5b, blue areas).
We also crossed thisFoxP-LexAline withLexAop-RFP-UAS- CD8-GFP and Tdc2-Gal4 to investigate any potential tyraminergic or octopaminergic FoxP neurons, but despite a close proximity between the two cell types, no colocalization was found (data deposited at doi:10.6084/m9.figshare.12607670).
3.4. FoxP-iB knock-out flies show a multitude of behavioural abnormalities
Mutations in the FoxP gene do not only affect operant self-learning, for instance, different alleles also affect flight per- formance and other locomotion behaviours to different degrees [18,20,21]. Because of the FoxP pleiotropy affecting various innate motor behaviours independently from motor learning, we turned to Buridan’s paradigm [30,31] as a powerful tool to measure several locomotor variables. Buridan’s paradigm allows us to test a broad panel of behavioural parameters cov- ering temporal parameters such as speed or general activity (a)
(b)
adult larva
neuronal markerglial marker
Figure 2.Only neurons, not glia, are expressingFoxP-iBin theDrosophilabrain. Immunohistochemistry onFoxP-iB-Gal4 > Stinger-GFPflies with REPO (glia,a) and ELAV (neurons,b) markers. Note the lack of colocalization ofFoxP-iBdriven GFP with the glial marker in both 3rd instar larvae and adult brains (a). By contrast, exclusive colocalization ofFoxP-driven GFP with the neuronal marker was observed in both developmental stages (white arrowheads indicate typical examples). Scale bars: 50 µm.
royalsocietypublishing.org/journal/rsobOpenBiol.10:200295
7
time and spatial parameters such as the straightness of a fly’s trajectory (meander) or the degree to which the animal is head- ing towards one of the two vertical landmarks (stripe fixation;
figure 6a).
With our insertions constituting novel alleles impairing FoxP expression (figures 1 and 4), we started by testing the heterozygous and homozygous driver strains without any effectors.
Consistent with previous findings of impaired locomotor behaviour inFoxPmanipulated flies [18,20,21] and the qPCR results showing reduced FoxP expression (figure 1d), our
FoxP-iB-Gal4insertion shows abnormalities in Buridan’s para- digm both in temporal and in spatial parameters (figure 6; raw data deposited at doi:10.6084/m9.figshare.12607769). While the homozygous flies walked more slowly, spent more time at rest and fixed the stripes less strongly than wild-type control flies, heterozygous flies only differed from wild-type flies in their stripe fixation (figure 6c). With different effect sizes in each parameter, we selected two representative parameters each for the temporal and the spatial domain, respectively, for comparison of all subsequent lines: walking speed, activity time, meander and stripe fixation.
(a)
(b)
(c)
(d)
central brain VNC
motor neuroncholinergicinhibitorydopaminergic
Figure 3.FoxP-iBis expressed in various types of neurons. Immunohistochemistry onFoxP-iB-Gal4 > CD8-GFPlarvae and adults using different antibodies. (a) Some of theFoxP-iBpositive neurons colocalize with p-SMAD1/5 in the VNC but not in the central brain. (b,c)FoxP-iBneurons positive for ChAT or GABA have been found in both the VNC and CB. (d) Only fewFoxP-iBneurons colocalize with TH and only in the CB. White arrowheads indicate examples of colocalization. Scale bars, 25 μm. (a–c) larvae; (d) adult flies.
royalsocietypublishing.org/journal/rsobOpenBiol.10:200295
8
Because our insertion is located in the same exon as the inser- tion in theFoxP3955mutant, we tested theFoxP3955mutant flies in Buridan’s paradigm and found changes in several temporal parameters, similar to those observed in our driver line (figure 6d). However, for the spatial parameters (stripe deviation and meander) only stripe fixation appears normal in these flies, the increased meander indicates that the flies have problems walking straight, despite clearly walking towards the stripes.
Thus, in addition to the deficits in operant self-learning and flight performance as reported previously [18], the FoxP3955 mutant flies are also deficient in several temporal and one spatial parameter of walking behaviour in Buridan’s paradigm. This walking phenotype is consistent with previous findings of walk- ing deficits associated withFoxPmanipulations [20,21], but was not detected in a previous publication where tests for walking deficits had been performed [35].
4. Knocking out all FoxP isoforms has similar effects as FoxP-iB knock-out
With such dramatic motor alterations when onlyFoxP-iB, which is expressed in about 65% of allFoxP-positive neurons (figure 4), is removed (figure 6), it is interesting to study the effects of removing the remaining isoforms for a completeFoxPknock- out. To avoid unwanted potential side-effects of expressing a different protein in its stead, we created a third fly line where the entire second exon is removed together with parts of exons 1 and 3. We validated this mutant with the polyclonal antibody we used before (figure 1). While the antibody detected the FoxP gene product in control flies, there was no signal in our homozy- gous knock-out flies (figure 7a,b; raw data deposited at doi:10.
6084/m9.figshare.12607796).
(a)
(b)
(d) (e)
(c) LexA
intron exon
FH domain start/stop codon
untranscribed
adult larva
larv a
adult WT gene locus
FoxP-isoform unspecific
cell number relative gene expression
1 2 3
1 2 3
4 5 6 7 8
3 4 5 6 7 8
n.s.
n.s.
n.s.
n.s. n.s. n.s.
* *
* *
* 5
3 3 3 3 3 3 3 3 3
5 5 5
*
*
brain VNC
Ctrl heterozygous homozygous Ctrl heterozygous homozygous Ctrl heterozygous homozygous
FoxP-ilR FoxP-iB
FoxP-iA
FoxP-iB
FoxP-iB FoxP-iA/iR
FoxP-iB
65%
66%
FoxP-iA/iR
FoxP-iB
FoxP FoxP
0
3
2
1
0 1000 2000
500 1500
Figure 4.FoxP-iBis expressed in a subset of FoxP-expressing neurons. (a) Schematic representation of the FoxP gene locus after LexA insertion. This is an isoform- unspecific construct with the insertion of a LexA sequence in exon 3. (b) Expression pattern ofFoxP-LexAandFoxP-iB-Gal4drivingStinger-GFP. (c) Cell counting performed with IMARIS onFoxP-LexAandFoxP-iB-Gal4 > Stinger-GFP(3rd instar larvae and 3 day-old adults) in both brain and VNC. (d) Pie charts that summarize the results from (c). (e) RT-qPCR on FoxP-LexA flies (control, hetero- and homozygous flies). Data are expressed as means ± s.d. in (c) and as means ± s.e.m. in (e).
*p< 0.005. Scale bars, 50 µm.
royalsocietypublishing.org/journal/rsobOpenBiol.10:200295
9
Analogous to the behavioural characterization in the FoxP-iB insertion line, we tested both heterozygous and homozygous FoxP-KO deletion mutants in Buridan’s para- digm (figure 7c–f). The results of this experiment closely resemble the ones from theFoxP-iB-Gal4 insertion line, with homozygous mutants being both significantly less active (figure 7c) and fixating the stripes less strongly than the hetero- zygous mutants and the wild-type controls (figure 7d,e). For this allele, the heterozygousFoxP-KO mutants show higher
values for all temporal parameters compared to the wild- type controls, while there is no difference in stripe deviation.
This trend was already observed in FoxP-iB mutants but failed to reach statistical significance. Thus, the FoxP-KO allele exhibits differential dominance, with recessive modes of inheritance in some traits and, e.g. overdominance in others. A direct comparison of the data from the two homozy- gous alleles (FoxP-iB and FoxP-KO) showed no significant differences (figure 7f). Thus, removing the otherFoxPisoforms adult brains
rostralcentralcaudal
rostral
all isoformsFoxP-iR/FoxP-iA
central caudal
(a)
(b)
Figure 5.Comparison ofFoxP-isoform expression patterns. (a) Confocal images of adult brains expressingFoxP-iB-Gal4 > CD8-GFP(green) andFoxP-LexA > CD8-RFP (red). (b) Difference rendering (blue) indicating areas expressing only non-iB isoforms. AL, antennal lobe; PVP, posterior ventrolateral protocerebrum; FSB, fan-shaped body; Lo, lobula; cecl, cell cluster; GG, gnathal ganglion; PB, protocerebral bridge. Scale bars, 50 µm.
royalsocietypublishing.org/journal/rsobOpenBiol.10:200295
10
camera fluorescent bulbs
computer running the BuriTrack software platform: Ø = 117 mm
arena: Ø = 293 mm
30 20 1000 8
4 3 2 1 0 800
600 400 200 0 15
10 5 0
n.s. n.s. n.s.
n.s. n.s.
* *
*
* *
*
untranscribed
* 20
60
15
15 1000 2.5 60
40
20
0 2.0
1.5 1.0 0.5 0 800
600 400 200 0
* * n.s.
10
5
0 20
median speed (mm s–1) distance travelled (mm) activity time (s) meander (º*s mm–1) stripe deviation (º)
10 5 0
60 40 20 0 –20 –40 –60
60 transition plots
40 20 0 –20 –40 –60
60 40 20 0 –20 –40 –60 –60 –40–20 0 20 40 60
WTB
–60 –40–20 0 20 40 60 FoxP-iB/+
–60 –40–20 0 20 40 60 FoxP-iB/FoxP-iB y
x
*
*
relative transition frequency
0 >95% qantile
* *
* 40
20
0
stripe deviation (º)
10
0 21 20 21
18 18
WTB FoxP-iB/+
FoxP-iB/FoxP-iB
WTB FoxP-iB/+
FoxP-iB/FoxP-iB
WTB FoxP-iB/+
FoxP-iB/FoxP-iB
WTB FoxP-iB/+
FoxP-iB/FoxP-iB
WTB
CS CS
Fox P3955
Fox
P3955 CS
Fox
P3955 CS
Fox
P3955 CS
Fox P3955 FoxP-iB/+
FoxP-iB/FoxP-iB
median speed (mm s–1) distance travelled (m) activity time (s) meander (º*s mm–1)
(a)
(b) (c)
c'
c"
(e)
(d)
Figure 6.(Caption continued.)
royalsocietypublishing.org/journal/rsobOpenBiol.10:200295
11
had few effects beyond the consequences of removing only FoxP-iBalone.
4.1. Local and conditional FoxP knock-out (FoxP-cKO)
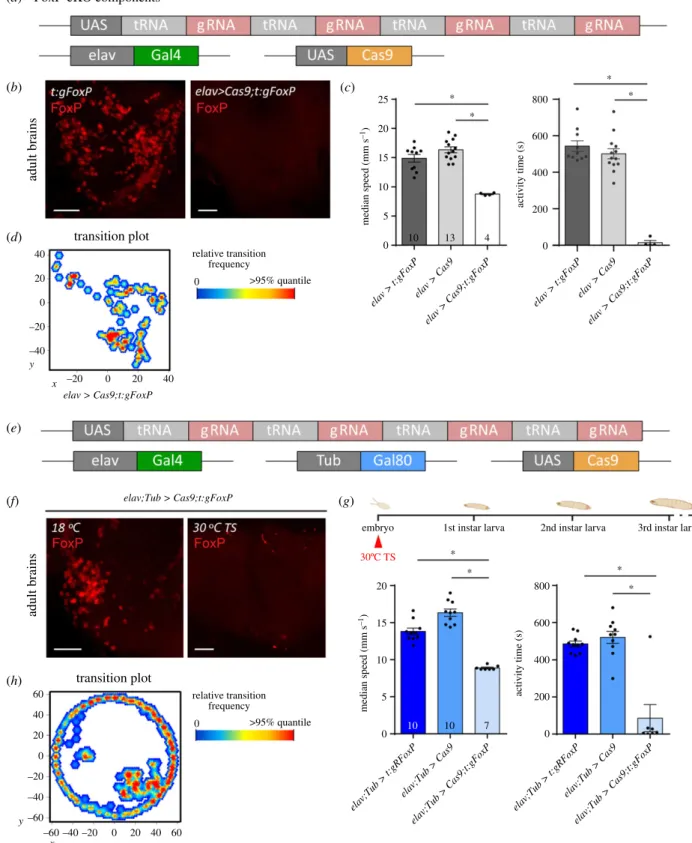
Given the patchy expression pattern of FoxP in the fly’s nervous system (figures 1–5) and the grave consequences for behaviour in Buridan’s paradigm if it is manipulated (figures 6 and 7), we sought to investigate when and where FoxPis required for normal walking behaviour. To this end, we designed a fourth fly strain which carries a UAS- controlled effector (figure 8a; raw data deposited at doi:10.
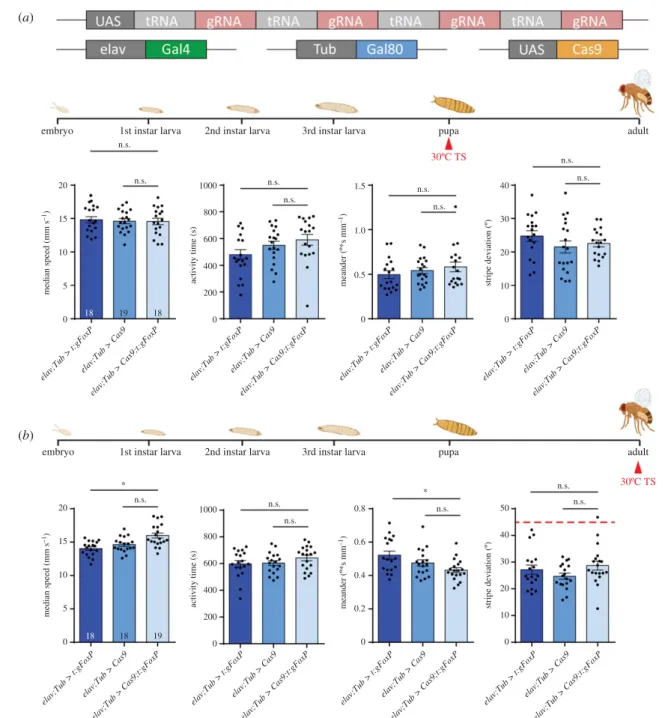
6084/m9.figshare.12607805). The four guide RNAs (gRNA) each target a different section of theFoxPgene (see Material and methods). If expressed together with the endonuclease Cas9, this effector efficiently mutates the targeted gene [26,40]. We validated this approach by driving both our gRNAs as well as Cas9 using the pan-neuronal elav-Gal4 driver and monitoringFoxP expression with the FoxP anti- body used before (figure 8b). Flies with this pan-neuronal excision of the FoxP gene (FoxP-cKO) were also tested in Buridan’s paradigm and showed even more severe impairments than flies homozygous for a constitutive deletion of the gene (figure 8c). In fact, the mutated flies walked so little, that analysis of spatial parameters was not meaningful (figure 8d). To allow for temporal control of transgene expression, we also validated the use of the temperature-sensitive suppressor of Gal4, Gal80ts (figure 8e). The constitutively expressed Gal80tsprevents Gal4 from activating transcription of the UAS-controlled transgenes until the temperature is shifted from 18°C to 30°C, at which point the repressor becomes inactivated and Gal4-mediated transcription commences [23,24]. Using this system to drive gRNA/Cas9 expression for 12 h in the embryo phenocopies both the mutant and the local phenotypes not only on the protein (figure 8f), but also on the behavioural level (figure 8g,h). In both experiments, the effects of the manipula- tions were so severe, that it was not possible to reach the target sample size of 18.
4.2. Local FoxP-KO: brain regions and neuron types
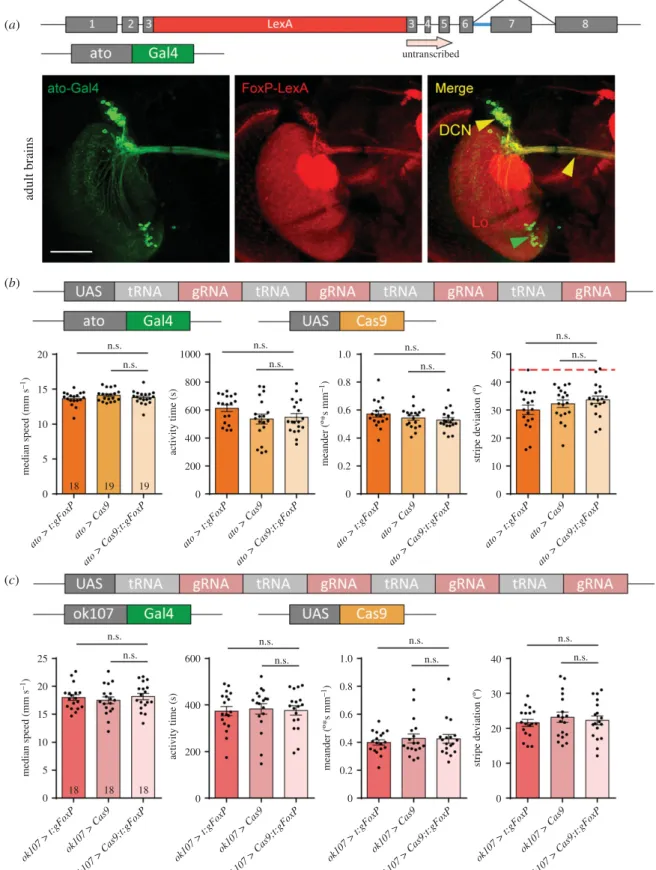
Recently, Linneweberet al.[41] described the consequences of silencing dorsal cluster neurons (DCNs) on stripe fixation behaviour in Buridan’s paradigm. TheFoxP-iBexpression pat- tern suggests that at least some of these DCNs express FoxP (figure 1). Comparing our isoform-unspecific FoxP-LexA expression pattern with that of the atonal-Gal4 line used to drive expression in DCNs [42], we observed substantial overlap (figure 9a; raw data deposited at doi: 10.6084/m9.fig- share.12607811). Therefore, we used ato-Gal4 to excise the FoxPgene specifically in DCNs. Remarkably, this manipulation
did not have any effect on the flies’behaviour in Buridan’s paradigm (figure 9b).
The insect MBs are not only known as a centre for olfactory learning and memory [e.g. 43–50], they are also involved in the temporal and spatial control of locomotor activity [e.g. 51–60].
In addition, Castells-Nobau et al. [20] found a subtle structural phenotype in a sub-section of the MBs without detectableFoxP expression in the MB Kenyon cells themselves. Finally, there are two reports that expressing anti-FoxPRNAi constructs exclu- sively in the MBs can have behavioural effects [34,35]. For these reasons, despite neither [20] nor us being able to detect any FoxP expression in the MBs (and current RNAi constructs fail to knock downFoxPmRNA, see below), we deleted the FoxPgene from MB Kenyon cells using theok107-Gal4driver and tested the flies in Buridan’s paradigm. We did not detect any differences to control flies in these experiments (figure 9c).
There are two reasons for knocking out FoxP in motor neurons, besidesFoxPexpression there (figure 3): first, net- works of motor neurons in the VNC control movement patterns and walking is directly affected by our manipulations so far (figures 6 and 7). Second, motor neurons were shown to be important for the type of operant self-learning that also requires FoxP[61]. Driving expression of gRNA/Cas9 with either of two motor neuron-specific driver lines (D42-Gal4 and C380-Gal4) led to a significant alteration in locomotor activity in Buridan’s paradigm, both for spatial and for tem- poral parameters (figure 10a,b; raw data deposited at doi:10.
6084/m9.figshare.12607823).
Perhaps the most prevalent FoxP expression can be observed in the protocerebral bridge (figure 1). The driver line cmpy-Gal4 targets the protocerebral bridge specifically and drives expression inFoxP-positive neurons (figure 10c).
Removing theFoxPgene exclusively in these neurons led to a significant reduction of locomotor activity (figure 10d) as well as a reduction in stripe fixation and to more tortuous tra- jectories (figure 10e). In fact, the stripe deviation increased to an extent that it can no longer be distinguished statistically from a random walk at the 0.5% level (Wilcoxon signed rank test against 45°,V= 33,p= 0.02).
4.3. Conditional FoxP-KO: developmental stages
With FoxP being a transcription factor active throughout development and particularly important during pupal devel- opment [20,62], we knocked out FoxP in all neurons by adding the Gal4 repressor Gal80ts to our pan-neuronal FoxP-cKO (figure 11a; raw data deposited at doi:10.6084/
m9.figshare.12607838) and treating the flies with a 48 h 30°C heat treatment during the early pupal stage. This regime did not affect walking behaviour in Buridan’s paradigm (figure 11b). Shifting the temperature treatment to immediately after eclosion also did not affect the flies’
Figure 6.(Continued.)FoxP-iBmutant flies are impaired in several parameters in Buridan’s paradigm. (a) Schematic of Buridan’s paradigm. A fly with shortened wings is put in the centre of a platform inside a circular arena with two opposing black stripes on the walls. A camera records the position of the fly and the BuriTrack software stores the position data for later analysis with CeTrAn. (b) Temporal parameters. Median speed denotes the instantaneous speed when a fly is walking. Activity time denotes the time spent walking. Distance traveled measures the distance covered by the fly during the experiment. Non-parametric tests for walking speed and activity time. (c) Spatial parameters. Meander is a measure for the tortuosity of a fly’s trajectory. Stripe deviation measures the angular deviation from heading towards the centre of the stripe to which the fly is oriented. Red dashed line indicates angular stripe deviation of a random walk. Non-parametric test for meander. (d) The transition plots show the distribution of the platform locations that the flies transitioned through. (e) Temporal and spatial parameters from CS andFoxP3955mutant flies in Buridan’s paradigm are largely consistent with those from theFoxP-iB knock-out. Non-parametric test for meander. *p< 0.005.
royalsocietypublishing.org/journal/rsobOpenBiol.10:200295
12