A TLAS-CONF-2014-018 14/05/2014
ATLAS NOTE
ATLAS-CONF-2014-018
May 12, 2014
Minor revision: May 14, 2014
Tagging and suppression of pileup jets with the ATLAS detector
The ATLAS Collaboration
Abstract
The suppression of pileup jets has been a crucial component of many physics analyses using 2012 LHC proton-proton collisions. In ATLAS, tracking information has been used to calculate a variable called the jet-vertex-fraction, which is the fraction of the total momen- tum of tracks in the jet which is associated with the primary vertex. Imposing a lower limit on this variable rejects the majority of pileup jets, but leads to hard-scatter jet efficiencies that depend on the number of reconstructed primary vertices in the event (N
Vtx). In this note, new track-based variables to suppress pileup jets are developed in such a way that the result- ing hard-scatter jet efficiency is stable as a function of N
Vtx. A multivariate combination of two such variables called the jet-vertex-tagger (JVT) is constructed. The modeling of JVT is tested in Z(→ µµ) + jets as well as in semileptonic t¯t events. The e ffi ciencies of di ff er- ent JVT criteria are measured in data and compared to simulation. In addition, it is shown that jet-vertex association can be applied to large-R jets, providing a track-based grooming technique that is as powerful as calorimeter-based trimming but based on complementary tracking information. Finally, the performance of track-based grooming is compared with the recently proposed jet cleansing algorithm.
Revised figure 18 with respect to the version of May 12, 2014
c
Copyright 2014 CERN for the benefit of the ATLAS Collaboration.
Reproduction of this article or parts of it is allowed as specified in the CC-BY-3.0 license.
1 Introduction
At the Large Hadron Collider (LHC) the collisions of proton (p) bunches result not only in hard-scatter (signal) pp interactions, but also in additional collisions accompanying the signal. Such additional low transverse momentum pp collisions are referred to as pileup interactions. We differentiate between in- time and out-of-time pileup. While in-time pileup arises from additional pp interactions in the current bunch-crossing, out-of-time pileup refers to energy deposits in the ATLAS calorimeter [1] from previous and following bunch crossings relative to the triggered event. For this note, in-time and out-of-time pileup will be referred to collectively as pileup.
The additional transverse energy flow from pileup interactions is typically subtracted on average from the signal interaction of interest. Local fluctuations in the pileup activity, however, may result in spurious pileup jets. In Ref. [2] it was shown that pileup jets can be e ff ectively removed by a minimal jet-vertex-fraction (JVF) requirement. The JVF variable is defined as the scalar transverse momentum ( p
T) sum of the tracks that are associated with the jet and originate from the hard-scatter vertex divided by the scalar p
Tsum of all associated tracks:
JVF =
P
k
p
trkT k(PV
0) P
l
p
trkT l(PV
0) + P
n≥1
P
l
p
trkT l(PV
n) (1)
Here, PV
0is the hard-scatter vertex (see section 2.2) and PV
j, j ≥ 1 corresponds to primary vertices due to pileup interactions in the same bunch crossing. JVF is bound between 0 and 1, but a value of −1 is assigned to jets with no associated tracks. It measures the fractional p
Tfrom tracks associated with the hard-scatter vertex. As the denominator of JVF increases with the number of reconstructed primary vertices in the event (N
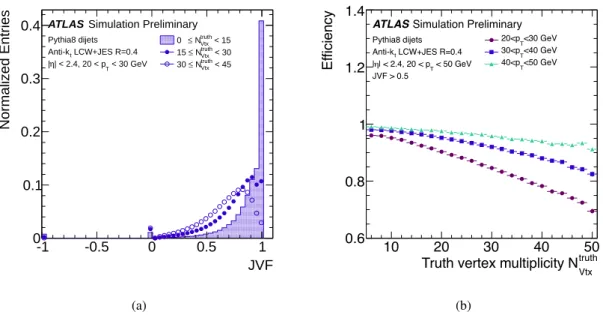
Vtx1), due to an increase in the number of pileup tracks associated with the jet, the mean JVF for signal jets is shifted to smaller values, as shown in Fig. 1(a). The explicit pileup dependence of JVF results in an N
Vtxdependent jet e ffi ciency when a minimal JVF criterion is imposed to reject pileup jets. This effect is illustrated in Figure 1(b) for jets in three different p
Tbins requiring JVF > 0.5.
In this note, new track-based variables are developed to suppress pileup jets in such a way that the resulting hard-scatter jet efficiency is stable as a function of N
Vtx. The note is organized as follows.
In Section 2 a brief description of the ATLAS experiment is presented and the object reconstruction and event selection is discussed. Two new track-based variables are introduced in Section 3, and in Section 4 a multivariate combination of these two variables, called the jet-vertex-tagger, is derived and its performance is characterized. The modeling of the jet-vertex-tagger is validated with data in Section 5.
In Section 6 the application of the jet-vertex-tagger is illustrated in a study of the jet multiplicity in
Z(→ µµ)+jets events as well as for a jet-veto efficiency study in simulated H → ZZ events, where the
Higgs boson H is produced via vector-boson fusion (qq
0H). Section 7 contains a discussion of a novel track-based grooming technique for large-R jets, where jet-vertex association is used to mitigate pileup effects. Finally, Section 8 contains the conclusions.
2 Object definition and event selection
2.1 The ATLAS detector
The results presented in this paper are based on an integrated luminosity of 20.3 fb
−1of pp collisions recorded with the ATLAS detector at a center-of-mass energy of 8 TeV during the 2012 data taking.
1 ffi µ
JVF
-1 -0.5 0 0.5 1
Normalized Entries
0 0.1 0.2 0.3 0.4
< 15
truth
NVtx
≤ 0
< 30
truth
NVtx
≤ 15
< 45
truth
NVtx
≤ 30
ATLAS Simulation Preliminary
Pythia8 dijets LCW+JES R=0.4 Anti-kt
< 30 GeV
| < 2.4, 20 < pT
η
|
(a)
truth
Truth vertex multiplicity N
Vtx10 20 30 40 50
Ef ficien cy
0.6 0.8 1 1.2 1.4
<30 GeV 20<pT
<40 GeV 30<pT
<50 GeV 40<pT
ATLASSimulation Preliminary
Pythia8 dijets LCW+JES R=0.4 Anti-kt
< 50 GeV
| < 2.4, 20 < pT
| JVF > 0.5
(b)
Figure 1: (a) The JVF distribution for hard-scatter jets (see Section 2.2) in simulated dijet events for di ff erent bins in truth vertex multiplicity N
Vtxtruth. (b) The e ffi ciency of a JVF > 0.5 requirement for hard- scatter jets as a function of N
Vtxtruth, for three different jet p
Tbins.
ATLAS is a cylindrical multi-purpose particle detector hermetic in azimuth for a pseudorapidity
2range of |η| < 4.9. It comprises an inner tracking detector, electromagnetic and hadronic sampling calorimeters, and an air-toriod muon system. The inner detector, which includes the silicon pixel detector, a silicon microstrip detector and a transition radiation tracker, covers a pseudorapidity range |η| < 2.5 and is im- mersed in a 2 T axial magnetic field produced by a superconducting solenoid. Surrounding the solenoid there are finely-segmented liquid argon and iron-scintillator calorimeters providing precise energy mea- surements. Outside the calorimetry there is a muon spectrometer immersed in a magnetic field provided by three large toroid magnets. A multi-level trigger system of dedicated hardware and software filters is used to select pp collisions. A detailed description of the ATLAS detector can be found elsewhere [1].
2.2 Object reconstruction
The reconstruction and definition of physics objects used in this analysis is based on Ref. [2], where more details can be found.
Vertices and tracks
The event hard-scatter primary vertex is defined as the one reconstructed vertex with the largest P p
2Tof constituent tracks. Tracks are selected with p
T> 0.5 GeV and are further required to pass quality criteria designed to reject poorly measured and fake tracks. A careful association of tracks to vertices is crucial to optimize the separation between pileup and hard-scatter jets. We use the following two-step procedure.
First, tracks are assigned to vertices based on the track-to-vertex association resulting from the vertex reconstruction [3]. Secondly, tracks that have a |z
0| < 3 mm with respect to the hard-scatter primary
2
ATLAS uses a right-handed coordinate system with its origin at the nominal interaction point (IP) in the centre of the
detector and the
z-axis along the beam pipe. Thex-axis points from the IP to the centre of the LHC ring, and they-axis pointsupward. Cylindrical coordinates (r, φ) are used in the transverse plane,
φbeing the azimuthal angle around the beam pipe. The
pseudorapidity is defined in terms of the polar angle
θas
η=−ln tan(θ/2).vertex and are not associated with any vertex after the first step are then assigned to the hard-scatter primary vertex. This additional step is important for jets that are initiated by heavy flavor quarks, where tracks may arise from hadron decays in flight. The details of this two-step track-to-vertex association are discussed in Appendix A. Tracks originating from the hard-scatter primary vertex and from pileup vertices are then assigned to jets using a technique known as ghost association [4] which is described in Ref. [2].
Jets
Calorimeter jets are reconstructed from topological clusters [5] using the local cluster weighting (LCW) algorithm [6]. F astjet 2.4.3 is used to reconstruct anti-k
t[7] jets with a distance parameter R = 0.4.
Similarly, truth jets are reconstructed as anti-k
tR = 0.4 jets from stable truth particles in the final state of the simulated hard-scatter interaction. Calorimeter jets are calibrated using pileup subtraction followed by a jet-energy-scale (JES) response correction, as described in detail in Refs. [2, 8]. Unless noted otherwise, jets are required to have 20 < p
T< 50 GeV and to be within |η| < 2.4 so that their charged particles are within the coverage of the inner tracking detector. Large-R jets are reconstructed from LCW topological clusters using the anti-k
talgorithm with R = 1.0. The jet mass is defined as the mass deduced from the four-momentum sum of all jet constituents.
Similarly to Ref. [2], pileup and hard-scatter jets are defined for simulated events by a matching criterion to truth jets reconstructed from stable, interacting
3particles in the final state of the hard-scatter interaction. Signal jets are matched within ∆ R = p
(∆ η)
2+ (∆ φ)
2< 0.3 to a truth jet with p
T> 10 GeV
4. Unless noted otherwise, pileup jets are required to have a minimal ∆ R > 0.6 from any truth jet with
p
T> 4 GeV. The pileup jet rates as a function of jet p
Tand η are shown in Appendix B.
2.3 Samples and event selection
For this study, single muon triggers with a p
Tthreshold of 24 and 36 GeV (isolation criteria are applied at the lower threshold) were used in data and simulation to obtain an event selection dominated by either Z(→ µµ) + jets or t¯t events.
Reconstructed events containing an opposite-sign di-muon pair consistent with the Z-boson mass constraint are selected for the sample of Z(→ µµ)+jets events. A sample of t¯t → (W → µν)(W → qq
0)b¯b events is obtained with a purity of at least 90% by adopting the event selection from Ref. [9]. Most importantly, events are required to contain exactly one isolated p
T> 25 GeV muon with |η| < 2.4, have missing transverse energy E
Tmiss> 20 GeV and two p
T> 25 GeV b-tagged jets identified using the 70% working point of the “MV1” b-tagging discriminant [10]. Furthermore, there must be at least two additional jets with p
T> 25 GeV that have a dijet invariant mass consistent with the W-boson mass.
For the performance studies based on simulated QCD dijet events in Sections 3 and 4, the recon- structed hard-scatter primary vertex is required to lie within | ∆ z| < 0.1 mm of the generated hard-scatter vertex.
Simulated t¯t events were generated with PowHeg V1.0 [11, 12, 13] using the PDF set CT10 [14].
PYTHIA 6.4 [15] was used for fragmentation and hadronization with the Perugia2011C [16] tune that employs the LO CTEQ6L1 PDF set [17]. The single top s- and Wt-channel production is modelled in the same way, while for the t-channel production AcerMC [18] and the CTEQ6L1 PDF set are used, interfaced with PYTHIA using the Perugia2011C tune. S herpa 1.4.1 [19] is used for the matrix-element
3
Truth particles are considered stable if their decay length
cτis greater than 1 cm. A truth particle is considered to be interacting if it is expected to deposit most of its energy in the ATLAS calorimeters; muons and neutrinos are considered to be non-interacting.
4 >
generation as well as for the modeling of the parton shower and hadronization of Z(→ µµ)+jets events.
Additionally, an alternative sample of Z(→ µµ) + jets events is generated with P ow H eg V1.0 and showered with Pythia8 [20]. W +jets production is based on A lpgen V2.14 [21], with the parton shower modelled with PYTHIA 6.4 and the Perugia2011C tune. QCD dijet events are produced with the P ythia 8 generator (version 8.160) using the CT10 PDF set and the AU2 CT10 underlying-event tune [22]. The e ff ect of pileup jet suppression is studied in an example physics case using a sample of qq
0→ Hqq
0, H → ZZ.
These events are produced using P ow H eg interfaced with P ythia 8, using the CT10 PDF set and the AU2 CT10 underlying-event tune. The use of tracking information to suppress pileup jets in large-R jets is studied using a simulated sample of W
0→ WZ → qqqq events with a W
0mass of 1 TeV, generated with P ythia 8 and the MSTW 2008 PDF set [23].
For all samples of simulated events, the e ff ect of in-time as well as out-of-time pileup is simulated using minimum-bias events generated with Pythia8 to reflect the pileup conditions during the 2012 data- taking period. All generated events were processed with a detailed simulation of the ATLAS detector response [24] based on geant 4 [25] and subsequently reconstructed and analyzed in the same way as the data.
3 New variables
Two new variables to separate hard-scatter (HS) from pileup (PU) jets are introduced: corrJVF, which is a pileup-corrected JVF variable, and R
pT, which combines both calorimeter and tracking information.
3.1 corrJVF
The quantity corrJVF is a variable similar to JVF, but corrected for the N
Vtxdependent average scalar sum p
Tfrom pileup tracks associated with a jet (hp
PUTi). It is defined as
corrJVF =
P
k
p
trkT k(PV
0) P
l
p
trkT l(PV
0) +
Pn≥1P(k·nlpPUtrkTl(PVn) trk). (2)
where P
k
p
trkT k(PV
0) is the scalar p
Tsum of the tracks that are associated with the jet and originate from the hard-scatter vertex. The term p
PUT= P
n≥1
P
l
p
trkT l(PV
n) denotes the scalar p
Tsum of the associated tracks that originate from any of the pileup interactions. To correct for the linear increase of hp
PUTi with the total number of pileup tracks per event (n
PUtrk), we divide p
PUTin the corrJVF definition by (k · n
PUtrk) with k = 0.01. The total number of pileup tracks per event is computed from all tracks associated with vertices other than the hard-scatter vertex. The scaling factor k is roughly taken as the slope of hp
PUTi with n
PUtrk, but the resulting discrimination between hard-scatter and pileup jets is insensitive to the choice of k
5.
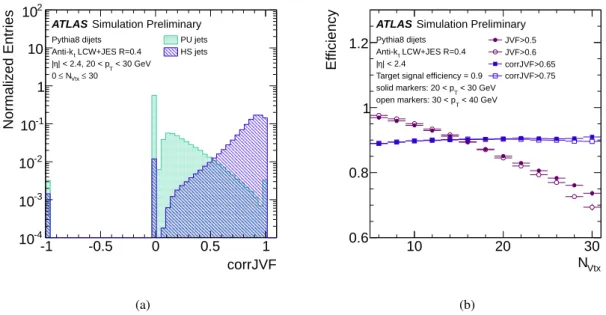
Figure 2(a) shows the corrJVF distribution for pileup and hard-scatter jets in simulated dijet events.
A value corrJVF = −1 is assigned to jets with no associated tracks. About 1% of hard-scatter jets with 20 < p
T< 30 GeV have no associated hard-scatter tracks and thus corrJVF = 0.
Figure 2(b) shows the hard-scatter jet e ffi ciency as a function of the number of reconstructed primary vertices in the event when imposing a minimal corrJVF or JVF requirement such that the N
Vtxinclusive efficiency is 90%. For the full range of N
Vtxconsidered, the hard-scatter jet efficiency after a selection based on corrJVF is stable at 90% ± 1%, whereas for JVF the e ffi ciency degrades by about 20%, from 97% to 75%. The choice of the scaling factor k in the corrJVF distribution does not a ff ect the stability of the hard-scatter jet efficiency with N
Vtx.
5
With this particular choice of
k, the resulting corrJVF shapes for hard-scatter and pileup jets are similar to the correspond-ing ones of JVF.
corrJVF
-1 -0.5 0 0.5 1
Normalized Entries
10
-410
-310
-210
-11 10 10
2PU jets HS jets
ATLAS Simulation Preliminary
Pythia8 dijets LCW+JES R=0.4 Anti-kt
< 30 GeV
| < 2.4, 20 < pT
η
|
≤ 30 NVtx
≤ 0
(a)
N
Vtx10 20 30
E ff ic ie n c y
0.6 0.8 1
1.2
JVF>0.5JVF>0.6 corrJVF>0.65 corrJVF>0.75
ATLAS Simulation Preliminary
Pythia8 dijets LCW+JES R=0.4 Anti-kt
| < 2.4 η
|
Target signal efficiency = 0.9 < 30 GeV solid markers: 20 < pT
< 40 GeV open markers: 30 < pT
(b)
Figure 2: (a) Distribution of corrJVF for pileup and hard-scatter jets with 20 < p
T< 30 GeV. (b) Primary-vertex dependence of the hard-scatter jet e ffi ciency for 20 < p
T< 30 GeV (solid markers) and 30 < p
T< 40 GeV (open markers) jets for fixed cuts of corrJVF (blue) and JVF (violet) such that the inclusive efficiency is 90%. The cut values imposed on corrJVF and JVF, which depend on the p
Tbin, are specified in the legend.
3.2 R
pTThe variable R
pTis defined as the scalar p
Tsum of the tracks that are associated with the jet and originate from the hard-scatter vertex divided by the fully calibrated jet p
T, which includes pileup subtraction:
R
pT= P
k
p
trkT k(PV
0) p
Tjet. (3)
R
pTis peaked at 0 and steeply falling for pileup jets, where no or only little p
Tfrom tracks from the hard-scatter vertex is expected. For hard-scatter jets, however, R
pThas the meaning of a charged p
Tfraction and its mean value and spread is larger than for pileup jets. Since R
pTinvolves only tracks that are associated with the hard-scatter vertex, its definition is at first order independent of N
Vtx. The R
pTdistributions for pileup and hard-scatter jets are shown in Figure 3(a). Figure 3(b) shows the hard-scatter jet e ffi ciency as a function of N
Vtxwhen imposing a minimal R
pTand JVF requirement such that the N
Vtxinclusive efficiency is 90%. For the full range of N
Vtxconsidered, the hard-scatter jet efficiency after a selection based on R
pTis stable at 90% ± 1%.
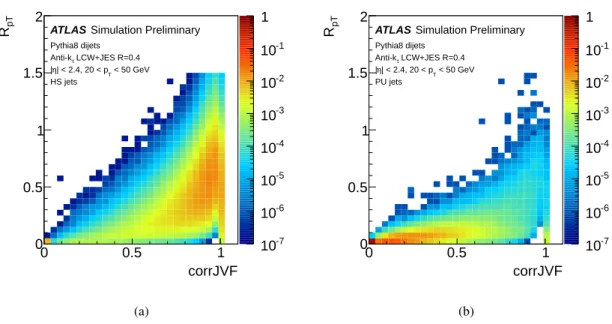
Figures 4(a) and 4(b) show the 2-dimensional correlation of R
pTand corrJVF for hard-scatter and
pileup jets, respectively. Hard-scatter jets are characterized by large corrJVF and large R
pT, whereas
pileup jets are concentrated at low R
pTand low corrJVF values. Jets with corrJVF = −1 (i.e. no associated
tracks) or R
pT> 1.5 are omitted in these plots. Most pileup jets (and about 1% of hard-scatter jets) have
no tracks that originate from the hard-scatter vertex and thus corrJVF = R
pT= 0.
R
pT0 0.5 1 1.5
Normalized Entries
10
-410
-310
-210
-11 10 10
2PU jets HS jets
ATLAS Simulation Preliminary
Pythia8 dijets LCW+JES R=0.4 Anti-kt
< 30 GeV
| < 2.4, 20 < pT
η
|
≤ 30 NVtx
≤ 0
(a)
N
Vtx10 20 30
E ff ic ie n c y
0.6 0.8 1
1.2
JVF>0.5JVF>0.6
>0.15 RpT
>0.2 RpT
ATLAS Simulation Preliminary
Pythia8 dijets LCW+JES R=0.4 Anti-kt
| < 2.4 η
|
Target signal efficiency = 0.9 < 30 GeV solid markers: 20 < pT
< 40 GeV open markers: 30 < pT
(b)
Figure 3: (a) Distribution of R
pTfor pileup and hard-scatter jets with 20 < p
T< 30 GeV. (b) Primary- vertex dependence of the hard-scatter jet e ffi ciency for 20 < p
T< 30 GeV (solid markers) and 30 < p
T<
40 GeV (open markers) jets for fixed cuts of R
pT(blue) and JVF (violet) such that the inclusive efficiency is 90%. The cut values imposed on R
pTand JVF, which depend on the p
Tbin, are specified in the legend.
corrJVF
0 0.5 1
pT
R
0 0.5 1 1.5 2
10
-710
-610
-510
-410
-310
-210
-11
ATLAS Simulation Preliminary
Pythia8 dijets LCW+JES R=0.4 Anti-kt
< 50 GeV
| < 2.4, 20 < pT
η
| HS jets
(a)
corrJVF
0 0.5 1
pT
R
0 0.5 1 1.5 2
10
-710
-610
-510
-410
-310
-210
-11
ATLAS Simulation Preliminary
Pythia8 dijets LCW+JES R=0.4 Anti-kt
< 50 GeV
| < 2.4, 20 < pT
η
| PU jets
(b)
Figure 4: 2-dimensional correlation of corrJVF and R
pTfor hard-scatter (a) and pileup (b) jets.
4 The jet-vertex-tagger
4.1 Derivation of the discriminant
A new discriminant called the jet-vertex-tagger (JVT) is constructed using R
pTand corrJVF as a 2- dimensional likelihood, based on a k-nearest neighbor (kNN) algorithm [26]. For each point in the two-dimensional corrJVF − R
pTplane, the relative probability for a jet at that point to be of signal type is computed as the ratio of the number of hard-scatter jets divided by the number of hard-scatter plus pileup jets found in a local neighborhood around the point using a training sample of signal and pileup jets with 20 < p
T< 50 GeV and |η| < 2.4. The local neighborhood is defined dynamically as the 100 nearest neighbors around the test point using a Euclidean metric in the R
pT− corrJVF space, where corrJVF and R
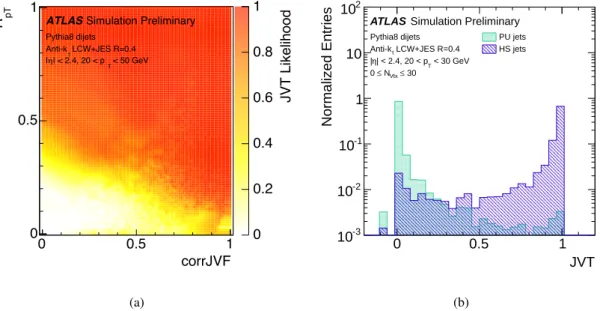
pTare rescaled so that the variables have the same width. Since only based on two variables, the kNN algorithm allows for a local and straightforward calculation of the relative signal probability, while largely avoiding statistical fluctuations in sparsely populated regions. The resulting 2-dimensional JVT likelihood is shown in Figure 5(a). In the following, the JVT value of a jet is calculated, based on its corrJVF and R
pTvalues, using the finely binned histogram in Figure 5(a) as a lookup table. The JVT distribution for hard-scatter and pileup jets with 20 < p
T< 30 GeV is shown in Figure 5(b). A value of JVT = −0.1 is assigned to jets with no associated tracks.
corrJVF
0 0.5 1
pT
R
0 0.5 1
JVT Likelihood
0 0.2 0.4 0.6 0.8
ATLASSimulation Preliminary
1
Pythia8 dijets LCW+JES R=0.4 Anti-kt
< 50 GeV
| < 2.4, 20 < pT
|
(a)
JVT
0 0.5 1
Normalized Entries
10
-310
-210
-11 10 10
2PU jets HS jets
ATLAS Simulation Preliminary
Pythia8 dijets LCW+JES R=0.4 Anti-kt
< 30 GeV
| < 2.4, 20 < pT
η
|
≤ 30 NVtx
≤ 0
(b)
Figure 5: (a) The 2-dimensional JVT likelihood as a function of corrJVF and R
pT. Jets with corrJVF = −1 (i.e. no associated tracks) are omitted in this figure. Jets with R
pT> 1 have JVT from 0.98 to 1 and are not included in the figure. (b) Distribution of JVT for pileup and hard-scatter jets with 20 < p
T< 30 GeV.
To test the sample dependence of JVT, the likelihood is also derived using a sample of 20 < p
T<
50 GeV jets in simulated Z( → µµ)+jets events. The performance of the JVT-based pileup jet suppression
(evaluated in terms of fake rate vs. efficiency curves) is found not to significantly depend on the sample
from which the likelihood is derived. These studies are reported in Appendix C.
4.2 Performance of the JVT-based pileup jet rejection
Figure 6(a) shows the fake rate versus e ffi ciency curves comparing the performance of the four variables JVF
6, corrJVF, R
pT, and JVT when selecting a sample of jets with 20 < p
T< 50 GeV, |η| < 2.4 in simulated dijet events. The figure shows the fraction of pileup jets passing a minimal JVF, corrJVF,
Efficiency
0.8 0.85 0.9 0.95
Fake Rate
10
-210
-1JVF corrJVF RpT
JVT
ATLASSimulation Preliminary
Pythia8 dijets LCW+JES R=0.4 Anti-kt
| < 2.4
|η
< 50 GeV 20 < pT
JVF = 0.5 JVF = 0.25
(a)
N
Vtx5 10 15 20 25
Fake Rate
0 0.02 0.04 0.06 0.08 0.1
JVF>0.5 JVT>0.6
ATLAS Simulation Preliminary
Pythia8 dijets LCW+JES R=0.4 Anti-kt
| < 2.4 η < 30 GeV, | 20 < pT
Target signal efficiency = 0.9
(b)
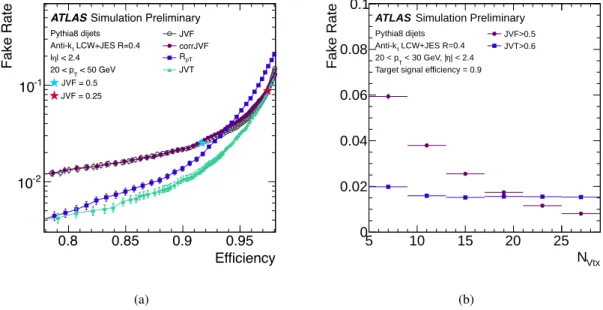
Figure 6: (a) Fake rate from pileup jets versus hard-scatter jet efficiency curves for JVF, corrJVF, R
pT, and JVT. The widely used JVF working points with cut values 0.25 and 0.5 are indicated with red and blue stars. (b) N
Vtxdependence of the pileup jet fake rate when imposing cuts on JVT (blue) and JVF (violet) such that the inclusive hard-scatter jet efficiency is 90%.
R
pTor JVT requirement as a function of the signal jet e ffi ciency resulting from the same requirement.
The JVT performance is driven by corrJVF (R
pT) in the region of high signal jet efficiency (high pileup rejection). Using JVT, signal jet efficiencies of 80%, 90% and 95% are achieved for pileup fake rates of respectively 0.4%, 1.0% and 3%. When imposing cuts on JVF that result in the same jet e ffi ciencies, the pileup fake rates are 1.3%, 2.2% and 4%.
Figure 6(b) shows the pileup jet fake rate as a function of the number of reconstructed primary vertices in the event when imposing a minimal JVT and JVF requirement such that the N
Vtxinclusive e ffi ciency is 90%. While for JVT the fake rate is stable, a decreasing trend with N
Vtxis observed for JVF, due to the pileup dependent denominator in the JVF definition (see Eqn. (1)).
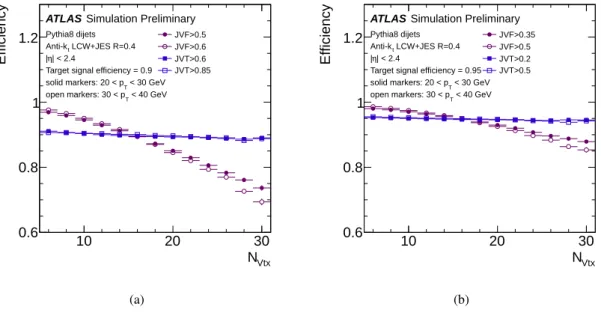
The dependence of the hard-scatter jet e ffi ciencies on N
Vtxis shown in Figure 7(a), when imposing the same JVF and JVT cuts as in Figure 6(b). In Figure 7(b) looser cut values are used, resulting in N
Vtxinclusive hard-scatter jet efficiencies of 95%. For the full range of N
Vtxconsidered, the hard-scatter jet e ffi ciencies after a selection based on JVT are stable within 1%. Figure 8 is similar to Figure 7 but instead shows the hard-scatter jet e ffi ciencies as a function of the average number of interactions per bunch crossing µ.
6
The JVF definition used here is the one of Ref. [2] (i.e. based on a di
fferent track-to-vertex association), to allow for a
direct comparison of the performance of the pileup jet suppression between this note and Ref. [2].
N
Vtx10 20 30
E ff ic ie n c y
0.6 0.8 1
1.2
JVF>0.5JVF>0.6 JVT>0.6 JVT>0.85
ATLAS Simulation Preliminary
Pythia8 dijets LCW+JES R=0.4 Anti-kt
| < 2.4 η
|
Target signal efficiency = 0.9 < 30 GeV solid markers: 20 < pT
< 40 GeV open markers: 30 < pT
(a)
N
Vtx10 20 30
E ff ic ie n c y
0.6 0.8 1
1.2
JVF>0.35JVF>0.5 JVT>0.2 JVT>0.5
ATLAS Simulation Preliminary
Pythia8 dijets LCW+JES R=0.4 Anti-kt
| < 2.4 η
|
Target signal efficiency = 0.95 < 30 GeV solid markers: 20 < pT
< 40 GeV open markers: 30 < pT
(b)
Figure 7: Primary-vertex dependence of the hard-scatter jet e ffi ciency for 20 < p
T< 30 GeV (solid markers) and 30 < p
T< 40 GeV (open markers) jets for fixed cuts of JVT (blue) and JVF (violet) such that the inclusive efficiency is 90% (a) and 95% (b). The cut values imposed on JVT and JVF, which depend on the p
Tbin, are specified in the legend.
10 20 30 µ
E ff ic ie n c y
0.6 0.8 1
1.2
JVF>0.5JVF>0.6 JVT>0.6 JVT>0.85
ATLAS Simulation Preliminary
Pythia8 dijets LCW+JES R=0.4 Anti-kt
| < 2.4 η
|
Target signal efficiency = 0.9 < 30 GeV solid markers: 20 < pT
< 40 GeV open markers: 30 < pT
(a)
10 20 30 µ
E ff ic ie n c y
0.6 0.8 1
1.2
JVF>0.35JVF>0.5 JVT>0.2 JVT>0.5
ATLAS Simulation Preliminary
Pythia8 dijets LCW+JES R=0.4 Anti-kt
| < 2.4 η
|
Target signal efficiency = 0.95 < 30 GeV solid markers: 20 < pT
< 40 GeV open markers: 30 < pT
(b)
Figure 8: Dependence of the hard-scatter jet efficiency for 20 < p
T< 30 GeV (solid markers) and
30 < p
T< 40 GeV (open markers) jets as a function of the average number of interactions per bunch
crossing µ. Fixed cuts of JVT (blue) and JVF (violet) are imposed such that the inclusive e ffi ciency is
90% (a) and 95% (b). The cut values imposed on JVT and JVF, which depend on the p
Tbin, are specified
in the legend.
4.3 Flavor dependence
The di ff erence in fragmentation and showering between light-quark and gluon initiated jets is expected to affect the shapes of corrJVF and R
pTand thus the performance of the JVT based pileup jet suppression.
The corrJVF- and R
pT-based discrimination between pileup and hard-scatter jets relies on the successful reconstruction and association of the hard-scatter tracks. Light (uds)-quark initiated jets have on average a lower number of associated hard-scatter tracks but a slightly higher response [27] and both effects lead towards an increase in the number of jets with no associated tracks from the hard-scatter primary vertex with respect to gluon initiated jets.
corrJVF
-1 -0.5 0 0.5 1
Normalized Entries
10-4
10-3
10-2
10-1
1 10 102
q jets g jets ATLAS Simulation Preliminary Pythia8 dijets
LCW+JES R=0.4 Anti-kt
< 30 GeV
| < 2.4, 20 < pT η
|
≤ 30 NVtx
≤ 0
(a)
RpT
0 0.5 1 1.5
Normalized Entries
10-4
10-3
10-2
10-1
1 10 102
q jets g jets ATLAS Simulation Preliminary Pythia8 dijets
LCW+JES R=0.4 Anti-kt
< 30 GeV
| < 2.4, 20 < pT η
|
≤ 30 NVtx
≤ 0
(b)
JVT
0 0.5 1
Normalized Entries
10-3
10-2
10-1
1 10
q jets g jets ATLAS Simulation Preliminary Pythia8 dijets
LCW+JES R=0.4 Anti-kt
< 30 GeV
| < 2.4, 20 < pT η
|
≤ 30 NVtx
≤ 0
(c)
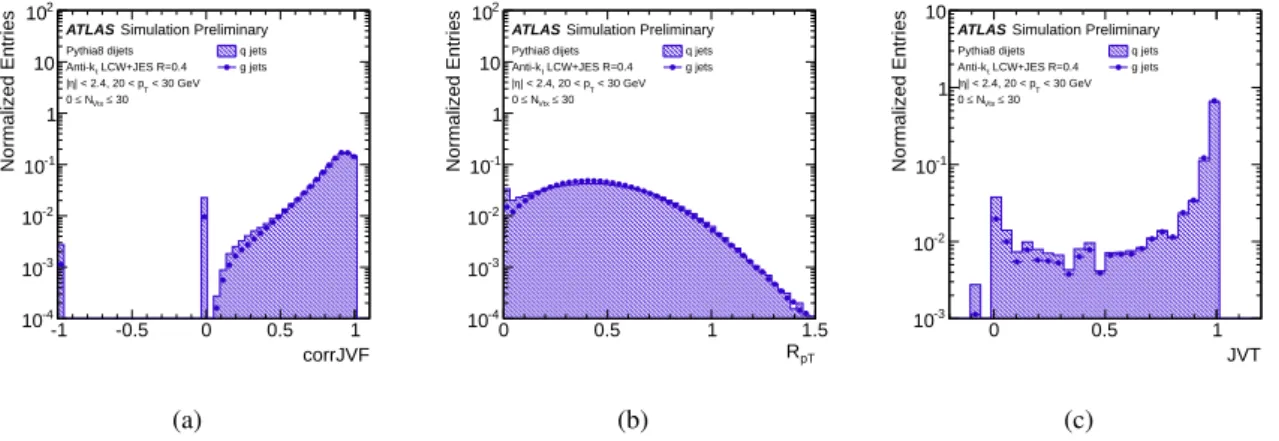
Figure 9: The distributions of corrJVF (a), R
pT(b) and JVT (c) for light-quark and gluon initiated hard- scatter jets.
In Fig. 9 we show the corrJVF, R
pTand JVT distributions for light-quark and gluon initiated hard- scatter jets with 20 < p
T< 30 GeV. Using a leading order notion of jet flavor, the partonic flavor labeling refers to the highest energy parton within a narrow cone of ∆ R < 0.3 around the jet axis. The distributions for light-quark initiated jets have more entries at low corrJVF, R
pTand JVT values and consequently a worse separation from pileup jets. Most notably, about twice as many light-quark jets have no associated tracks from the hard-scatter primary vertex, thus corrJVF = JVT = 0.
Figure 10 shows the efficiency vs. fake-rate curve for JVT for light-quark, gluon and b-quark initiated jets. As expected from Figure 9, the performance is worse for light-quark initiated jets. The pileup vs.
hard-scatter jet discrimination is best performing for b-quark initiated hard-scatter jets, profiting from the optimized track-to-vertex association as described in Section 2.2. It was found that the efficiency vs.
fake-rate curve for c-quark labeled jets is marginally worse than the one of gluon jets. When imposing minimal corrJVF, R
pTor JVT criteria, the hard-scatter jet e ffi ciencies are lower for light-quark initiated than for gluon initiated jets.
The stability of the hard-scatter e ffi ciencies as a function of N
Vtxis found to be independent of the flavor of the jet initiating parton.
5 Validation of the modeling in data
5.1 Validation in Z(→ µµ) + jets events
The modeling of R
pT, corrJVF and JVT can be validated with data using a sample of Z(→ µµ) candidate
events where kinematic selection criteria can be used to select either hard-scatter or pileup jets. In
simulation, the non-Z-boson background to this event selection is negligible and thus ignored. A sample
enriched in hard-scatter jets is obtained as follows: the leading jet with 20 < p
T< 50 GeV and |η| < 2.4
Efficiency
0.8 0.85 0.9 0.95 1
Fake Rate
10
-210
-1JVT(q) JVT(g) JVT(b)
ATLAS Simulation Preliminary
Pythia8 dijets LCW+JES R=0.4 Anti-kt
| < 2.4 η
|
< 50 GeV 20 < pT
Figure 10: The fake rate from pileup jets versus hard-scatter jet efficiency curves for JVT separating light-quark, gluon and b-quark initiated jets.
corrJVF
-1 -0.5 0 0.5 1
Events
103
104
105
106
MC incl.
HS PU Data ATLAS Preliminary
= 8 TeV, L = 20.3 fb-1 s
µ µ
→ Sherpa Z
LCW+JES R=0.4 Anti-kt
|<2.4 η
<50 GeV, | 20<pT
>30 GeV Z pT HS enriched selection
-1 -0.5 0 0.5 1
Data / MC 00.511.52
(a)
RpT
0 0.5 1 1.5
Events
102
103
104
105
106
107
108
MC incl.
HS PU Data ATLAS Preliminary
= 8 TeV, L = 20.3 fb-1 s
µ µ
→ Sherpa Z
LCW+JES R=0.4 Anti-kt
|<2.4 η
<50 GeV, | 20<pT
>30 GeV Z pT HS enriched selection
0 0.5 1 1.5
Data / MC 00.511.52
(b)
JVT
0 0.5 1
Events
103
104
105
106
107
MC incl.
HS PU Data ATLAS Preliminary
= 8 TeV, L = 20.3 fb-1 s
µ µ
→ Sherpa Z
LCW+JES R=0.4 Anti-kt
|<2.4 η
<50 GeV, | 20<pT
>30 GeV Z pT HS enriched selection
0 0.5 1
Data / MC 00.511.52
(c)
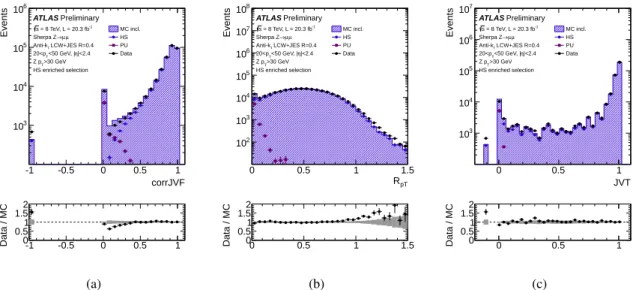
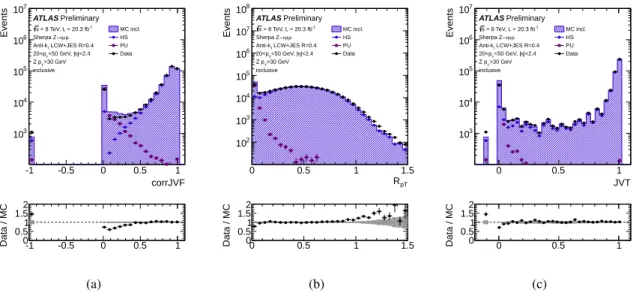
Figure 11: Comparison between data and simulation for corrJVF (a), R
pT(b) and JVT (c) in a hard- scatter enriched selection of jets in Z(→ µµ) + jets events, where a | ∆ φ(Z, jet)| > 2.6 requirement is imposed between the leading jet and the Z boson. The blue shaded histogram representing the inclusive simulation is subdivided in its hard-scatter jet and pileup jet contributions using blue and magenta mark- ers respectively. The gray band in the ratio plot represents the statistical uncertainty in the simulation.
The bin-by-bin variations in the JVT distribution are due to the discrete (rather than continuous) nature
of the variable.
corrJVF
-1 -0.5 0 0.5 1
Events
103
104
105
106
107
MC incl.
HS PU Data ATLAS Preliminary
= 8 TeV, L = 20.3 fb-1 s
µ µ
→ Sherpa Z
LCW+JES R=0.4 Anti-kt
|<2.4 η
<50 GeV, | 20<pT
>30 GeV Z pT inclusive
-1 -0.5 0 0.5 1
Data / MC 00.511.52
(a)
RpT
0 0.5 1 1.5
Events
102
103
104
105
106
107
108
MC incl.
HS PU Data ATLAS Preliminary
= 8 TeV, L = 20.3 fb-1 s
µ µ
→ Sherpa Z
LCW+JES R=0.4 Anti-kt
|<2.4 η
<50 GeV, | 20<pT
>30 GeV Z pT inclusive
0 0.5 1 1.5
Data / MC 00.511.52
(b)
JVT
0 0.5 1
Events
103
104
105
106
107
MC incl.
HS PU Data ATLAS Preliminary
= 8 TeV, L = 20.3 fb-1 s
µ µ
→ Sherpa Z
LCW+JES R=0.4 Anti-kt
|<2.4 η
<50 GeV, | 20<pT
>30 GeV Z pT inclusive
0 0.5 1
Data / MC 00.511.52
(c)
Figure 12: corrJVF (a), R
pT(b) and JVT (c) distributions for the leading jet with 20 < p
T< 50 GeV and
|η| < 2.4 in Z(→ µµ) + jets events, where the | ∆ φ(Z, jet)| requirement from Figure 11 is omitted. The blue shaded histogram representing the inclusive simulation is subdivided in its hard-scatter jet and pileup jet contributions using blue and magenta markers. The gray band in the ratio plot represents the statistical uncertainty in the simulation. The bin-by-bin variations in the JVT distribution are due to the discrete (rather than continuous) nature of the variable.
is required to be azimuthally back-to-back with the reconstructed Z boson with | ∆ φ(Z, jet) | > 2.6. The Z-boson p
Tis further required to be larger than 30 GeV. In simulation, this selection is 98% pure in hard-scatter jets. The data to simulation comparison plots for R
pT, corrJVF and JVT for this jet selection are shown in Figure 11. The simulation is scaled to match the data in the hard-scatter dominated region.
An underestimate of the simulation in the tail of R
pTis observed. The minimal R
pTcriterion used to suppress pileup jets, however, is typically around 0.2 and thus far from the mis-modelled region. Apart from an overestimate of the simulation in the pileup sensitive part of the distributions, the agreement between data and simulation is satisfactory.
Figure 12 shows the same comparison between data and simulation using a looser event selection with the | ∆ φ(Z, jet) | > 2.6 requirement omitted, so that the contribution from pileup jets is increased.
With this selection, the pileup-jet-dominated bins are overestimated in the simulation by about 30%. The e ff ect is most visible in the corrJVF distribution where the bins with corrJVF ∈ [0, 0.3] have a large pileup contribution.
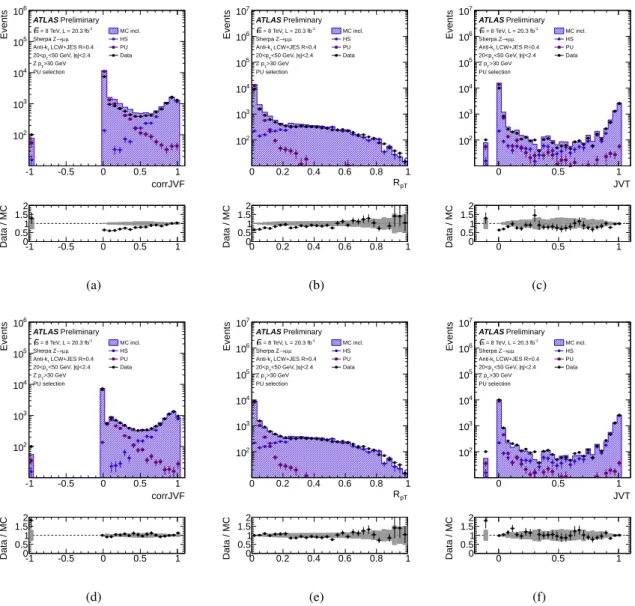
Next, a sample further enriched in pileup jets is obtained by imposing the same selection criteria as in Figure 11 but replacing the back-to-back requirement with the criterion | ∆ φ(Z, jet)| < 1.2. The data to simulation comparison for corrJVF, R
pTand JVT for this selection of jets is shown in Figures 13(a),13(b) and 13(c). While the pileup dominated regions in the three distributions are overestimated in simulation, the hard-scatter dominated tails of the distributions are reasonably well reproduced.
As a cross-check, we use the simulated sample of jets passing this event selection to form a tem-
plate of hard-scatter and another of pileup jets. We then perform a binned maximum likelihood fit
to fit the pileup template to the data, while keeping the hard-scatter contribution at its nominal value
from Figures 13(a), 13(b) and 13(c). The post-fit distributions of corrJVF, R
pTand JVT are shown in
Figures 13(d), 13(e) and 13(f), respectively. With the rescaled pileup contribution, a good agreement
between data and simulation is observed in the pileup and hard-scatter dominated regions as well as in
the transition regions.
corrJVF
-1 -0.5 0 0.5 1
Events
102
103
104
105
106
MC incl.
HS PU Data ATLAS Preliminary
= 8 TeV, L = 20.3 fb-1 s
µ µ
→ Sherpa Z
LCW+JES R=0.4 Anti-kt
|<2.4 η
<50 GeV, | 20<pT
>30 GeV Z pT PU selection
-1 -0.5 0 0.5 1
Data / MC 00.511.52
(a)
RpT
0 0.2 0.4 0.6 0.8 1
Events
102
103
104
105
106
107
MC incl.
HS PU Data ATLAS Preliminary
= 8 TeV, L = 20.3 fb-1 s
µ µ
→ Sherpa Z
LCW+JES R=0.4 Anti-kt
|<2.4 η
<50 GeV, | 20<pT
>30 GeV Z pT PU selection
0 0.2 0.4 0.6 0.8 1
Data / MC 00.511.52
(b)
JVT
0 0.5 1
Events
102
103
104
105
106
107
MC incl.
HS PU Data ATLAS Preliminary
= 8 TeV, L = 20.3 fb-1 s
µ µ
→ Sherpa Z
LCW+JES R=0.4 Anti-kt
|<2.4 η
<50 GeV, | 20<pT
>30 GeV Z pT PU selection
0 0.5 1
Data / MC 00.511.52
(c)
corrJVF
-1 -0.5 0 0.5 1
Events
102
103
104
105
106
MC incl.
HS PU Data ATLAS Preliminary
= 8 TeV, L = 20.3 fb-1 s
µ µ
→ Sherpa Z
LCW+JES R=0.4 Anti-kt
|<2.4 η
<50 GeV, | 20<pT
>30 GeV Z pT PU selection
-1 -0.5 0 0.5 1
Data / MC 00.511.52
(d)
RpT
0 0.2 0.4 0.6 0.8 1
Events
102
103
104
105
106
107
MC incl.
HS PU Data ATLAS Preliminary
= 8 TeV, L = 20.3 fb-1 s
µ µ
→ Sherpa Z
LCW+JES R=0.4 Anti-kt
|<2.4 η
<50 GeV, | 20<pT
>30 GeV Z pT PU selection
0 0.2 0.4 0.6 0.8 1
Data / MC 00.511.52
(e)
JVT
0 0.5 1
Events
102
103
104
105
106
107
MC incl.
HS PU Data ATLAS Preliminary
= 8 TeV, L = 20.3 fb-1 s
µ µ
→ Sherpa Z
LCW+JES R=0.4 Anti-kt
|<2.4 η
<50 GeV, | 20<pT
>30 GeV Z pT PU selection
0 0.5 1
Data / MC 00.511.52
(f)
Figure 13: Distributions of corrJVF (a), R
pT(b) and JVT (c) using the event selection enhanced in pileup
jets. In Figures (d), (e) and (f) the pileup jet contribution in the simulation it fit to the data, while keeping
the hard-scatter jets at their nominal normalization.
In conclusion, the corrJVF, R
pTand JVT distributions of hard-scatter jets are found to be well mod- eled using di ff erent event selections. The pileup jet rate, however, is found to be overestimated in simu- lation.
5.2 Validation for b-tagged jets using t¯t events
corrJVF
-1 -0.5 0 0.5 1
Events
1 10 102
103
104
105
MC incl.
HS PU Data ATLAS Preliminary
=8 TeV, L = 20.3 fb-1 s Top Selection
LCW+JES R=0.4 Anti-kt
|<2.4 η
<50 GeV, | 20<pT b-tagged
-1 -0.5 0 0.5 1
Data / MC 00.511.52
(a)
RpT
0 0.5 1 1.5
Events
0 2000 4000 6000
MC incl.
HS PU Data ATLAS Preliminary
=8 TeV, L = 20.3 fb-1 s Top Selection
LCW+JES R=0.4 Anti-kt
|<2.4 η
<50 GeV, | 20<pT b-tagged
0 0.5 1 1.5
Data / MC 00.511.52
(b)
JVT
0 0.5 1
Events
10 102
103
104
105
MC incl.
HS PU Data ATLAS Preliminary
=8 TeV, L = 20.3 fb-1 s Top Selection
LCW+JES R=0.4 Anti-kt
|<2.4 η
<50 GeV, | 20<pT b-tagged
0 0.5 1
Data / MC 00.511.52