www.giga-hamburg.de/workingpapers
orking Papers serve to disseminate the research results of work in progress prior to publicaton to encourage the exchange of ideas and academic debate. n of a paper in the Working Papers series does not constitute publication and should not limit publication in any other venue. Copyright remains with the authors.
GIGA Research Programme:
Power, Norms and Governance in International Relations
___________________________
Measuring Geopolitical Power in India:
A Review of the National Security Index (NSI) Karl Hwang
No 136 May 2010
GIGA Working Papers
Edited by the
GIGA German Institute of Global and Area Studies Leibniz‐Institut für Globale und Regionale Studien
The GIGA Working Papers series serves to disseminate the research results of work in progress prior to publication in order to encourage the exchange of ideas and academic debate. An objective of the series is to get the findings out quickly, even if the presentations are less than fully polished. Inclusion of a paper in the GIGA Working Papers series does not constitute publication and should not limit publication in any other venue. Copyright remains with the authors. When working papers are eventually accepted by or published in a journal or book, the correct citation reference and, if possible, the corresponding link will then be included on the GIGA Working Papers website at <www.giga‐hamburg.de/
workingpapers>.
Research Programme “Power, Norms and Governance in International Relations”
Editor of the GIGA Working Papers series: Bert Hoffmann
<workingpapers@giga‐hamburg.de>
Copyright for this issue: © Karl Hwang English copy editor: Melissa Nelson
Editorial assistant and production: Christine Berg
All GIGA Working Papers are available online and free of charge on the website
<www.giga‐hamburg.de/workingpapers>.
For any requests please contact: E‐mail: workingpapers@giga‐hamburg.de Phone: ++49 (0)40 ‐ 4 28 25 ‐ 548
The GIGA German Institute of Global and Area Studies cannot be held responsible for errors or any consequences arising from the use of information contained in this Working Paper; the views and opinions expressed are solely those of the author or authors and do not necessarily reflect those of the Institute.
GIGA German Institute of Global and Area Studies Leibniz‐Institut für Globale und Regionale Studien Neuer Jungfernstieg 21
20354 Hamburg Germany
E‐mail: info@giga‐hamburg.de Website: www.giga‐hamburg.de
Measuring Geopolitical Power in India:
A Review of the National Security Index (NSI)
Abstract
This review examines how India perceives its own rise to power by undertaking a detailed analysis of the Indian National Security Index (NSI) for the period from 2003 to 2008. Like other power formulas, the NSI includes various indicators of power, though it is uniquely Indian in that it initially emphasized human development and later included ecology based on a holistic human‐security paradigm. The analysis demonstrates that this holistic approach has now been abandoned in favor of a more conventional one, and that the tech‐
nical formulas and theoretical concepts of the NSI exhibit various inconsistencies and problems. In particular, one can recognize the absolute need for a unified standard for handling variables in the construction of composite indexes in general.
Keywords: India, geopolitics, statistics, power formula, power index, human security
Karl Hwang
is a Ph.D. student at the GIGA German Institute of Global and Area Studies and the Uni‐
versity of Hamburg.
Contact: conducator@gmail.com Website: http://conducator.jimdo.com/
Zusammenfassung
Das Messen geopolitischer Macht in Indien: Eine kritische Analyse des Nationalen Sicherheitsindexes (NSI)
Diese Studie untersucht durch eine detaillierte Analyse des Nationalen Sicherheitsindexes (NSI) für den Zeitraum der Jahre 2003 bis 2008, wie Indien sich selbst wahrnimmt. Der NSI besteht – wie andere Machtformeln auch – aus verschiedenen Indikatoren für Macht, doch ist er spezifisch indisch insofern, als er seinen Schwerpunkt ursprünglich auf die mensch‐
liche Entwicklung legte und erst später die Ökologie auf Grundlage eines ganzheitlichen Paradigmas der menschlichen Sicherheit mit einbezog. Die Analyse zeigt, dass dieser ganzheitliche Ansatz zugunsten eines eher konventionellen Weges aufgegeben wurde und dass die technischen Formeln und theoretischen Konzepte des NSI verschiedene Wider‐
sprüche und Probleme aufzeigen. Allgemein ist zu erkennen, dass ein einheitlicher Stan‐
dard im Umgang mit den Variablen bei der Zusammensetzung von Indizes unbedingt notwendig ist.
Karl Hwang
Article Outline 1 Introduction
2 Geopolitical Challenges in India’s Quest for Great‐power Status 3 The Role of Power in Kautilya’s Arthashastra
4 The Institutional Background of the NSI 5 Possible Inspirations behind the NSI 6 From National Security to Human Security
7 The Human Development Index and the Environmental Vulnerability Index 8 The Lack of a Unified Standard in the Calculation of the NSI
9 The Trend in the Composition of the NSI Towards the Abandonment of Human Security
10 Reception and Critiques of the NSI 11 Conclusion
1 Introduction
Power indexes don’t measure power as such; rather, they measure power as it is perceived by their designers. Michael Pillsbury undertook a ground‐breaking study on Chinese power formulas in 2000. He justified his undertaking by emphasizing that it is necessary to appreci‐
ate Chinese views as “unique” and not merely as a “mirror image” of American views (Pills‐
bury 2000: xv). In order to do so Pillsbury used the analogy of studies on the Soviet Union and quoted Andrew Marshall, who has been director of the Office of Net Assessment in the US Department of Defense since 1973:
Soviet calculations are likely to make different assumptions about scenarios and objec‐
tives […] perform different calculations, use different measures of effectiveness, and perhaps use different assessment processes and methods. The result is that Soviet as‐
sessments may substantially differ from American assessments. (Marshall, quoted in Pillsbury 2000: xv)
The American international relations (IR) theories neorealism and offensive realism assume that there is a universal rationality behind states’ quest for power; the theories differ only in their approaches to risk behavior (see Mearsheimer: 17‐22). In contrast, advocates of strategic culture point out that elites conditioned by different cultural environments may make differ‐
ent choices when placed in similar situations (Johnston 1995: 35, 38). Ranked preferences are one method for determining strategic culture (Johnston 1995: 48). Power indexes are gener‐
ally a more tangible source of information because the preferences are already quantified and weighted; by knowing the details of power formulas one may thus infer national priori‐
ties and possibly make predictions regarding national strategy.
Power formulas partly express the idiosyncratic views of their designers, partly express the culturally based preferences and priorities of their respective society, and partly express the universal pursuit of power in the form of capability and resources. While power formulas rarely come along with explicitly new perspectives and definitions, they may contain new variables and new methods of calculation, which appear to be the most important aspects when studying the various power indexes.
It can be assumed that “any non‐omniscient Being (i.e. any frail human being) proba‐
bly can never apprehend the true objective fact” (Kent 1951: 42), but subjectivity may indeed be useful in contributing new ideas from previously ignored perspectives. The National Se‐
curity Index (NSI), which was developed by the Indian National Security Council Secretariat in 2002, has an Indian flavor: it initially emphasized human development and later included ecology, as India—where the population density is higher than in Japan—is known for mass poverty and overcrowding. It is tempting to suspect that Indian IR analysts in general would be rather fond of GDP at purchasing power parity (PPP) rather than at the official exchange rate (OER) as this would immediately triple their economic size, but such a general subjec‐
tive preference cannot be confirmed.1
The argument could be made that Indian power indexes are relevant because India is increasingly relevant, but this would then imply that the power indexes of smaller countries are less relevant. The Indian power indexes may be regarded as a symptom of India’s ascen‐
dancy to global power, but any hypothetical attribution of power indexes to growth in power can be expected to suffer from self‐selection bias, which means that the increased public availability of some indexes’ data vis‐à‐vis less available indexes distorts perception. Indians have most likely constructed power indexes before, and it may simply be the Internet that makes those Indian power indexes constructed nowadays internationally traceable. Pre‐
Internet Indian power indexes may never be resuscitated without considerable research on the part of Indian scholars themselves.
1 The NSI uses OER. The Indian economist Arvind Virmani developed his own power index in 2004/05; he re‐
peatedly insists that PPP is the better measure and resents any notion that OER may be as good or better. The basis for his claim is a rather unconcealed nationalist bias regarding the ranking of India (see Virmani 2004, 2005a, 2005b, 2005c, 2005d).
The paper is structured as follows: sections 2 & 3 seek to briefly illuminate the context of the NSI. The objective of these sections is to, in general terms, connect the NSI to India as far as the latter’s great‐power aspirations and strategic culture are concerned. Section 2 ex‐
plains India’s attempt to attain great‐power status and its economic performance. Section 3 returns to India’s strategic culture, looking at the role of power in the Arthashastra by Kau‐
tilya, which is the key text in this respect.
Sections 4 to 7 seek to connect the NSI to its specific institutional and theoretical roots.
Section 4 examines the institutional origin of the NSI as the basis for its development. Section 5 traces the ideational roots and intellectual heritage that culminated in the development of the NSI in order to distinguish the intellectual baggage from preceding efforts in power measurement by other analysts from the fresh impulses of the designers of the NSI. Section 6 focuses on the theoretical basis for the unique emphasis of the early NSI on human security as well as on the conceptual problematic involved. Section 7 looks critically at the Human Development Index (HDI) and the Environmental Vulnerability Index (EVI) as these indexes were integrated into the early NSI with its focus on human security.
Section 8 may be of interest only to experts on the technical aspects of power formulas.
However, it is crucial to understanding why the NSI has not managed to produce satisfac‐
tory numbers. Section 9 demonstrates through thematic weighting and correlation analysis how the NSI has effectively abandoned its original emphasis on human security and looks at possible reasons for this. Section 10 investigates how the NSI has been received as well as the criticisms of it. The latter may contain suggestions for further improvement. Section 11 con‐
cludes the inquiry by looking at the two big issues facing the NSI, which are (1) the inclu‐
sion/exclusion of human security and (2) the inadequacy of results due to the absence of a unified calculation standard, and offers suggestions for further research.
For readers who want to see the five published versions of the NSI itself, Appendix A provides details on the index’s changing composition. The complete results of the five pub‐
lished indexes can be found in Appendix B.
2 Geopolitical Challenges in India’s Quest for Great‐power Status
I have a THIRD vision. India must stand up to the world. Because I believe that unless India stands up to the world, no one will respect us. Only strength respects strength.
We must be strong not only as a military power but also as an economic power. Both must go hand‐in‐hand.
Avul Pakir Jainulabdeen Abdul Kalam Eleventh President of India (2002‐2007), 2006 In the index of Mearsheimer’s The Tragedy of Great Power Politics from 2001, one finds 65 en‐
tries for the People’s Republic of China and 3 entries for India (Mearsheimer 2001: 538, 543), a
fact which is symptomatic for the low prestige that India has suffered so far. Yet in recent years it has become increasingly fashionable to laud India’s ascendance to the rank of global power (Basu 2008: 396). The problem is pinpointing the timing of India’s entry into the league of great powers. The Pokhran‐II nuclear tests from May 11‐13, 1998 could represent a suitable date, but only because India successfully weathered the resulting sanctions. These tests were surely meant to validate India’s claim to great‐power status (Nayar/Paul: 27;
Perkovich 2003: 5).2
In contrast, India’s low point in economic development may be established as 1979, though relative to China the difference in wealth has never been as great as today. The time period 1947‐1979 was marked by Fabian semi‐socialism, less so in terms of ownership than in terms of control through the ill‐famed Licence Raj.3 The relatively stable per capita growth rate of just over 1 percent during this period became known as the “Hindu rate of growth.”
Moderate reforms were initiated in the 1980s; however, large fiscal deficits during this time period spilled over into the trade deficit and thus brought about a serious balance of pay‐
ments crisis in 1991, when the Indian government was close to default on its external obliga‐
tions. This crisis sparked the push for more drastic reforms aimed at further economic liber‐
alization from 1991 to 1993. Compared to its unsustainable growth track of the 1980s, India now looks to be on a sustainable path as all critical debt ratios4 have developed in a favorable direction.
Countless scholars have emphasized the importance of war in proving national power.
Karl Haushofer5 stated that the ultimate test of national strength is war (Haushofer 1913: 8);
George Perkovich stated in a more recent lecture on India that war provides the empirical test of military power (Perkovich 2003: 14, 2004: 136); and Chang Chin‐Lung referred to
“one‐on‐one all‐out conflicts, as the acid test for power equations” (Chang 2004: 21). India
2 In this regard the role of the Bharatiya Janata Party (BJP) elites in pushing for an overt nuclear program in 1998 can also be mentioned. The BJP bases its ideology on “Hindutva,” which demands Hindu nationalism, one nation, one religion, and one country. Its ideology comes from the Arthashastra and states that India should be strong. A pertinent book on this issue is Christophe Jaffrelot, ed. 2007. Hindu Nationalism: A Reader.
Delhi: Permanent Black.
3 The Licence Raj (1947–1990) refers to a bureaucratic system that set quotas for businesses as to how much of a certain product they were allowed to manufacture. The quantity of goods was therefore not determined freely by supply and demand.
4 That is (1) Debt Stock‐GDP Ratio 1990–1991: 28.7; 1999–2000: 22.0; (2) Debt‐Service Ratio 1990–1991: 35.3;
1999–2000: 16.0; (3) Debt‐Exports Ratio 1990–1991: 491.7; 1999–2000: 258.6; (4) Short‐term Debt/Total Debt 1990–1991: 10.3; 1999–2000: 4.1; and (5) Short‐term Debt/Foreign Currency Reserves 1990–1991: 382.3; 1999‐
2000: 11.5 (Baru 2003: 186–187).
5 Karl Haushofer has been much criticized over the connection between German geopolitics and Nazi expan‐
sion; nevertheless, geopolitics has been regaining some of its popularity, which also encourages a differenti‐
ated treatment of this particular issue. When asked about Karl Haushofer, prominent American IR expert Parag Khanna stated recently in an interview that “Germany was indeed an essential pillar of geopolitical thought. […] Of course we can use the old geopolitical terms” [author’s re‐translation] (Khanna 2010: 45).
was clearly beaten in the brief Sino‐Indian War in 1962; Vietnam performed better in the brief Sino‐Vietnamese War in 1979. Historically, major victories and major defeats have been the entry and exit points for membership in the league of great powers, so the pressing problem for India “is the absence of a peaceful mechanism for rising powers to gain acceptance in the international hierarchy” (Nayar/Paul 2003: 7‐8, 35).
Figure 1: Per Capita GDP‐PPP for China and India as Percentage of Per Capita GWP‐PPP
0%
20%
40%
60%
80%
100%
1950 1958 1966 1974 1982 1990 1998 2006
China India
Source: Maddison 2009.
Great‐power status may well be an arbitrary judgment; most definitions of it are near tauto‐
logical, employing arbitrary cutoffs as to capability and timing (see Levy 1983: 11‐19).
Mathematically the issue is one of determining thresholds for dividing countries into diver‐
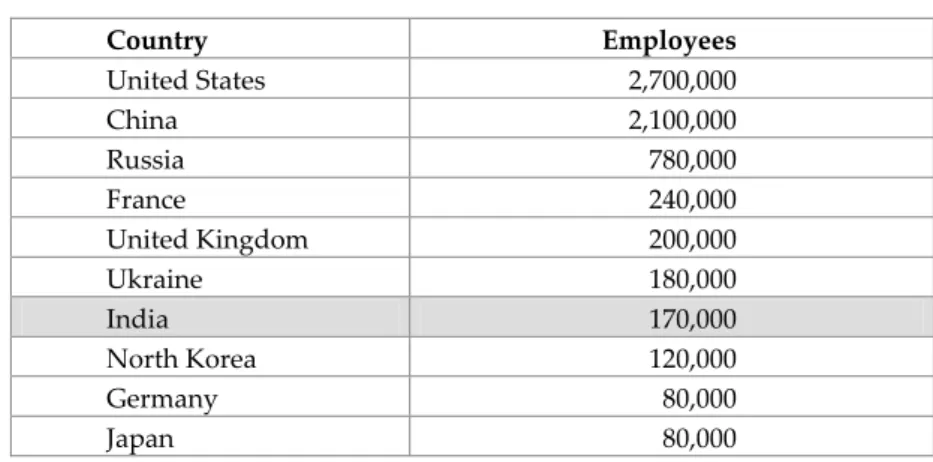
gent classes with emerging attributes clearly associated with a higher level of capability.6 A promising indicator of great‐power capability may be the level of employment in arms pro‐
duction; thus, the five members of the UN Security Council happened to also be the five countries with the largest employment in arms production as late as 2003. Arms production is India’s weak point “as it is heavily dependent on external suppliers for major weapons sys‐
tems such as fighter aircraft and advanced munitions” (Nayar/Paul 2003: 44).
6 For the application of the Herfindahl‐Hirschman index of concentration to determine a rather abstract system threshold, see Hwang 2008a: 18.
Table 1: Estimated Level of Employment in Arms Production, 2003
Country Employees
United States 2,700,000
China 2,100,000
Russia 780,000
France 240,000
United Kingdom 200,000
Ukraine 180,000
India 170,000
North Korea 120,000
Germany 80,000
Japan 80,000
Source: SIPRI database 2009 (original source: Bonn International Center for Conversion).
Many Indians insist as a matter of principle that India deserves a permanent seat on the UN Security Council. China seems to act as an obstacle to this aim (Perkovich 2004: 142;
Nayar/Paul: 12). Brazil and Germany are geographically far away from China, so two per‐
manent seats for Brazil and Germany would have no direct bearing for China. However, given India’s and Japan’s geopolitical positions as China’s direct neighbors and competitors, China cannot really benefit from supporting India and Japan. Perkovich puts the Indian chal‐
lenge this way:
One measure of Indian diplomacy in the future will be how it either lowers the value of a Security Council seat and therefore makes India’s power ranking independent of such a position, or alternatively how India attains a seat. (Perkovich 2003: 19)
Indians may like to imagine India as a vegetarian elephant (see Virmani 2005a: 8), but sooner or later frustrated impatience could possibly lead to adventurism.7 Some may assert India’s peaceful nature, especially as a democracy, but democratic peace theory merely states that democracies don’t fight other democracies (see Mearsheimer 2001: 16), and as India’s neigh‐
bors aren’t democracies, they “remain part of the devalued out‐group, and legitimate targets of violence” (Johnston 1995: 60‐61). Indians understandably resist the disadvantages of being underestimated but seem to forget that being considered too powerful too soon might be worse. The Chinese have wisely followed Deng Xiaoping’s 24 Character Strategy8 in order to avoid preemptive containment strategies.
7 Charu Majumdar (1918–1972) most eloquently expressed this frustrated impatience in the context of guerrilla warfare: “Mere collection of arms does not alter the character of struggle—the guns collected have to be used”
(Majumdar 1965–1967: VIII).
8 Translated as “observe calmly; secure our position; cope with affairs calmly; hide our capacities and bide our time; be good at maintaining a low profile; and never claim leadership” (USDOD 2007: 6).
3 The Role of Power in Kautilya’s Arthashastra
Given that the Arthashastra is the key text on Indian strategic culture, it is expedient to say a little about the role of power in it. Kautilya lived circa 350‐283 BC. He was largely responsible for the creation of the Mauryan Empire in his role as advisor and prime minister to the first Maurya emperor, Chandragupta. In addition, he was a professor at Takshashila University.
Kautilya wrote the Arthashastra as a treatise on statecraft. According to Roger Boesche, it is
a book of political realism, a book analysing how the political world does work and not very often stating how it ought to work, a book that frequently discloses to a king what calculating and sometimes brutal measures he must carry out to preserve the state and the common good. (Boesche 2002: 17)
For Kautilya power is the means and not the end, so “strength is power, and happiness is the end. […] Hence a king shall always endeavor to augment his own power and elevate his happiness” (Kautilya, Arthashastra 6.2). Further, “the possession of a prosperous treasury and a strong army is the strength of sovereignty” (Kautilya, Arthashastra 6.2). As for the seven
“constituents of the state,” Kautilya listed “Swamy (King), Amatya (Prime Minister), Jana‐
pada (populated territory), Durga (fort), Ksha (treasury), Bala (force / army) and Mitra (ally)”
(Naik 2004).
For the augmentation of power the general rule applies that “whoever is inferior to an‐
other shall make peace with him; whoever is superior in power shall wage war” (Kautilya, Arthashastra 7.1), so power is the basis for the acquisition of more power. For successful war‐
fare “the conqueror should know the comparative strength and weakness of himself and of his enemy” (Kautilya, Arthashastra 9.1), and comparison entails measurement according to Sun Zi.9
As for the important connection between economics and military matters, Sanjaya Baru has recently reiterated Kautilya’s argument as follows:
The management of the economy, and of the treasury, has been a vital aspect of state‐
craft from time immemorial. Kautilya’s Arthashastra says, “From the strength of the treasury the army is born. […] men without wealth do not attain their objectives even after hundreds of trials […] Only through wealth can material gains be acquired, as elephants (wild) can be captured only by elephants (tamed) […] A state with depleted resources, even if acquired, becomes only a liability.” Hence, economic policies and performance do have strategic consequences. (Baru 2009)
9 Sun Zi (circa 544–496 BC) had in mind a procedural chain: “The rules of the military are five: measurement, assessment, calculation, comparison, and victory. The ground gives rise to measurements, measurements give rise to assessments, assessments give rise to calculations, calculations give rise to comparisons, comparisons give rise to victory” (Sun Tzu, The Art of War: 4).
4 The Institutional Background of the NSI
Given that every power index is the idiosyncratic product of its author and its institutional environment, some information regarding which people and institutions the NSI has de‐
pended on in its formation and evolution is provided here. This provides some context re‐
garding the motivations and viewpoints that went into the NSI.
The National Security Council (NSC) was set up on November 19, 1998 to overcome structural deficiencies in the coordination of national security. The council originally in‐
cluded the newly created national security advisor (NSA); the ministers of defense, external affairs, home, and finance; and the deputy chairman of the Planning Commission. The Na‐
tional Security Council Secretariat (NSCS) was established in April 1999 and succeeded, with expanded responsibility, the existing Joint Intelligence Committee (JIC), which had been largely limited to producing a monthly intelligence review (Chandra 2006: 209, 215).
The nationalist Bharatiya Janata Party (BJP), with Atal Bihari Vajpayee as prime minis‐
ter, had come to power on March 19, 1998, two months before the Pokhran‐II nuclear tests from May 11‐13, 1998. It had then established a task force to study the national security mechanisms of other countries and to submit recommendations on revamping the Indian system, the result being the NSC and other subgroupings (Raman 2004, 2005). Apurba Kundu comments that “in a marked departure from previous national governments, those led by the Bharatiya Janata Party (BJP) sought to address national security issues both proac‐
tively and strategically in line with the party’s philosophy of achieving a strong India”
(Kundu 2004a: 4).
Satish Chandra served as chairman of the JIC from January 1999 to April 1999, and then as deputy NSA and secretary of the NSCS from April 1999 to February 2005. He empha‐
sizes that the NSC was intended to be geared towards a more holistic view of national secu‐
rity that included “issues like good governance, health, water management, environment, technology or even the economy” in addition to conventional topics such as “insurgencies and law and order, terrorism, foreign policy, etc.” (Chandra 2006: 202, see also 207). In addi‐
tion to evaluating the intelligence collected by other agencies, the NSCS became a quasi think tank that initiated papers on human security as well as national security (Chandra 2006: 217).
The NSI appears to have been one outgrowth of the secretariat’s assertive creativity.
There appears to have been some institutional resentment between the traditional min‐
istries and the newly established NSC and NSCS as a result of their different outlooks.
Chandra states that “regrettably, the political and bureaucratic leadership continues to re‐
main wedded to a damage control mode rather than a more cerebral long‐term policy evolu‐
tion mode” (Chandra 2006: 224). The relatively new NSCS seems to have lost out in this insti‐
tutional power struggle: ministries have not sought advice from it on a routine basis, and it has not been informed on all relevant issues (Chandra 2006: 224‐225). The return to power of the left‐leaning Indian National Congress (INC) party on May 22, 2004 has not helped either.
The deputy chairman of the Planning Commission is no longer a member of the NSC, and the JIC has been revived in competition with the NSC; the NSC had originally replaced the JIC.
As one of its many projects, the NSCS has funded the India’s National Security Annual Review (INSAR) series, though it has been clearly stated in each volume that the views ex‐
pressed in the INSAR are not those of NSCS. The Confederation of Indian Industry (CII) joined as another sponsor starting with the INSAR 2004. The aim of the INSAR is to bring to‐
gether essays on different national security issues as well as to provide a review of events for a particular year. Regarding the INSAR, the first NSA, Brajesh Chandra Mishra, stated, “we have a book which takes a holistic and integrated view of internal and external security chal‐
lenges being faced by India” (Kumar 2004a: jacket). With the INSAR 2008, published in 2009, the series now consists of eight volumes.
Satish Kumar has been editor of the INSAR since its inception in 2000.10 He was born in 1933, and from 1961 to 1998 he was a professor of diplomacy at Jawaharlal Nehru University (JNU) in New Delhi. He has written several books, especially on Pakistan, and has traveled to several countries as a visiting scholar. He is considered one of India’s preeminent IR schol‐
ars and has trained many cadres of India’s Foreign Service through his position at JNU.
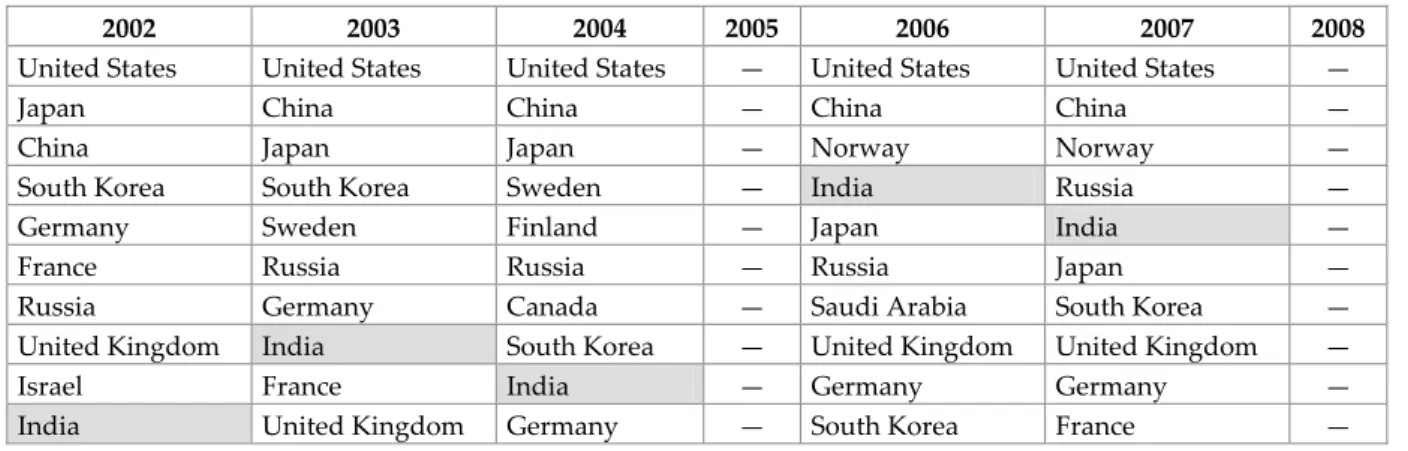
Kumar is most often associated with the NSI, though the original idea as well as the first index were developed by the NSCS. Kumar was then asked by the NSCS to continue the project and to update the index either annually or periodically. Since he has revised the index four times in consultation with a subgroup of the INSAR editorial board. The NSI has been published irregularly: it was published for 2002, 2003, 2004, 2006, and 2007, but was not pub‐
lished for 2005 and 2008. Economic experts from JNU have done the calculations for the index.
5 Possible Inspirations behind the NSI
The original NSI was published in the INSAR 2002; however, in the first INSAR 2001 Satish Kumar already exhibited a determined interest in quantification measures:
Any national security review would require that an ongoing assessment of the power profile of the nation is made. It may not be possible to assess all the components of na‐
tional power at a given time, or quantify all of them. And yet, it is worthwhile to at‐
tempt as many as possible. (Kumar 2002: 21)
In this regard all the INSAR publications, from 2001 to 2008, have included a statistics section unrelated to the NSI. Though no direct link exists, the pattern is reminiscent of the Zeitschrift für Geopolitik [Journal for Geopolitics], published from 1924 to 1944, which also regularly fea‐
10 Satish Kumar looked at the initial draft of this working paper and kindly contributed many comments and suggestions that corroborate some of the information presented here.
tured sections on statistics.11 Geopolitics has been understood from the very beginning as a practical and empirical science as opposed to excessively abstract theorizing (see Ratzel 1923: 1; also Hwang 2008b: 101‐102). A geopolitical triangle consisting of geography, statis‐
tics, and international politics can be depicted. Given that the INSAR seeks to provide practi‐
cal information and guidance for long‐term policies and emphasizes geography, as can be seen in the map on India’s strategic neighborhood (Kumar 2006: 318, 2007: xxi), alongside its regular statistics section, its structural patterns and emphases are unquestionably in the tra‐
dition of geopolitics.
In terms of a rough genealogical outline (see Hwang 2008a: 5‐9), the inspiration for this power index most likely came from the United States and China. The United States has had something of a cross‐referencing quantitative community partially concerned with the meas‐
urement of power at least since 1960. From the late 1980s onwards the Chinese have devel‐
oped a vibrant community focused on measuring comprehensive national power (CNP);
they took their inspiration from the United States and Japan. India has not yet developed a community proper concerned with the measurement of power, but this index could be a creative spark in this direction.
Satish Kumar already mentioned the Tellis approach in the INSAR 2001 (Kumar 2002:
20‐21); it seems likely that this approach, published by the RAND Corporation, a well‐known American think tank, in 2000, was widely known at that point and may have inspired the construction of the NSI. It measures national power according to three realms: national re‐
sources, national performance, and military capability. Each realm consists of numerous variables. The Tellis approach has not produced a working formula or results since that time, possibly due to quantification problems encountered in transforming a great deal of meticu‐
lously detailed theory (212 pages!) into practically useful calculations (see Tellis et al. 2000a, 2000b). In the introduction to the NSI 2003 Kumar states in regard to the Tellis approach that
“it is obvious that all these factors are not quantifiable” (Kumar 2004b: 228).
The same introduction to the NSI 2003 also mentions Michael Pillsbury’s work on Chi‐
nese geopolitical power calculations regarding CNP starting in the late 1980s (Kumar 2004b:
228‐229). Before Pillsbury’s work in English, access to information on China’s vibrant efforts in the calculation of CNP was limited to Chinese‐language sources. Like the Tellis paper, Pillsbury’s work was published in 2000, but it is not clear whether it received the same im‐
mediate publicity in India. While Satish Kumar focused on the CNP formula from the Chi‐
nese Academy of Social Sciences (CASS), he didn’t show any interest in the other CNP in‐
dexes, nor in the power indexes by Wilhelm Fucks, Ray Steiner Cline, and the Japanese gov‐
ernment, all of which inspired the Chinese (see Pillsbury 2000: 225‐226). The CASS index was
11 Statistics was mostly defined as “statecraft” (Staatskunde) until 1850, while from 1850 onwards most defini‐
tions considered statistics a methodological science. Hybrid definitions fall mostly into the period 1846–1854 (Klezl 1940: 12). In England statistics was known as “political arithmetic” before 1798, when the German word Statistik was then imported as “statistics” (Witt 1993: 1‐2).
created by Wang Songfen; it consisted of 64 variables grouped into eight major areas, as out‐
lined in Table 2.
Table 2: Weighted Coefficients of Major Component Factors
National Power Factor Weighted Coefficient
Total CNP 1.00
Natural resources 0.08
Economic activities capability 0.28
Foreign economic activities capability 0.13
Scientific and technological capability 0.15
Social development level 0.10
Military capability 0.10
Government regulation and control capability 0.08
Foreign affairs capability 0.08
Source: Pillsbury 2000: 229 (original source: Wang Songfen, ed. 1996. Shijie zhuyao guojia zonghe guoli bijiao yanjiu [Comparative studies of the comprehensive national power of the worldʹs major nations]. Chang‐
sha: Hunan chubanshe, 169).
Similar to his comment on the Tellis approach, Kumar states that “many of these factors are again not quantifiable” (Kumar 2004b: 229), which is not true, as total CNP values have been calculated using the CASS formula. Thus Kumar is probably referring to factors for which experts had to be surveyed. It can be argued that perception values are less reliable than ma‐
terial data, while at the same time perception surveys are much more work. In terms of basic structure the CASS is not far away from the NSI, and according to Pillsbury it is not clear whether the CASS index uses a unified standard for handling aggregates and per capita val‐
ues. Sanjaya Baru (former media adviser to the prime minister) comments that “based on such concepts, the INSAR’s National Security Index (NSI) for India is an attempt to construct a simpler index” (Baru 2005: 113).
The social development level in the CASS formula consists of (1) educational level, (2) cultural level, (3) health‐care level, (4) communications, and (5) urbanization (Pillsbury 2000:
221). As such it preceded the NSI in using human‐security variables, but human‐security fig‐
ures account for perhaps 5 percent of the index; this small percentage does not indicate a conscious paradigm shift. In contrast, human security in the original NSI stood at 26.67 per‐
cent, a whopping difference from the CASS index.
Chinese scholars were quite fond of the Growth Competitiveness Index (GCI) pub‐
lished annually by the World Economic Forum in the Global Competitiveness Report (GCR).
The GCI focused on macroeconomic conditions and was complemented by the Business Competitiveness Index (BCI), which focused on microeconomic conditions; both were re‐
vamped and consolidated into a new Global Competitiveness Index in 2004 (see Bandura 2008: 42). Y.S. Rajan mentions the GCI in relation to national power (Rajan 2002: 255). He also mentions the Tellis approach in relation to competitive commercial technologies (Rajan 2002:
252‐253). While competitiveness is not directly part of the NSI, it can be noted that technol‐
ogy has received a relatively high weighting at 15‐20 percent.
As for the name of the NSI itself, the NSI does not directly measure national security. It does so only indirectly, as evidenced by the introduction of the original NSI, where it is stated that “a country’s national security is safeguarded not just by its armed forces but by its comprehensive national power” (NSCS 2003: 349). The difference between national power and security is that the notion of national power tends to take a short‐term view of interna‐
tional relations while national security provides a long‐term perspective on international re‐
lations, psychologically speaking.
6 From National Security to Human Security
Interstate military conflicts have decreased relative to domestic conflicts and violence. This tendency has changed the focus of security thinking. National security has traditionally been concerned with territorial integrity and arms races, but given that the international environ‐
ment is relatively stable and that international treaties no longer guarantee domestic peace, a closer look at conflicts is required in order to link domestic stability and security with human development. Accordingly, individuals rather than states move to the center of attention, for individuals are the primary consumers of insecurity in terms of civilian deaths and, equally, they are the primary perpetrators in terms of insurgencies and socioeconomic motion. The concept of human security promotes a holistic convergence of war studies with development studies.
The UNDP’s Human Development Report 1994 actively promotes human security as its central theme. It provides an explicit definition of human security by focusing on two key aspects: “It means, first, safety from such chronic threats as hunger, disease and repression.
And second, it means protection from sudden and hurtful disruptions in the patterns of daily life—whether in homes, in jobs or in communities” (UNDP 1994: 23). Human security consists of (1) economic security, (2) food security, (3) health security, (4) environmental secu‐
rity, (5) personal security, (6) community security, and (7) political security (UNDP 1994: 24‐
25). Critics have argued that human security may altogether be a manipulative attempt “‘to capture some of the more substantial political interest and superior financial resources’ asso‐
ciated with more traditional, military conceptions of security” (Paris 2001: 95).
The problem with concepts of human security is that they tend to be too broad and fuzzy, making it hard to discern a difference between human development and human secu‐
rity (see Trachsler 2003: 75‐76). Sanjaya Baru states that “the UNDP’s Human Development Re‐
port tries to capture trends in ‘human security’ through measurement of human develop‐
ment” (Baru 2005: 112). Moreover, it can be argued that human security runs counter to na‐
tional security, so that human security can be construed as an invitation to humanitarian in‐
tervention that disregards and undermines state sovereignty (see Trachsler 2003: 70, 77‐78, 85‐86, 102).
Efforts have been made to quantify human security (Trachsler 2003: 79‐81), one of them being the Index of Human Insecurity (IHI) from 2000 (see Bandura 2008: 54‐55). One of the sixteen variables of the IHI is “public expenditures on defense versus education,” which is reminiscent of the variable that measures “military spending in relation to health spending”
in the Global Militarization Index (GMI) by the Bonn International Center for Conversion (BICC). It is unclear how such variables, which bring military spending in opposition to so‐
cial spending, could ever convince more conservatively minded scholars. Human security is the product of the UNDP milieu; however, devoid of any political agenda, a holistic and in‐
tegrated approach to security is also compatible with more conservative views (compare Paris 2001: 97).
Apurba Kundu considers human security to be the basis of the original NSI, and he implicitly commends the NSI for this (Kundu 2004b). Kundu displays some naïveté when he asks “What do highly expensive military modernisation items do for the human security of the individual citizen?” (Kundu 2004b:7) because in a democracy human security should be more the concern of the police and not a question of direct military prowess, as the question implies. Still, India is a poor country where capital is scarce, so synergy effects are desirable in order to optimize the use of resources and capabilities. This may suggest that expenditures on national security enhance human security, at least with regard to insurgencies such as the Maoist‐Naxalite insurrection and the conflict over Kashmir.
7 The Human Development Index and the Environmental Vulnerability Index
The first two NSI publications contained the Human Development Index (HDI), which was perhaps the most prominent feature of the NSI. The HDI was developed by Pakistani economist Mahbub ul Haq (1934‐1998). Prior to its development Haq had explained to fellow Indian economist Amartya Sen, ʺ‘we need a measure of the same level of vulgarity as the GNP—just one number—but a measure that is not as blind to social aspect (sic) of human lives as the GNP is’” (Sen 1998). This vulgar measure happened to be the HDI, which was published with the first Human Development Report 1990 and has been published annually ever since. The HDI basically tends to inflate the development level of poor countries com‐
pared to GDP, whether at the official exchange rate (OER) or in terms of purchasing power parity (PPP). Sen explains that Haq was an optimist opposed to the pessimism that the exclu‐
sive reliance on GDP generates.12
12 The NSI has adopted the basic methodology of the HDI, but without using a unified standard (see Section 8) for treating values either as aggregates or per capita values or otherwise. The HDI seeks to represent per cap‐
ita development, and the NSI seeks to represent the aggregate power of nations, but in using the HDI meth‐
The third NSI included the Environmental Vulnerability Index (EVI). The EVI was ini‐
tially developed by the South Pacific Applied Geoscience Commission (SOPAC) for small is‐
land developing states in 1999, and was then expanded to all states in 2004 and 2005. The EVI consists of 50 indicators grouped into (1) hazards, (2) resistance, and (3) damage. All indica‐
tors have a scale of 1 to 7 to make them directly comparable. The cutoff values for each indi‐
cator on this scale are arbitrary, but they represent the best estimate possible given the com‐
plexity of matter (Pratt et al. 2004: 14). A composite score is calculated from these 50 indica‐
tors. The EVI has a number of problematic indicators that construct an irreconcilable opposi‐
tion between human development and environmental sustainability. For example, one indi‐
cator (“use of electricity for industry over the last 5 years per square kilometre of land”) negatively evaluates economic activity per se; it does not take into account the type of indus‐
try, the source of electricity, or the environmental standards in place to limit and compensate for damage to the environment. This means that a primitive lifestyle always scores better re‐
gardless of the actual damage caused. Another issue is those indicators that are a fixed fea‐
ture of the environment and independent of human action (“number of volcanoes”); practi‐
cally, they may render the index static.
8 The Lack of a Unified Standard in the Calculation of the NSI
The changing composition of the NSI in various years is documented in Appendix A, the re‐
sults in Appendix B. The most important observation from a technical point of view is that the NSI’s different subindexes have random shares of aggregate and per capita variables, as well as of attributable variables that are neither. Aggregate values measure the sum total of a variable in a given country, for example, the “total number of patents.”13 Per capita values
odology without adjustment, the result is a technical disaster that produces questionable end results. In any case the HDI is not without flaws either, and for this reason it is useful to take a critical look at the HDI itself.
The HDI consists of three subindexes: (1) life expectancy, (2) education comprising adult literacy and gross enrollment, and (3) GDP‐PPP. While the areas of these subindexes seem optimal for its purpose, the HDI’s method of calculation is careless and inconsistent. For life expectancy 85 is arbitrarily taken as the upper limit and 25 as the lower limit, instead of the real maximum and minimum values. The CIA Factbook explains most eloquently that “rounding of numbers always results in a loss of precision—i.e., error” (CIA 2009: FAQ). For literacy and gross enrollment no minimum value is used in the calculation. For gross enrollment and GDP‐
PPP a completely arbitrary upper limit is applied, beyond which no differences will be registered; for GDP‐
PPP an equally arbitrary lower limit is applied. Given that adult literacy has reached saturation in developed countries, the measure is worthless in comparing such countries. The logarithm is used only for GDP‐PPP, though it would make more sense to apply it all subindexes, so that relationships are preserved in the com‐
posite index scale. Instead, the numerical value of the HDI is more or less devoid of meaningful information;
the only usefulness is in determining rank. India is ranked 128 out of 177 countries measured (UNDP 2007: 128).
13 Complications arise when these aggregates happen to measure something negative like “energy imports” (i.e., the more energy imported, the weaker the country). Though they are still aggregates, the problem in general
divide these aggregate values by the population to determine the average individual level, for example, “researchers per million.” A third group of attributable variables consists of values that by themselves are neither aggregate nor per capita, for example, “high technol‐
ogy exports as percentage of manufactured exports.” No system for the use of variables can be discerned beyond the inertia of initial availability, which means that if the designers of the NSI find an aggregate variable, they use it directly without discrimination or adjustment to a unified standard. The same way that if they find per capita variables or attributable vari‐
ables, they use these values directly without discrimination or adjustment to a unified stan‐
dard. The proper way of constructing an index would be to decide on a uniform standard that determines whether all variables are to be converted into aggregates or per capita values and to stick with it. Only then would it make sense to combine those values.
Table 3: Different Functions of NSI Variables
Function 2002 2003 2004 2005 2006 2007 2008
Aggregate 56.00% 52.00% 55.00% — 57.25% 60.25% —
Per capita 28.00% 28.00% 26.00% — 14.50% 15.25% —
Neither 16.00% 20.00% 19.00% — 28.25% 24.50% —
Source: Author’s own calculation, see Appendix A for detailed indexes.
The NSI is thus an incoherent hybrid which calculates results of dubious value;14 the NSI values are neither aggregate values indicating the total power of India compared to other countries, nor are they per capita values enabling the indirect measurement of the level of se‐
curity for the average Indian compared to the average citizens of other countries. The NSI is in dire need of a unified standard for handling aggregates and per capita values, and the most straightforward solution would be to transform all values into positive aggregates as far possible. The combined NSI value would then indicate national power as a sum total, al‐
lowing the simple comparison of national values.
The criticism can be made that ongoing changes in composition and weighting prohibit year‐to‐year comparisons. While this is true to some extent, it is exactly these ongoing changes that mark the NSI as a creative and well‐run experiment, despite all the misgivings.
Any demand for temporal uniformity would kill this creativity, as the NSI would no longer be free to use all available variables, including many of recent origin, to sustain continuous quality improvement.
Four minor issues remain: (1) To multiply the HDI by the population leads to impreci‐
sion because HDI values are in theory stretched between maximum and minimum and not
is that the more negative aggregates are used, the more likely the linear calculations could result in negative sum totals, so that a country would have a negative value as total power, which is illogical. Because of this, such negative aggregates are counted as “Neither” in Table 3.
14 The incongruous “method” of randomly adding up aggregate and per capita values creates a bias favoring small but highly developed countries (Scandinavia).
precise values with fixed ratios; the NSI no longer uses the HDI. (2) Economic growth as a component of the NSI does not represent current abilities but rather future expectations on the basis of past performance; further rapid economic growth also means that the infrastruc‐
ture is increasingly deficient relative to economic activity, so economic growth may confer an inflated picture of economic conditions in the short run. (3) “Population by itself can be a strength as well as weakness” (NSCS 2003: 351). The addition of “population aged 15‐64” to the NSI 2007 contradicts this earlier realization by taking demography solely as a strength without adjustment for qualitative factors such as health and education that could demon‐
strate population to be a weakness; demography alone does nothing but boost India’s rank.15 It can be assumed that population is already included in most aggregate values (compare Mearsheimer 2001: 61). (4) The NSI 2004 included Hong Kong, which is obviously a subna‐
tional area.
The number of variables in technology was increased from 3 in the NSI 2002 to 5 in the NSI 2007, though the weighting of technology was decreased from 20 percent to 15 percent.
The inclusion of numbers on main battle tanks, aircraft, and principal surface combatants16 to indicate defense capability seems too simple because it does not account for quality differ‐
ences; however, no better measure is readily available.17 Given that the total number of vari‐
ables in the NSI increased from 8 in the NSI 2002 to 17 in the NSI 2007, parsimony seems ad‐
visable.
15 The NSI designers put some effort into measuring what they call “effective population” (the “population in‐
dex” in the NSI 2002 and 2003) by changing the components of this subindex three times (see Appendix A), a fact which also indicates that they haven’t yet found a satisfactory measure. The obvious goal is to measure the population without omitting the quality dimension of this population, such as pertaining to health and education for example. Somewhat similar in nature and intent, the CIA Factbook has also calculated a variable called “manpower fit for military service”: “This entry gives the number of males and females falling in the military age range for a country (defined as being ages 16–49) and who are not otherwise disqualified for health reasons; accounts for the health situation in the country and provides a more realistic estimate of the actual number fit to serve” (CIA 2009: Definitions and Notes). Though the input and the formula of this measure are not given in this definition, multiplying the population aged 16 to 49 by the square root of life expectancy provides a relatively good proxy.
16 Principal Surface Combatants (PSC) are not counted in a consistent manner in The Military Balance; that is, sometimes corvettes are included in the number and sometimes not. An alternative to counting PSC is to look at tonnage (see Martello 1990: 16‐17, 67‐68).
17 In 1976 the Pentagon developed the concept of “Armored Division Equivalent” (ADE), which combined many factors to measure conventional force. By 1988 this had been refined into “Division Equivalent Firepower”
(DEF) (see also Martello 1990: 36); the information available on the Internet about these measures is limited.