Polarforschung 87 (1), 3 – 13, 2017
Pathways of Siberian Freshwater and Sea Ice in the Arctic Ocean Traced with Radiogenic Neodymium Isotopes
and Rare Earth Elements
Georgi Laukert1*, Martin Frank1, Ed C. Hathorne1, Thomas Krumpen1, Ben Rabe2, Dorothea Bauch1, Kirstin Werner2, Ilka Peeken2 and Heidemarie Kassens1
Abstract: Freshwater and sea ice in the Arctic Ocean (AO) both respond to climate forcing but changes in their distribution may in turn also significantly affect Northern Hemisphere climate. The exact mechanisms controlling their transport are, however, still subject of ongoing research.
Radiogenic neodymium (Nd) isotopes (expressed as εNd) and rare earth elements (REEs) have successfully been used to trace ocean circulation in the AO and can provide valuable information on the origin, transport and fate of Arctic freshwater and drifting sea ice. Here, we present first sea-ice data and discuss the applicability of these tracers to determine the pathways of Siberian freshwater and the source areas of Arctic sea ice within the Eurasian Basin. Freshwaters originating from various Siberian rivers are well mixed and diluted prior to their advection to the central AO and the Fram Strait, thereby inhibiting the assessment of the individual contributions of the different rivers for these regions. Recent investigations of seawater Nd isotope and REE distributions on the Siberian shelves now allow for a more detailed determination of the sources of transpolar freshwater transport, and suggest that freshwater from the Lena River can at least be qualitatively traced further away from the shelves. In addition, sea ice has the potential to preserve marine and riverine εNd and REE signatures of the Siberian shelf source waters transported across the AO to the Fram Strait thereby avoiding the effects of mixing. Here, we test this potential for the first time by comparing εNd and REE signatures determined from unfiltered but essentially sediment-free sea-ice samples recovered in the Eurasian Basin of the central AO in 2012 with corresponding signatures of surface seawater in the formation regions of the ice. The sampled sea ice is dominantly characterized by εNd values near -8, in agreement with the incorporation of radiogenic freshwater (εNd = -6) from the Yenisei and Ob rivers and its formation east of Vilkitsky Strait as identified by a backtracking approach based on satellite-derived ice drift and concentration data. The latter also indicates that sea ice with a less radiogenic εNd signature near -11 formed north of the Laptev Sea, in agreement with mixed contributions of radiogenic waters from the Kara Sea and northward flowing highly unradiogenic Lena River water (εNd ≤ -15).
Compared to the REE concentrations in Siberian shelf waters, those in the sea ice are depleted, indicating rejection of REEs together with salt during sea-ice formation. Despite potential modifications during incorporation into sea ice, its REE distribution patterns indicate a predictable relationship to those of the source waters, thus in addition supporting preservation of at least some of the marine and riverine REE characteristics during sea-ice formation and transport.
Zusammenfassung: Süßwasser und Meereis im Nordpolarmeer reagieren beide einerseits auf klimatische Veränderungen, ihre Verteilung kann aber umgekehrt auch das Klima der Nordhemisphäre beeinflussen. Die genauen Mechanismen, die ihren Transport steuern, sind jedoch immer noch nicht ausreichend verstanden und umfassen daher ein zentrales Forschungsthema.
Radiogene Neodymisotope (εNd) und Seltenerdelemente (REE) wurden ____________
Keywords: Nd isotopes, rare earth elements, Arctic Ocean, freshwater, sea ice doi:10.2312/polarforschung.87.1.3
1 GEOMAR Helmholtz Centre for Ocean Research Kiel, Wischhofstraße 1-3, D-24148 Kiel, Germany.
* Corresponding author <glaukert@geomar.de>
2 Alfred Wegener Institute, Helmholtz Centre for Polar and Marine Research, Am Handelshafen 12, D-27570 Bremerhaven, Germany.
This paper was presented as an oral report at the conference „Das Klima der Arktis – Ein Frühwarnsystem für die globale Erwärmung“ at the Akademie der Wissenschaften und der Literatur zu Mainz, 02-03 November 2016.
Manuscript received 04 August 2017; accepted in revised form 06 September 2017.
bereits erfolgreich angewendet, um die Ozeanzirkulation in der arktischen Region nachzuverfolgen, und haben das Potential, wertvolle Informationen über die Herkunft, den Transport und den Verbleib des Süßwassers und des treibenden Meereises zu liefern. Hier präsentieren wir neue Meereis-Daten und diskutieren die Anwendbarkeit dieser Tracer für die Bestimmung der Transportwege sibirischen Süßwassers und der Herkunft arktischen Meereises innerhalb des Eurasischen Beckens. Das Süßwasser aus verschiedenen sibirischen Flüssen wird vor seiner Advektion in das zentrale Nordpolarmeer und die Framstraße verdünnt und mit anderen Wassermassen gemischt, so dass eine exakte Bestimmung des Eintrags einzelner Flüsse für diese Regionen nicht mehr möglich ist. Neue Ergebnisse zur Verteilung der im Meerwasser gelösten εNd- und REE-Signaturen auf den sibirischen Schelfen erlauben nun eine genauere Bestimmung der Quellen des transpolaren Süßwassertransports und legen nahe dass abseits der Schelfregionen Flusswasser der Lena zumindest qualitativ nachverfolgt werden kann. Zusätzlich kann das Meereis die marinen und durch Flüsse eingetragenen εNd- und REE-Signaturen der sibirischen Schelfwässer ohne Mischung über das zentrale Nordpolarmeer transportieren.
Dieses Potential wird hier zum ersten Mal durch einen Vergleich von εNd- und REE-Signaturen von ungefiltertem, aber im Wesentlichen sedimentfreiem Meereis, das 2012 im eurasischen Teil des Nordpolarmeeres beprobt wurde, mit den marinen Signaturen im Entstehungsgebiet des Meereises getestet.
Das Meereis hat hauptsächlich εNd Werte um -8, in Übereinstimmung mit dem Einschluss der radiogenen Süßwassersignaturen (εNd = -6) von Jenissei und Ob und der Entstehung dieses Meereises östlich der Wilkitzkistraße. Dieser Entstehungsort wurde anhand eines Backtracking-Ansatzes basierend auf durch Satellitendaten gestützte Eisdrift- und Konzentrationsdaten ermittelt.
Meereis, das anhand dieses Backtracking-Ansatzes nördlich der Laptewsee gebildet wurde, hat im Gegensatz dazu eine εNd-Signatur nahe -11 konsistent mit Zumischungen der radiogenen Wässer aus der Karasee und des nordwärts fließenden deutlich weniger radiogenen Süßwassers der Lena (εNd ≤ -15).
Die REE-Konzentrationen im Meereis sind insgesamt niedriger als die der Schelfwässer, was auf die Ausscheidung der REEs zusammen mit dem Salz während der Eisbildung hindeutet. Trotz Anzeichen für Modifikationen beim Einbau in das Meereis zeigen die REE-Verteilungsmuster des Meereises ein systematische Beziehung zu den Wässern im Entstehungsgebiet des Meereises an, was zusätzlich die überwiegende Erhaltung der marinen und durch Flüsse eingetragenen REE-Charakteristika andeutet.
INTRODUCTION
The surface layer of the Arctic Ocean (AO) is unique among the world’s oceans due to its vast sea-ice cover and low salinity originating from riverine inputs. The AO not only receives about 11 % of the global riverine discharge (Fichot et al. 2013), but also accommodates significant amounts of Paci- fic-derived freshwater (e.g., Woodgate et al. 2006, 2012), and freshwater discharged from the Greenland Ice Sheet (BamBer et al. 2012). It is covered by the second largest amount of sea ice on Earth and strongly linked with the Earth’s climate system. Due to global climate change, the content, distribu- tion and circulation of Arctic freshwater and sea ice have changed recently, which has already had consequences for the Arctic marine ecosystems, the oceanic conditions of the AO and potentially for the global climate. In particular the trans- port of Arctic freshwater and sea ice to temperate latitudes
has increased (de Steur et al. 2017 and SmedSrud et al. 2017 and references therein), leading to a freshening of the North Atlantic. The additional stratification has the potential to influ- ence deep convection and to weaken the Atlantic Meridional Overturning Circulation (cf., rahmStorf et al. 2015, Yang et al. 2016). Realistic predictions of future climatic changes thus need to include reliable assessments of the origin and path- ways of Arctic freshwater and sea ice.
The mechanisms controlling the transport of freshwater and sea ice in the AO are still subject of ongoing research. A common conceptual model is that the distribution of Arctic freshwater and sea ice is related to oscillations in the large- scale atmospheric circulation inducing variability in the sea-ice and ocean surface circulation (cf., mauritzen 2012). This is most evident for the sea ice, given that its movement is clearly forced by the wind-driven anticyclonic Beaufort Gyre and the Transpolar Drift (TD). Observational studies have shown that variable amounts of liquid Siberian freshwater are in addi- tion transported with the TD to the central AO and further to the western Fram Strait (e.g., taYlor et al. 2003, anderSon et al. 2004, Karcher et al. 2006, alKire et al. 2007, JoneS et al. 2008, raBe et al. 2009, Bauch et al. 2011, raBe et al.
2013). However, subsurface oceanic currents and regional hydrographic processes have also been suggested to affect the distribution and transport of Arctic freshwater (cf., raBe et al. 2013). For example, studies of several Arctic regions in the late 1990s showed that subsurface currents rather than atmospheric forcing mainly govern the transport of shallow waters (e.g., rudelS et al. 1996, JoneS et al. 1998, JoneS 2001). In particular, for large parts of the Eurasian Basin these studies found that transport within the upper water column is controlled by the advection of Atlantic-derived waters, which enter the AO through the eastern Fram Strait and continue to flow eastward along the Siberian margin (rudelS et al. 1996, 1999). While the inflowing branch of these waters propa- gates in the direction opposite to the TD, one of the returning branches (i.e., directed towards the Fram Strait) was recently confirmed to flow alongside the Lomonosov Ridge at depths between 200 and 400 m, and thus parallel to the TD (recinoS et al. 2016). It remains to be investigated in detail how these and other currents interact with the TD and which role they play in Arctic sea-ice distribution and Siberian freshwater transport.
The reconstruction of sea-ice pathways has improved in recent years due to the availability of satellite-derived ice drift and concentration data allowing for example to determine drift trajectories and source areas of Arctic sea ice transported to the Fram Strait (Krumpen et al. 2016). The low resolution of the satellite sensors combined with the applied methodology to derive sea-ice motion, however, do not allow tracking of individual floes, but rather provide drift reconstructions on a larger scale. Reconstructions of the freshwater pathways are even more challenging, given that they require in-situ data from the water column. Most observational studies inves- tigating freshwater transport to date are based on standard hydrographic tracers such as temperature, salinity, alkalinity and nutrients (e.g., anderSon et al. 2004, JoneS et al. 2008), sometimes combined with stable oxygen isotopes (e.g., Bauch et al. 2009, 2011). These tracers are appropriate to identify the sources (i.e., meteoric water and sea-ice melt) and quantify the corresponding amount of freshwater transported in the AO,
but they do not provide direct information on the individual contribution of the different Arctic rivers. These limitations emphasize the importance to search for alternative methods, preferably based on chemical tracers contained in both, seawater and sea ice.
Radiogenic neodymium (Nd) isotopes have been widely applied to trace modern and past ocean circulation, as well as continental inputs (reviews by franK 2002, goldStein &
hemming 2003, vande flierdt et al. 2016). Their suitability to trace ocean circulation and freshwater pathways in the AO and the Nordic Seas was demonstrated by anderSSon et al.
(2008) and porcelli et al. (2009) and was recently supported by lauKert et al. (2017a). The seawater (i.e., dissolved) Nd isotope distribution in the open AO reflects water mass advection and mixing, while seawater-particle interactions exert important control only above the shelf regions as often also reflected by variations in Nd concentrations. However, seawater Nd isotope compositions on the vast Siberian shelves appear not to be significantly modified by such interactions (lauKert et al. 2017b). This allows the application of Nd isotopes combined with salinity to trace Siberian freshwater inputs and pathways. In addition to the Nd concentrations usually measured and reported along with the Nd isotope compositions, the concentrations of the other rare earth elements (REEs) and the relative distribution patterns of the complete set of REEs provide complementary information on the composition of the source material, the amount of time since the last contact of the waters with weathering inputs, as well as particle adsorption and desorption processes (e.g., garcia-SolSona et al. 2014, haleY et al. 2014, molina-Ke-
Scher et al. 2014, hathorne et al. 2015, Yang & haleY 2016, lauKert et al. 2017a, b).
Here we review the applicability of Nd isotopes and REEs to trace the pathways of Siberian freshwater within the Eurasian Basin, and investigate whether these tracers can also be used to provide information on the source areas of drifting Arctic sea ice. We present the first εNd and REE signatures deter- mined from unfiltered but essentially sediment-free sea ice and compare the results with marine and riverine signatures expected for surface seawater in the formation region of the sea ice. The findings presented here build on seawater Nd isotope and REE data recently obtained for the Laptev Sea (lauKert et al. 2017b).
APPLICATION OF NEODYMIUM ISOTOPES AND THEIR SYSTEMATICS IN THE ARCTIC OCEAN
The radiogenic Nd isotope composition is commonly expressed in the εNd notation, which denotes the deviation of a measured 143Nd/144Nd ratio from the chondritic uniform reser- voir (CHUR) ratio of 0.512638 in parts per 10000 (JacoBSen
& WaSSerBurg 1980). The global variation of εNd signatures in rocks covers a wide range of εNd values from -56 to +11 (lacan et al. 2012, van de flierdt et al. 2016). In general, young mantle-derived rocks have more radiogenic εNd signa- tures (i.e., more positive εNd values) than old continental rocks. The range and the distribution of εNd observed in rocks result from the fractionation between Nd and samarium (Sm) during magmatic processes, and the decay of 147Sm to 143Nd.
The distinct signatures of the rocks are introduced through
riverine or aeolian inputs of weathered continental material to the oceans and label the water masses at the land-ocean inter- face. The quasi-conservative behavior of Nd in the open ocean (franK 2002, goldStein & hemming 2003) and its interme- diate average oceanic residence time of several hundred years (tachiKaWa et al. 2003, arSouze et al. 2009, rempfer et al.
2011) then allow tracing the advection and mixing of these signatures and hence the water masses they are carried by.
On a global scale, the modern seawater εNd compositions, in particular in near surface waters, mirror the compositions of the dominating geological formations located in the basins and at their margins. The Pacific is predominantly surrounded by young mantle-derived lithologies (cf., circum-Pacific belt) and consequently exhibits relatively radiogenic seawater εNd signa- tures, whereas the North Atlantic receives Nd from the old continental rocks of North America and Greenland and there- fore is characterized by less radiogenic εNd values (compila- tions provided by lacan et al. 2012 and vande flierdt et al. 2016). The water mass signatures can be further modified only through seawater-particle interactions occurring either within the water column (generally summarized under the term “reversible scavenging”, e.g., nozaKi & aliBo 2003, Siddall et al. 2008) or at the land-ocean boundaries (summa- rized under the term “boundary exchange”, lacan & Jeandel 2001, 2005).
The seawater Nd isotope distribution in the AO has been attributed to weathering inputs, water mass circulation and mixing, but also to seawater-particle interactions occurring on the shelves and their slopes (anderSSon et al. 2008, porcelli et al. 2009, lauKert et al. 2017a,b). The latter were recently shown to significantly modify the seawater Nd isotope compo- sition on the North-East Greenland Shelf (lauKert et al.
2017a). There, remineralization of biogenic particles, remo- bilization of REEs from coagulated inorganic nanoparticles and colloids and/or REE release from detrital particles clearly occurred in bottom waters and in addition to an increase of the Nd concentration resulted in a shift of the Nd isotope composition towards less radiogenic values. Seawater-par- ticle interactions also occur on the Siberian shelves, but they differ from those observed on the North-East Greenland Shelf.
Observations from the Laptev Sea (lauKert et al. 2017b) and the Severnaya Dvina estuary (poKrovSKY et al. 2014) indicate that removal of riverine REEs through salt-induced coagula- tion of nanoparticles and colloids is the dominating process, whereas significant REE release from particulate phases with an associated change in the seawater Nd isotope composition does not occur (lauKert et al. 2017b). The lack of signifi- cant release of particulate REEs (except Ce) might be linked to generally low amounts of suspended particulate matter transported by the western Siberian rivers (e.g., gordeev et al. 2006), and perhaps also be related to the distinct compo- sition of the riverine nanoparticles and colloids. The latter is supported by experiments simulating estuarine mixing indicating that release of REEs bound to nanoparticles and colloids likely only occurs when the riverine end-member is rich in inorganic and poor in organic material (tepe & Bau 2016, merSchel et al. 2017a), which is not the case for the major Siberian rivers including the Severnaya Dvina, Lena, Yenisei and Ob (dittmar & Kattner 2003 and references therein). Hence, the inputs of dissolved riverine REEs and water mass advection and mixing likely solely account for the Nd isotope distribution observed in the open AO and on the
Siberian shelves suggesting that Nd isotopes can be applied as a water mass tracer in these regions.
All known REE sources of the AO and their Nd isotope compositions are shown in Figure 1. The Atlantic-derived waters dominate the REE budget and are characterized by εNd signatures of -13 and -12.6 at the Iceland-Scotland Ridge and the Denmark Strait, respectively (lauKert et al. 2017a and references therein). In contrast, Pacific-derived waters entering the AO through the Bering Strait only represent 11 % of the REE inputs and have distinctly more radiogenic εNd signatures around -2 to -3 (charette et al. 2016). These highly radiogenic signatures are altered through seawater-par- ticle interactions close to the inflow resulting in εNd signatures near -5.5 for modified Pacific-derived waters emerging from the Chukchi Sea (dahlqviSt et al. 2007, porcelli et al. 2009).
The Norwegian Coastal Water is another important marine source and characterized by an εNd signature of -14.5 in the southern Barents Sea (petrova 2015, lauKert et al. 2017a).
As shown (Fig. 1), the discharge of freshwater from the vari- ous Arctic rivers has a wide range of different εNd signatures ranging from -5 to -17 (porcelli et al. 2009, zimmermann et al. 2009, perSSon et al. 2011, lauKert et al. 2017a,b). Addi- tional contributions of REEs via glacial meltwater and runoff do also occur but are generally limited to the shelf regions of Greenland (e.g., lacan & Jeandel 2004, lauKert et al.
2017a). The sea-ice cover prevents aeolian inputs of REEs to reach the entire AO in winter and year-round in the central AO. Instead, the particulate REEs are most likely scavenged by snow, deposited on the sea ice and only released during snow and sea-ice melting. No REE concentrations have been reported as yet for Arctic snow deposited on the sea-ice cover and the contribution of REE inputs originating from snow melting is thus unknown. However, compared to the riverine contributions, the aeolian REE inputs to the AO are expected to be comparatively small. Vertical redistribution of REEs within the water column through sea-ice formation and melting was recently suggested to play an important role for the marine REE budget of the Siberian shelves (lauKert et al. 2017b).
METHODS
All seawater data considered here have been published previ- ously. Dissolved Nd isotope and REE concentration data were reported for the Laptev Sea (lauKert et al. 2017b) and the Fram Strait (lauKert et al. 2017a). Additional dissolved Nd isotope and concentration data were mainly reported for the central AO and the Canada Basin (anderSSon et al. 2008, porcelli et al. 2009, zimmermann et al. 2009).
New Nd isotope and REE data were determined for essen- tially sediment-free (based on optical control) sea-ice samples recovered in the Eurasian Basin during expedition PS80 (ARKXXVII/3, BoetiuS 2013) of the German research vessel RV “Polarstern” between 2 August and 8 October 2012 (Fig. 1). The four sea-ice cores were recovered with a Titanium corer and stored in clean plastic tubes, before they were trans- ferred into acid-cleaned plastic barrels, wrapped up in several layers of plastic bags and melted at ~4 °C. The salinity of the sea-ice meltwater was determined by using a Salinometer (WTW Cond. 3310). For Nd isotope and REE analyses, the
remaining meltwater was transported to the home laboratory at GEOMAR, Kiel. During a second transfer into acid-cleaned canisters, only the upper parts of the meltwater samples were transferred to avoid incorporation of any settled particles.
Further sample treatment including the pre-concentration, extraction and isolation of Nd was performed following the standard procedures applied for seawater (see lauKert et al.
2017a). The Nd isotope compositions were measured on a Nu Plasma (Nu Instruments Limited) and a Neptune Plus (Thermo Scientific) MC-ICP-MS at GEOMAR and at the University of Oldenburg. For correction of instrumental mass bias an expo-
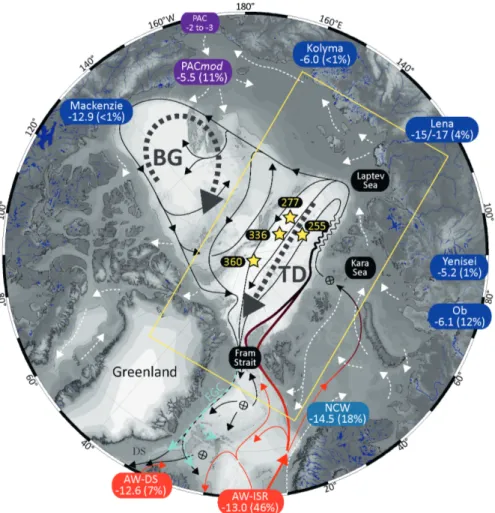
Fig: 1: Bathymetric map of the Arctic Ocean (IBCAO, JaKoBSSon et al. 2012) with known REE sources (anderSSon et al. 2008, charette et al. 2016, porcelli
et al. 2009, zimmermann et al. 2009, perSSon et al. 2011, lauKert et al. 2017a, b). The circulation scheme of the upper layers (large dashed grey arrows represent the Transpolar Drift (TD) and the Beaufort Gyre (BG), while dashed white lines indicate major shelf currents) and subsurface Atlantic and intermediate depth currents (solid black lines; red lines in addition indicate cooling and freshening of Atlantic-derived waters) are shown in addition (modified after rudelS et al.
2012). Dashed cyan lines indicate the East Greenland Current (EGC). REE sources with known εNd values are Atlantic-derived waters (AW) entering through the Iceland-Scotland Ridge (ISR) and the Denmark Strait (DS), Norwegian Coastal Water (NCW), Pacific-derived waters (PAC) and modified Pacific-derived waters (PACmod), major Siberian Rivers (Ob, Yenisei, Lena, Kolyma), and the Mackenzie River. The estimated Nd inputs of the corresponding sources are given as per- centage of the total Nd input into the AO taking into account volume transport and [Nd] of the sources (only rivers with discharges > 100 km3/yr are considered).
Circled crosses indicate sites of convection or sinking from intermediate and AW layers to deeper levels. Locations of the sea-ice samples obtained during PS80 are shown together with their station numbers. The area shown in Fig. 3 is marked by the yellow rectangle. The figure was modified from lauKert et al. (2017a) after production with Ocean Data View (Schlitzer 2017) and manual modification.
Abb. 1: Karte des Nordpolarmeeres mit Bathymetrie (IBCAO, (JaKoBSSon et al. 2012) und den bekannten REE Quellen (anderSSon et al. 2008, charette et al. 2016, porcelli et al. 2009, zimmermann et al. 2009, perSSon et al. 2011, lauKert et al. 2017a, b). Die Zirkulation der Oberflächenwässer (große gestrichelte graue Pfeile symbolisieren die Transpolardrift (TD) und den Beaufortwirbel (BG), wohingegen gestrichelte weiße Pfeile die Zirkulation auf den Schelfen darstel- len) sowie des Atlantischen Wassers und der Zwischenwässer (schwarze Pfeile; rote Pfeile deuten zudem die Abkühlung und Abnahme des Salzgehaltes vom Atlantischen Wasser an) ist zusätzlich dargestellt (modifiziert nach rudelS et al. 2012). Der Ostgrönlandstrom (EGC) ist ebenfalls angedeutet (türkise Pfeile).
Die REE Quellen mit bekannten Nd-Isotopensignaturen sind Atlantisches Wasser (AW) das den Island-Schottland-Rücken (ISR) und die Dänemarkstraße (DS) passiert, Norwegisches Küstenwasser (NCW), Pazifisches Wasser (PAC) und modifiziertes Pazifisches Wasser (PACmod), sowie die Sibirischen Flüsse (Ob, Jenissei, Lena, Kolyma) und der Mackenzie. Die geschätzten Nd-Einträge dieser Quellen sind als Prozentwerte angegeben und basieren auf deren Abflussmengen und Nd-Konzentrationen (hier wurden nur Flüsse mit Einträgen über 100 km3 pro Jahr berücksichtigt). Umrundete Kreuze markieren die Hauptgebiete der Tiefen- wasserbildung. Die Positionen der während der Expedition PS80 gewonnenen Meereisproben sind zusammen mit den Stationsnummern gegeben. Das in Abb. 3 gezeigte Gebiet ist gelb umrahmt. Die Abbildung wurde nach lauKert et al. (2017a) modifiziert, nachdem sie mit Ocean Data View (Schlitzer 2017) erstellt und manuell bearbeitet wurde.
nential mass fractionation was applied using a 146Nd/144Nd ratio of 0.7219. The measured 143Nd/144Nd ratios of the four samples were normalized to the value of 0.512115 for the JNdi-1 stan- dard (tanaKa et al. 2000). Based on repeated measurements of JNdi-1 and in-house standards with concentrations similar to those of the samples, the 2σ external reproducibility ranged between 0.2 and 0.5 εNd units for the individual measurement runs.
The REE concentrations were determined on centrifuged aliquots of the sea-ice meltwater using an online pre-con-
centration (OP) ICP-MS technique at GEOMAR by directly coupling a “seaFAST” system (Elemental Scientific Inc., Nebraska, USA) to an ICP-MS (Agilent 7500ce) (hathorne et al. 2012). The method of hathorne et al. (2012) was further improved by using an 8 ml sample loop and by prepa- ration of calibration standards with a mixed REE solution of a seawater-like composition in a natural seawater matrix (see also oSBorne et al. 2015). Repeated measurements of GEOTRACES inter-calibration sample BATS 15 m (van de flierdt et al. 2012) were used to monitor the external repro- ducibility, which at the 95 % confidence level (2σ) is below 8 % for La, Ce, Pr, Nd, Gd, Dy, Er and Yb, and below 12 % for Sm, Eu, Tb, Ho, Tm and Lu.
To determine the pathways of the sea ice and to identify the source areas, the locations of the samples were tracked back- ward using a combination of ice drift and concentration data obtained from low-resolution passive microwave satellites.
Ice motion data used in this study are provided by different institutions and have been widely used in sea-ice studies (e.g., Spreen et al. 2011, Sumata et al. 2014, Krumpen et al. 2016).
To track sea ice, two different sets of ice drift products were used: During the summer months (June to August), the Polar Pathfinder Sea Ice Motion product provided by the National Snow and Ice Data Center (NSIDC) given on a 25 km grid (tSchudi et al. 2016) was applied. During the rest of the year, tracking is achieved with sea-ice motion data provided by the Center for Satellite Exploitation and Research (CERSAT) at the Institut Francais de Recherche pour d’Exploitation de la Mer (IFREMER). Motion data are available with a grid size of 62.5 km, using time intervals of 3 days for the period between September and May (girard-ardhuin & ezratY 2012). Sea-ice concentration data used in this study have been obtained from NSIDC. Following Krumpen et al. (2016) the tracking procedure works as follows: Using motion and concentration data, a specific ice area is tracked backwards until: (a) the ice reaches a position next to a coastline, (b) the ice concentration at a specific location reaches a threshold value of 15 %, below which ice parcels are considered lost, or (c) the tracking time exceeds 4 years.
RESULTS AND DISCUSSION
Tracing Siberian freshwater pathways with Nd isotopes Despite the known difficulties associated with the modi- fications of the seawater Nd isotope composition through seawater-particle interactions in particular Arctic regions (see section 2), a general limitation for the quantitative determina- tion of shallow water mass compositions and thus the assess- ment of freshwater pathways based on Nd isotope mixing calculations is given by the fact that the source-defined water mass components can only be quantified with Nd isotopes and salinity or Nd concentrations ([Nd]) if three or less Nd sources contribute (i.e., due to the availability of only two “conserva- tive” parameters). Most shallow waters in the AO are char- acterized by the contribution of four or more Nd sources due to admixture of freshwater from the various Arctic rivers, inhibiting unambiguous quantification of their source-defined components. In particular, this is likely the case for shallow Arctic-derived Polar Water that left the AO in summer 2012 through the western Fram Strait via the East Greenland
Current (EGC). lauKert et al. (2017a) found that the average Nd isotope composition of this water mass plots close to the mixing line between Atlantic-derived waters that enter the AO through Fram Strait and modified Pacific-derived waters orig- inating from the Chukchi Sea shelf in εNd-salinity and εNd-[Nd]
space (Fig. 2). The offset from the mixing line towards lower salinity and higher [Nd] was attributed to admixture of mete- oric waters (neglecting precipitation, this is essentially only riverine freshwater). The amount of these waters was found to be 8 % or less based on mass balance calculations involving stable oxygen isotopes and nutrients. lauKert et al. (2017a) noted that contributions of riverine Nd can originate from any of the major Arctic rivers and would result in varying increases in [Nd] and changes in εNd. In fact, as discussed below, contri- butions from more than one Arctic river to this Polar Water are highly likely, which strictly speaking inhibits quantification of the source-defined components. Nevertheless, lauKert et al. (2017a) argued that the low amount of riverine fresh- water contained in Polar Water in the Fram Strait implies a relatively low contribution of riverine Nd and suggested that the shift of the εNd signature caused by addition of riverine Nd was generally small. After excluding significant shifts of the εNd signature caused by addition of riverine Nd, lauKert et al. (2017a) estimated the proportion of Atlantic- and modified Pacific-derived waters and concluded that the Polar Water had been advected through the Amundsen and Makarov Basins based on a comparison with Nd isotope literature data.
The suggestion by lauKert et al. (2017a) regarding the rela- tively small shift in the εNd signature of Polar Water exported from the AO caused by the addition of riverine freshwater is supported by the fact that most of the riverine dissolved Nd is removed in the estuaries and on the Siberian shelves (lauKert et al. 2017b). Another argument for a relatively small shift in the εNd signature is that freshwater from likely more than one Arctic river was admixed to the Polar Water, as mentioned above. The average Nd isotope composition of the major Arctic rivers is near -8.5 based on a calculation that takes into account discharge (data from R-ArcticNET, lammerS
& ShiKlomanov 2000) and [Nd] (data from porcelli et al. 2009, zimmermann et al. 2009, perSSon et al. 2011).
This signature is similar to that of the exported Polar Water (εNd = -8.8, Fig. 2), implying that, assuming contributions from all major Arctic rivers, the marine Nd isotope composition of the Polar Water was not strongly modified through the admix- ture of the freshwater. Mixing between freshwater derived from the different Siberian rivers was previously suggested to occur even before the Polar Water is advected into the central AO (porcelli et al. 2009). The limited data available from the Siberian shelves, however, did not allow a straightforward determination of the individual contributions of the Siberian rivers (cf., porcelli et al. 2009).
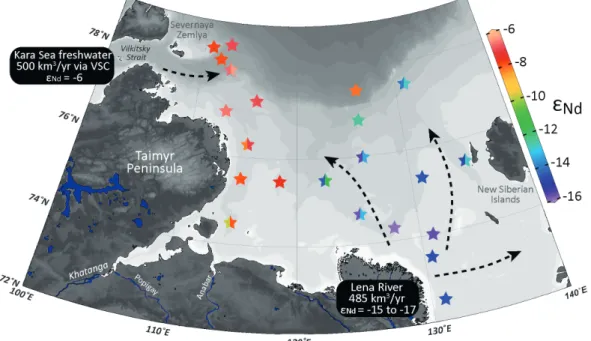
New dissolved Nd isotope and REE data recently reported by lauKert et al. (2017b) for the Laptev Sea filled the data gap between the Siberian estuaries and the central AO and now allow a more detailed determination of the riverine fresh- water pathways. Relatively radiogenic freshwater (εNd = -6) is advected from the Kara Sea to the Laptev Sea via the Vilkitsky Strait Current (Fig. 3), where it mixes with northward flowing relatively unradiogenic freshwater supplied by the Lena River (εNd = -15 to -16 in summer). The Kara Sea freshwater is likely a mixture between freshwater supplied by the Yenisei
and Ob rivers, both characterized by relatively radiogenic εNd signatures between -5 and -6, which can be inferred from Nd isotope based mixing calculations (lauKert et al. 2017b) and results of three-dimensional coupled ice-ocean-models implying extensive mixing of freshwater supplied by these two rivers within the surface layer of the Kara Sea (harmS et al. 2000). The transport of Kara Sea freshwater through
the Vilkitsky Strait was determined to be about 500 km3/yr (Janout et al. 2015), which is equivalent to about half of the freshwater volume supplied by the two major rivers draining into the Kara Sea. Most of the Kara Sea freshwater that enters the Laptev Sea is advected eastwards along the Laptev margin, and only a small proportion is advected onto the Laptev shelf or into the Eurasian Basin (Janout et al. 2015). Admixture of
Fig. 2: Assessment of the Arctic source of Polar Water that leaves the AO through the Fram Strait (modified after lauKert et al. 2017a). The most radiogenic PW sample (red symbol) can be explained by admixture of AW and PACmod and a small amount (6-8 %) of river water (red arrows). The AW to PACmod ratio for this Polar Water is about 3:2. The Polar Water at Fram Strait shares characteristics with shallow samples from the Amundsen and Makarov Basins. The average Nd isotope composition of all Arctic rivers is shown as a grey line.
Abb. 2: Bestimmung der Zusammensetzung des arktischen Wassers, das das Nordpolarmeer durch die Framstraße verlässt (modifiziert nach lauKert et al. 2017a).
Die radiogenste Probe dieser Wassermasse (rotes Symbol) kann durch eine Mischung zwischen AW und PACmod und kleineren Zumischungen (6-8 %) von arkti- schem Flusswasser erklärt werden. Das Verhältnis von AW und PACmod im arktischen Wasser ist etwa 3:2 und weist Ähnlichkeiten zu oberflächennahen Proben aus dem Amundsen und dem Makarov Becken auf. Die durchschnittliche Nd-Isotopenzusammensetzung aller arktischen Flüsse ist als graue Linie dargestellt.
Fig. 3: Surface distribution of Nd isotope compositions (color-coded stars) of the summers of 2013 and 2014 (see lauKert et al. 2017b for the distribution during the individual years) shown together with the general circulation scheme (Janout et al., 2015). For resampled stations, the εNd signatures of both years are shown (divided color-coded stars). Figure was produced using Ocean Data View (Schlitzer 2017) and modified manually.
Abb. 3: Darstellung der Oberflächenverteilung der Nd-Isotopensignaturen (farbkodierte Sterne) aus den Sommern der Jahre 2013 und 2014 (siehe lauKert et al. 2017b für die Verteilung der einzelnen Jahre) zusammen mit der schematischen Zirkulation (Janout et al., 2015). Für doppelt beprobte Stationen sind beide Nd-Isotopensignaturen dargestellt (unterteilte farbkodierte Sterne). Die Abbildung wurde mit Ocean Data View (Schlitzer 2017) erstellt und manuell bearbeitet.
northward flowing freshwater from the Lena River to the Kara Sea freshwater is documented by less radiogenic seawater εNd signatures in the northeastern Laptev Sea (lauKert et al.
2017b), and most of the shelf waters that leave the Laptev Sea towards the central AO are characterized by εNd signatures ranging between -8 and -14 and [Nd] between 30 and 100 pmol/kg (for Nd isotope signatures, see Fig. 3). These char- acteristics are similar to those reported for shallow seawater samples recovered from the Amundsen and Makarov Basins (Fig. 2; porcelli et al. 2009, zimmermann et al. 2009), indi- cating that mixing between Kara Sea freshwater and Lena River freshwater in variable amounts occurs before the Sibe- rian waters are advected to the central AO. The limited data available from the central AO do not allow to constrain if pure Kara Sea shelf waters in addition advected to the central AO and transported at least to some extent within the TD (e.g., potentially advected through the passage between the Franz Josef Land and Severnaya Zemlya or through the Barents Sea). However, the observations by lauKert et al. (2017a) summarized above imply that mixing with freshwater derived from other rivers and modified Pacific-derived waters at the latest occurs before the Siberian waters are advected to the western Fram Strait and leave the AO via the EGC.
Our observations show that the contribution of various Nd sources with similar characteristics often inhibits a quantita- tive assessment of the individual contributions of the different Arctic rivers based on Nd isotopes, which complicates assess- ments of Arctic freshwater pathways. A more reliable deter- mination of freshwater pathways is only possible for regions where three or less Nd sources contribute, as for example shown for the Laptev Sea (lauKert et al. 2017b). Neverthe- less, given that all major Siberian rivers have relatively radio- genic Nd isotope compositions except the Lena River (major contributions of the Mackenzie River to shallow waters in the Eurasian Basin are unlikely, cf., porcelli et al. 2009), one prospective application of Nd isotopes for the Eurasian Basin may be to qualitatively trace the admixture and transport of Lena River freshwater in the TD. This, however, requires more seawater Nd isotope and concentration data from the central AO.
Tracing source areas of Arctic sea ice with Nd isotopes and REEs
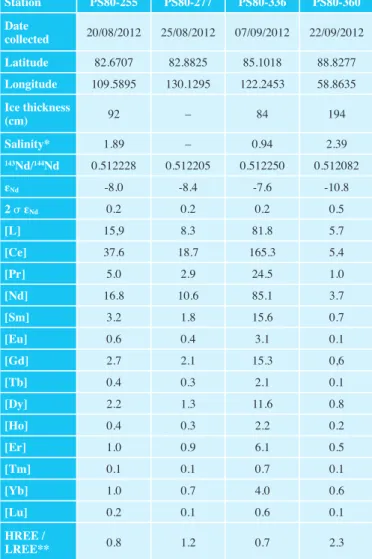
The new sea-ice data presented here (Tab. 1) are available from the PANGAEA database. Compared to most freshwater-influ- enced shallow waters in the AO, the sea ice is characterized by lower salinities and overall lower REE concentrations (in the following represented by [Nd]). The sea-ice sample from station 336 has the lowest salinity (S = 0.94), the most radiogenic Nd isotope composition with εNd = -7.6 ±0.2 and the highest [Nd] near 85 pmol/kg, whereas the sea-ice sample from station 360 has the highest salinity (S = 2.39), the least radiogenic Nd isotope composition with εNd = -10.8 ±0.5 and the lowest [Nd] near 4 pmol/kg (see also Figs. 4 and 5). Sea-ice samples recovered from stations 255 and 277 are characterized by intermediate values. The PAAS-normalized (mclennan 2001) REE patterns of sea-ice samples recovered at stations 255, 277 and 336 are essentially flat or slightly hump-shaped (Fig 5). In contrast, the REE pattern of the sea ice sampled at station 360 is more similar to open ocean seawater patterns
Station PS80-255 PS80-277 PS80-336 PS80-360 Datecollected 20/08/2012 25/08/2012 07/09/2012 22/09/2012 Latitude 82.6707 82.8825 85.1018 88.8277 Longitude 109.5895 130.1295 122.2453 58.8635 Ice thickness
(cm) 92 – 84 194
Salinity* 1.89 – 0.94 2.39
143Nd/144Nd 0.512228 0.512205 0.512250 0.512082
εNd -8.0 -8.4 -7.6 -10.8
2 εNd 0.2 0.2 0.2 0.5
[L] 15,9 8.3 81.8 5.7
[Ce] 37.6 18.7 165.3 5.4
[Pr] 5.0 2.9 24.5 1.0
[Nd] 16.8 10.6 85.1 3.7
[Sm] 3.2 1.8 15.6 0.7
[Eu] 0.6 0.4 3.1 0.1
[Gd] 2.7 2.1 15.3 0,6
[Tb] 0.4 0.3 2.1 0.1
[Dy] 2.2 1.3 11.6 0.8
[Ho] 0.4 0.3 2.2 0.2
[Er] 1.0 0.9 6.1 0.5
[Tm] 0.1 0.1 0.7 0.1
[Yb] 1.0 0.7 4.0 0.6
[Lu] 0.2 0.1 0.6 0.1
HREE /
LREE** 0.8 1.2 0.7 2.3
Tab. 1: Sampling date, location, ice thickness, salinity, Nd isotope compositions and REE concentrations for the sea-ice samples recovered during cruise PS80 (ARKXXVII/3) on RV “Polarstern”. * core average, ** normalized to PAAS (mclennan 2001).
Tab. 1: Zeitpunkt der Beprobung, Beprobungsort, Eismächtigkeit, Salinität, Nd-Isotopensignaturen und REE Konzentrationen von Meereisproben, die während der Expedition PS80 (ARKXXVII/3) mit FS „Polarstern“ genommen wurden. * Eiskern Mittelwert; ** normiert nach PAAS (mclennan 2001).
(Fig. 5), which commonly exhibit a depletion of the light (L) REEs compared to the heavy (H)REEs and a pronounced Ce anomaly (e.g., hathorne et al. 2015).
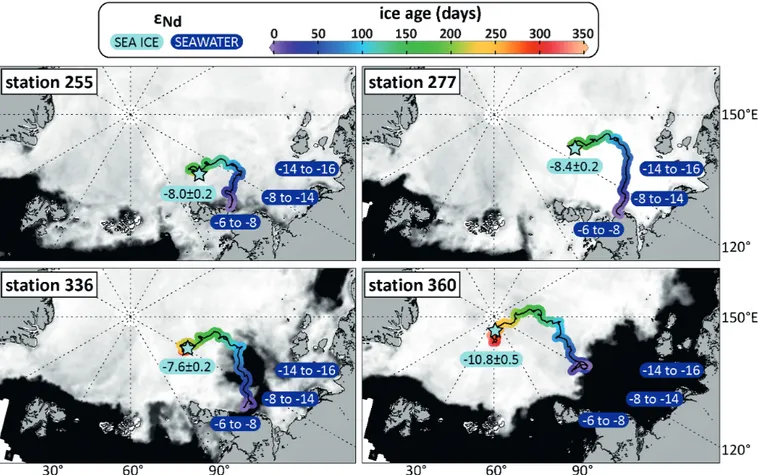
The sea-ice trajectories determined based on satellite-derived ice drift and concentration data suggest that the sea ice with the more radiogenic Nd isotope signature (station 336) likely formed east of Vilkitsky Strait, while the sea ice with the least radiogenic signature (station 360) presumably formed north of the Laptev Sea (Fig. 4). The sea ice with slightly less radio- genic εNd signatures below -8 was formed north (station 255) and south (station 277) of the eastern part of the Vilkitsky Strait. The comparison with seawater Nd isotope compositions determined for surface waters in the Laptev Sea (lauKert et al. 2017b) reveals that the εNd signatures of the sea ice are similar to those expected for the surface waters of its suggested source areas (Fig. 4). In detail, the most radiogenic sea-ice floes potentially derived from the area east of Vilkitsky Strait (station 336; εNd = -7.6) and thus must have formed in
shelf waters with relatively radiogenic εNd signatures reflecting high contributions of Kara Sea freshwater (εNd = -6). The latter is advected to this area via the Vilkitsky Strait Current, which flows eastward along the Laptev shelf margin (Janout et al.
2015). Sea-ice floes derived from the areas north and south of the eastern Vilkitsky Strait (stations 255 and 277) likely formed in waters that contain less Kara Sea freshwater and therefore have slightly less radiogenic seawater Nd isotope compositions (εNd = -8.0 to -8.4). Even the less radiogenic signature (εNd = -10.8) of the sea ice that originated north of the Laptev Sea (station 360) is in agreement with formation in surface waters presumably resulting from a mixture of Kara Sea freshwater and Lena River freshwater (εNd ≤ -15).
The geochemical sea-ice characteristics described above, together with the information obtained from our backtracking approach based on satellite data support recent considerations that the marine and riverine REEs are only to a small extent incorporated into the sea ice (lauKert et al. 2017b). However, the data also suggest that Nd isotope and REE signatures are preserved during sea-ice transport. It has been shown earlier that small fractions of seawater-derived salt and other seawater constituents (e.g., dissolved organic matter and inor- ganic nutrients) remain trapped in the interstitial brine after the sea ice has been formed (thomaS et al. 2010 and refer-
Fig. 4: Maps showing the sea ice extent during the recovery of the four sea-ice samples in 2012, along with drift trajectories based on satellite-derived data (color coded for the age of the ice) and the Nd isotope compositions of the sea-ice samples and surface waters of the Laptev Sea (see also lauKert et al. 2017b). The sea- ice signatures are similar to those expected in surface waters of the source areas of the drifting sea ice. Figures were produced using Ocean Data View (Schlitzer
2017) and modified manually.
Abb. 4: Meereisbedeckung während der Beprobung der Eisproben im Jahr 2012 zusammen mit den auf Satellitendaten basierenden Drift-Trajektorien und den Nd-Isotopenzusammensetzungen der Meereisproben und der Oberflächenwässer der Laptewsee (siehe auch lauKert et al. 2017b). Die Nd-Isotopensignaturen der Eisproben sind konsistent mit den Oberflächenwassersignaturen, die in den Entstehungsgebieten des Meereises erwartet werden. Die Abbildungen wurden mit Ocean Data View (Schlitzer 2017) erstellt und manuell bearbeitet.
Fig. 5: PAAS normalized (mclennan 2001) REE distribution patterns of the four sea-ice samples shown together with surface waters from the Laptev Sea (data from lauKert et al. 2017b).
Abb. 5: PAAS-normierte (mclennan 2001) REE-Verteilungsmuster der vier Meereisproben zusammen mit den Konzentrationen der Oberflächenwäss- er aus der Laptewsee (Daten von lauKert et al. 2017b).
ences therein). Based on our observations, we suggest that the incorporation of the marine or riverine REEs is proportional to this salt entrapment. This is best evidenced by a negative correlation between [Nd] and salinity and a positive correla- tion between the HREE/LREE ratio and salinity in our sea-ice samples, which agrees with an inverse relationship between the REE concentrations and salinity observed in seawater of the Laptev Sea (lauKert et al. 2017b).
The LREE concentrations in the sea ice recovered from station 336 are highest (e.g., [Nd] = 85 pmol/kg), and thus even higher than those of the surface waters in its suggested source area (~50 pmol/kg, lauKert et al. 2017b). These elevated LREE concentrations may either reflect incorpo- ration of younger Kara Sea freshwater characterized by less riverine REE removal or may result from contributions of particulate REEs (i.e., >0.2 μm) that may have been present in the unfiltered molten sea-ice. In addition, the HREE concen- trations of all sea-ice samples are slightly more depleted than the HREE concentrations of surface waters from the Laptev Sea (Fig. 5), resulting in generally lower HREE/LREE ratios in the sea-ice samples than in the corresponding Siberian shelf waters. The difference in REE patterns between the sea ice and the source waters may also be related to contribution of particulate REEs (e.g., contribution of particles with elevated LREEs and MREEs), or alternatively reflect differences in the incorporation of the distinct dissolved size pools characterized by dissimilar REE distribution patterns. Such different incor- poration of the truly dissolved (e.g., <1 KDa) and colloidal (e.g., >1 KDa and <0.2 μm) REEs during sea-ice formation is in line with the general observation that particle size plays a key role for the incorporation of seawater constituents into the sea ice (JanSSenS et al. 2016 and references therein). No truly dissolved REE data have been reported for open Arctic Ocean seawater to date, but marked differences between the REE patterns of the truly dissolved and the colloidal fractions have recently been observed for riverine freshwater in the Amazon Basin (e.g., merSchel et al. 2017b). We therefore speculate that such differences also exist for the different size fractions of the freshwater-rich surface layer of the Laptev Sea, and that combined with size-dependent REE incorporation during sea-ice growth they may account for the depletion of HREEs observed in our sea-ice samples. However, here we refrain from further discussions of this observation given that we cannot entirely exclude contributions from partially dissolving particulate phases in our samples. Apart from the differences between the sea ice and the seawater data, the high correla- tion between the REE concentrations and the HREE/LREE ratios with salinity argue for at least partial preservation of the seawater REE patterns of the source waters. This is supported by the more seawater-like REE pattern of sea ice from station 360 that mirrors REE characteristics of higher salinity waters the ice presumably formed from.
CONCLUDING REMARKS
Tracing freshwater pathways in the Arctic Ocean with Nd isotopes is challenging due to contributions of various riverine REE sources with similar characteristics. For shallow waters circulating on the Siberian shelves (i.e., the main source regions of the TD), new observations indicate that Nd isotopes can successfully be applied to quantify the individual contri-
butions of the different Siberian rivers. Further downstream the TD, admixture of freshwater from other Arctic rivers and Pacific-derived waters prevents such a quantitative assessment of the individual freshwater contributions. Nevertheless, the distinctly unradiogenic Nd isotope composition of the Lena River may still allow at least for a qualitative assessment of the transport of freshwater it supplies, thereby also providing important information on freshwater transport and mixing in the TD. However, more seawater Nd isotope and concentra- tion data are needed to reliably trace the transport of Lena River freshwater in the Eurasian Basin of the Arctic Ocean.
Apart from studies discussing the provenance of sediment entrained and transported within drifting Arctic sea ice in the context of paleoceanographic reconstructions (e.g., nürn-
Berg et al. 1994, tütKen et al. 2002, Werner et al. 2014), there are no previously published works using Nd isotopes or REEs to determine the source regions of drifting Arctic sea ice. We show for the first time that these tracers can be used to identify the source areas of sea ice and their mixtures provided that the marine and riverine Nd isotope composi- tions and the corresponding REE distribution patterns of all source areas are known. Our most striking observation is that marine and riverine Nd isotope compositions are preserved during sea-ice formation and long-range transport. For sea ice formed close to distinct REE sources, this approach has the potential to avoid the problem of mixing of multiple sources that affects freshwater tracing in the AO based on dissolved surface water signatures. We further observe that the incorpo- ration of the REEs into the sea ice is proportional to salinity variations and that the REE characteristics are at least partly preserved. However, contributions from particulate phases cannot be entirely excluded for our unfiltered sea-ice samples, which clearly requires dedicated future studies that investigate REE characteristics of the different size fractions in sea ice and their differential incorporation during sea-ice formation.
ACKNOWLEDGMENTS
We would like to thank the Captain and Crew of the RV
“Polarstern” for help in collecting the sea-ice samples. All members of the project “Laptev Sea System” and the Captain and Crew of the RV “Viktor Buynitskiy” are acknowledged for their help in collecting the seawater samples in the Laptev Sea. In addition, we want to thank Jutta Heinze (GEOMAR) for laboratory assistance and Katharina Pahnke and Per Andersson for helpful comments on the manuscript. The German Federal Ministry of Education and Research (BMBF) and the Ministry of Education and Science of the Russian Federation are acknowledged for support of the “Laptev Sea System” project (BMBF grants 03G0833 and 03F0776).
Dorothea Bauch acknowledges financial support from DFG project BA1689.
References
Alkire, M.B., Falkner, K.K., Rigor, I., Steele, M. & Morison, J. (2007): The return of Pacific waters to the upper layers of the central Arctic Ocean.- Deep Sea Res. PT I 54: 1509-1529, doi.org/10.1016/j.dsr.2007.06.004 Anderson, L.G., Jutterstrom, S., Kaltin, S., Jones, E.P. & Bjork, G.R. (2004):
Variability in river runoff distribution in the Eurasian Basin of the Arctic Ocean.- J. Geophys. Res. Oceans 109, doi.org/10.1029/2003jc001773 Andersson, P.S., Porcelli, D., Frank, M., Bjork, G., Dahlqvist, R. &