https://doi.org/10.1007/s41748-019-00105-0 ORIGINAL ARTICLE
Changes in Indian Summer Monsoon Using Neodymium (Nd) Isotopes in the Andaman Sea During the Last 24,000 years
Harunur Rashid1,2 · Alexandra T. Gourlan3 · Brittany Marche2 · Kaylyn Sheppard2 · Nabil Khélifi4
Received: 26 April 2019 / Accepted: 18 June 2019 / Published online: 27 June 2019
© The Author(s) 2019
Abstract
Dramatic changes from a cold and dry last glacial to a warm and wet Holocene period intensified the Indian summer monsoon (ISM), resulting in vigorous hydrology and increased terrestrial erosion. Here we present seawater neodymium (Nd) data (expressed in εNd) from Andaman Sea sediments to assess past changes in the ISM and the related impact of Irrawaddy–
Salween and Sittoung (ISS) river discharge into the Andaman Sea in the northeastern Indian Ocean. Four major isotopic changes were identified: (1) a gradual increase in εNd toward a more radiogenic signature during the Last Glacial Maximum (22–18 ka), suggesting a gradual decrease in the ISS discharge; (2) a relatively stable radiogenic seawater εNd between 17.2 and 8.8 ka, perhaps related to a stable reduced outflow; (3) a rapid transition to less radiogenic εNd signature after 8.8 ka, reflecting a very wet early–mid-Holocene with the highest discharge; and (4) a decrease in εNd signal stability in the mid–late Holocene. Taking into account the contribution of the ISS rivers to the Andaman Sea εNd signature that changes proportion- ally with the strengthening (less radiogenic εNd) or weakening (more radiogenic εNd) of the ISM, we propose a binary model mixing between the Salween and Irrawaddy rivers to explain the εNd variability in Andaman Sea sediments. We hypothesize that the Irrawaddy river mainly contributed detrital sediment to the northeastern Andaman Sea for the past 24 ka. Our εNd data shed new light on the regional changes in Indo-Asian monsoon systems when compared with the existing Indian and Chinese paleo-proxy records.
Keywords Nd isotopes · Continental erosion · Indian summer monsoon · Andaman Sea · Deglacial climate
1 Introduction
The Indian summer monsoon (ISM) is a dynamic climate system that brings enormous changes in the local hydrologi- cal cycle during the summer (Cane 2010). ISM is the product
of a pressure difference between the Tibetan Plateau and the tropical Indian Ocean resulting from tropospheric heating.
This seasonal low atmospheric pressure at the Tibetan Pla- teau relative to high pressure over the cooler Indian Ocean sets the stage for cyclonic summer monsoon wind patterns (Webster et al. 1998). Evaporation from the tropical Indian Ocean adds moisture, and latent heat intensifies the ISM.
On annual to decadal timescales, the ISM intensity is influenced by changes in internal boundary conditions such as tropical Indian Ocean sea-surface temperature (Webster et al. 1998), Eurasian snow cover (Barnett et al. 1988), and migration of the Intertropical Convergence Zone (ITCZ).
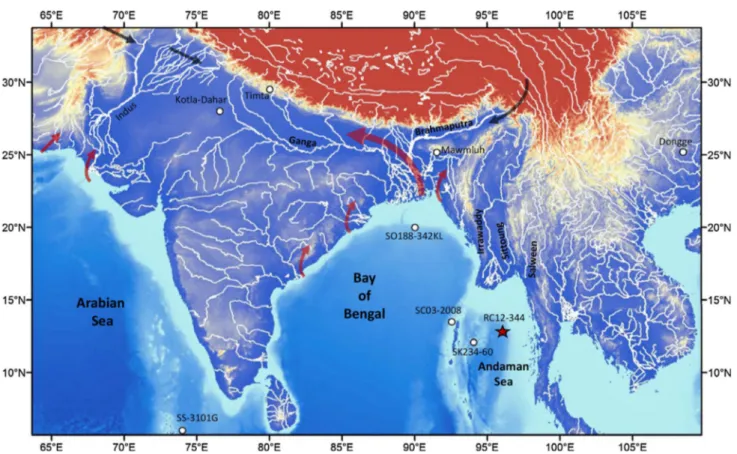
About 80% of the monsoonal precipitation falls on the Ganga–Brahmaputra–Meghna (GBM) catchments (Hasan et al. 2014) and Irrawaddy–Salween–Sittoung (ISS) rivers (Fig. 1), draining eastern Himalaya covering China, most of Myanmar, and western Thailand (Robinson et al. 2014). As a result, high discharge into the Bay of Bengal and Andaman Sea (Murata et al. 2008) during the summer is a direct deter- minant of sea-surface conditions. On average, ~ 1270 km3/
Electronic supplementary material The online version of this article (https ://doi.org/10.1007/s4174 8-019-00105 -0) contains supplementary material, which is available to authorized users.
* Harunur Rashid
Harunurbhola@gmail.com
1 College of Marine Sciences, Shanghai Ocean University, Shanghai, China
2 Earth and Environmental Sciences, Memorial University of Newfoundland, 20 University Drive, Corner Brook, NL, Canada
3 Université Grenoble Alpes, ISTerre, CS 40700, 38058 Grenoble Cedex 9, France
4 GEOMAR Helmholtz Centre for Ocean Research Kiel, Wischhofstraße 1-3, 24148 Kiel, Germany
year of freshwater (Milliman and Farnsworth 2011) out- flow occurs through the GBM rivers, whereas ~ 695 km3/ year freshwater discharges through the ISS rivers. The ISS catchments receive precipitation in summer to early autumn (Sen Roy and Kaur 2000). Table 1 provides a list of annual discharge and sediment load for each drainage basin and
other pertinent information about the GBM and ISS rivers.
These riverine discharges and sediment loads, hemipelagic and pelagic sediments deposited in the Andaman Sea are potential archives to reconstruct the past ISM changes and ensuing erosional history of most of Myanmar and eastern Himalaya.
Fig. 1 Location of past Indian summer monsoon (ISM) proxy records used in the study as well as the Indus–Ganga–Brahmaputra–Meghna and Irrawaddy–Salween–Sittoung rivers and their numerous tributar-
ies and distributaries. Red and black arrows depict the directions of the wind during the summer and winter, respectively. Star denotes the location of Andaman Sea core RC12-344
Table 1 Drainage area, discharge, sediment yield, εNd of river sediments and references related to the principal rivers in the northeastern Indian Ocean
River name Drainage area (106 km2)
Discharge (km3/yr) Sediment yield (MT/
yr)
εNd particulate References
Irrawaddy 0.413 440 ± 49 364 ± 60 −10.7 to −8.3 Allen et al. (2008), Bender (1983), Chapman et al. (2015), Colin et al. (1999), Robinson et al. (2007)
Salween 0.272 211 180 −18.1 to −13.6 Awasthi et al. (2014), Bender (1983), Chapman et al. (2015), Robinson et al. (2007)
Sittoung 0.01452 43 27–36 Robinson et al. (2007)
GBM 1.75 1270 1060 −18.2 to −13.6 Milliman and Meade (1983), Milliman and Syvitski ( 1992), Tri- pathy et al. (2011), Milliman and Farnsworth (2011), Lupker et al. (2013)
2 Application of Neodymium (Nd) Isotopes in the Northern Tropical Indian Ocean
Marine sediments provide a record of past terrestrial and erosional history and accompanying changes in the sea- surface conditions and ocean circulation. Nd isotopes have become a prominent proxy in reconstructing past changes in weathering and erosion and seawater (Frank 2002; Ahmad et al. 2005; Gourlan et al. 2010), in which the isotopic ratios are expressed in the typical εNd notation, where
The εNd proxy is sensitive to precipitation on land because Nd is added to the oceans by weathering of terrestrial rocks and sediments. It is unlikely that the isotopic character of Nd would be significantly modified during chemical weather- ing (Borg and Banner 1996) or via grain-size sorting dur- ing transport (Lupker et al. 2013). Differences in age and composition of rocks surrounding each ocean give distinct εNd signatures. Hence, each water mass has a characteristic εNd signature, enabling it to be used as a proxy for changes in the circulation. The residence time of Nd (≤ 1000 years) is shorter than that of the mixing time of the global ocean, and its isotopic distribution in each ocean reflects contri- butions from local sources (Jeandel 1993; Tachikawa et al.
2017; Frank 2002; Rempfer et al. 2011). As the dissolved fraction of rivers is defined by a colloidal fraction (0.20 μm or 0.45 μm − 1 nm) and a truly dissolved fraction (< 1 nm) (Buffle and Van Leeuwen 1992; Stumm 1993), mineral col- loids represent the highest portion of the total Nd content of natural river waters. The consequence is that Nd in the marine environment is adsorbed on sub-micro colloids such as Fe-oxyhydroxides or clay minerals or can occur on sub- micro colloids such as carbonate or rare-earth phosphate minerals.
Direct Nd measurements of Bay of Bengal and Anda- man Sea surface seawater suggest a clear link between the riverine input of Nd associated with discharges and εNd vari- ations in the northern Indian Ocean (Amakawa and Nozaki 1998; Singh et al. 2012). Using marine sediments of the Bay of Bengal, Burton and Vance (2000), Stoll et al. (2007), Gourlan et al. (2008, 2010), Achyuthan et al. (2014), Braun et al. (2015), Yu et al. (2017), Joussain et al. (2017), and Sebastian et al. (2019) reconstructed past changes in the εNd. Further, Colin et al. (1999), Awasthi et al. (2014), Ali et al.
(2015), and Miriyala et al. (2017) reported changes in inputs from the Irrawaddy, Salween, and Sittoung river during the late Pleistocene using Andaman Sea sediments. The authors consistently linked changes in εNd with the intensity of the 𝜀Nd=
[ (143
Nd/144Nd)
sample − (143
Nd/144Nd) standard (143
Nd/144Nd) standard
]
×104 (143
Nd/144Nd)
standard=0.512638.
ISM. Cogez et al. (2013) applied two different statistical methods to a global compilation of Nd isotopes in oceans.
The authors showed an important contrast in εNd between the continental margins and open ocean, and reported that the influence of the margins (where Nd is injected into the ocean) is important up to a characteristic distance of 3500 km.
3 Study Objectives
Using hydrography parameters, Tachikawa et al. (2017) recently established empirical equations predicting the main deepwater εNd trends and observed that some continental margin basins such as the Bay of Bengal and the Andaman Basin are decoupled from the global trends. The authors argue that the εNd of seawater and archives are influenced by the local/regional sources and concluded that the detrital influence from the continent is dominant on seawater within 1000 km of the margins. Additionally, Rempfer et al. (2011) suggested that the boundary exchange between seawater and the continental margins represent the major source (~ 90%) of Nd and that the εNd variations resulting in changes in river or dust input are largely constrained to < 1 km of the water column. In light of the above findings, we hypothesize that changes in the riverine flux into the Bay of Bengal and Andaman Sea related to change in the ISM would be likely reflected by changes in the local/regional seawater εNd. In this study, we present the past 24 ka ISM changes based on εNd proxy records from the Andaman Sea sediment core RC12-344 (Fig. 1). By extracting the Nd trapped in the car- bonate fraction and Fe–Mn coatings (interpreted as a paleo- seawater signal; Gourlan et al. 2008), we reconstruct changes in the sea-surface conditions.
4 Potential Sources of Nd in the Andaman Sea
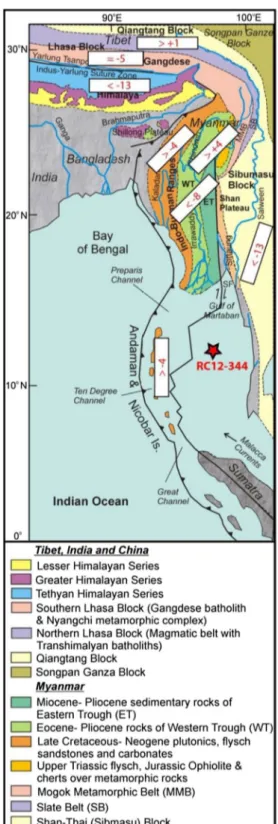
The ISS rivers traverse heterogeneous Myanmar bedrock (Fig. 2) resulting in a specific εNd signature. The Irrawaddy catchment includes Cretaceous to mid-Cretaceous flysch of the western Indo-Burman ranges, Eocene-Miocene, and Quaternary sediments of the Myanmar Central Basin, and the Late Precambrian and Cretaceous-Eocene metamorphic, basic, and ultra-basic rocks of the eastern Himalaya. At pre- sent, only two εNd data (−10.7; Colin et al. 1999; −8.3; Allen et al. 2008) are available from the modern river sediments of the Irrawaddy, which were extracted from the silicate frac- tion. The Salween and eastern Irrawaddy tributaries drain Precambrian, Oligocene-Tertiary sedimentary, and acidic and metamorphic rocks of the eastern Shan Plateau (Socquet and Pubellier 2005). These rivers drain similar catchments
as those of the GBM system. Awasthi et al. (2014) proposed comparable εNd as the GBM catchment values vary from
−18.1 to −13.6. The Sittoung river drains slates and meta- morphic belts like the Salween on the eastern part of the Shan Plateau. Although no εNd is extant for the Sittoung river, the similarity in the geology to that of the Salween watershed argues in favor of finding comparable εNd for both the Irrawaddy and Salween rivers.
The Andaman Islands make a minor contribution to the Andaman Sea εNd budget, because the presence of coral reefs limits sediment discharge (Ray et al. 2011). The modern rivers drain the Paleogene Indo-Burman ranges (εNd ≈ −4;
Allen et al. 2008), and thus the GBM rivers have a smaller impact on the Andaman Sea εNd. The existence of current from the Bay of Bengal to the Andaman Sea (e.g., Ahmad et al. 2005; Awasthi et al. 2014) has been reported. However, the influence of this current is limited due to the bathymetric isolation during the Last Glacial Maximum (LGM). Carbon isotopes in benthic foraminifers suggest an indistinguishable change in water–mass between the Holocene and LGM at site RC12-344 (Naqvi et al. 1994). During the LGM, the sea level dropped by 120–130 m compared to modern sea level, and summer surface circulation was weaker in the Bay of Bengal. If a flow entered the Andaman Sea at that time, it would have been through the Preparis South Chan- nel, which is ~ 200 m deep. Any contribution by the surface circulation through this channel into the Andaman Sea is considered negligible due to sea-level lowstand. Therefore, with an annual sediment discharge of 350 MT (Table 1) into the northern Andaman Sea (Ramaswamy et al. 2004), the ISS rivers are the primary contributors to the Andaman Sea εNd signature.
5 Materials and Methods
Core RC12-344 (12.46°N, 96.04°E; water depth 2.1 km) was retrieved from the Andaman Sea (Fig. 1) during the 1969 R/V Robert D. Conrad cruise. For oxygen isotopic (δ18O) measurements, it was subsampled at 2.5-cm intervals for the Holocene and 5–10 cm intervals for the glacial period (Rashid et al. 2007). The εNd measurement was carried out in coarser resolution than the δ18O. For δ18O and 14C-accel- erator mass-spectrometer (14C-AMS) dates, samples were soaked in distilled water overnight and wet-washed using a 63-µm sieve.
5.1 RC12‑344 Stratigraphy
The δ18O analysis was carried out on ~ 4–5 Globigerinoides ruber (white) from 250 to 355 µm size fractions. We used a Thermo Finnigan MAT DeltaplusXL light stable isotope ratio mass spectrometer with a Kiel III device. The overall
Fig. 2 Source rocks with various εNd in and around the Andaman Sea and Bay of Bengal (Robinson et al. 2014; Licht et al. 2013; Tripa- thy et al. 2011; Allen et al. 2008; Chen et al. 2007). Figure has been modified after Robinson et al. (2007)
analytical reproducibility, as determined from replicate measurements on the carbonate standard NBS-19, is rou- tinely better than ± 0.04‰ (± 1σ) and ± 0.08‰ (± 1σ) for δ13C and δ18O (Rashid et al. 2007), respectively. Nine 14C- AMS dates (Table 2) were used to construct the age model, resulting in sedimentation rates of ~ 19 cm/ka and ~ 10 cm/
ka during the last glacial and Holocene periods (Fig. 3), respectively. The 14C-AMS dates were calibrated to calen- dar years before present (1950) using the CALIB 7.1 and the MARINE13.14C data sets (Stuiver et al. 2019) employing 400 years and 11 ± 35 years (Dutta et al. 2001) reservoir and local reservoir (∆R) ages, respectively.
5.2 Analytical Protocol for Seawater Neodymium Several methods are currently used to extract seawater εNd from marine sediments. Sequential acid-reductive leaching (e.g., Bayon et al. 2002; Blaser et al. 2016; Gutjahr et al.
2007; Martin et al. 2010) is a common method. To test the robustness of their new technique, Gourlan et al. (2008, 2010) compared the εNd obtained by their method, which uses a weak acetic acid (CH3COOH) to extract past seawater signal, and the most common hydroxylamine hydrochloride leaching used to extract the seawater εNd signal. Gourlan et al. (2010) analyzed 11 marine sediments from different Ocean Drilling Program sites with different ages and CaCO3 concentrations and obtained a good 1:1 correlation, which validates their analytical technique. The results are also in agreement with the study of Martin et al. (2010) showing that acetic leach generally matches with the values obtained by fossil fish teeth and Fe–Mn oxides (both considered to preserve a bottom water Nd signature). Moreover, Gour- lan et al. (2010) showed that the Nd (and other rare earth elements, REEs) are mainly associated with the Mn-oxide phase in the sediments and that weak CH3COOH used in
their method very efficiently dissolves the Mn-oxides.
Gourlan et al. (2010) also calculated the Al/Mn and Al/
Nd of the leachate and bulk sediments and showed that the CH3COOH (1 N) leach preferentially and very efficiently dissolves Nd and not the silicates. It is important to note that consideration must be given to the possible contamina- tion of the εNd seawater signal by silicates. Several studies show that archives used to extract seawater composition could suffer from contamination by continental material at varying degrees when samples are deposited proximal to or on the continental margin. For example, Huck et al. (2016) tested the robustness of fossil fish teeth deposited proximal to the continental margin for seawater εNd reconstructions.
The authors analyzed the εNd composition of cleaned and uncleaned fish teeth from a middle Eocene section deposited proximal to the east Antarctic margin and showed that both methods gave a similar εNd value, corresponding to mixing between modern seawater and local sediments. Huck et al.
(2016) concluded that the fish teeth could be influenced by sedimentary fluxes on shallow marine environments. Moreo- ver, Olivier and Boyet (2006), combining the analyses of REE characteristics and εNd composition of Jurassic micro- bialites, show a strong correlation between Ce/Ce* and εNd values. The authors interpreted the εNd as contamination of relatively pure carbonate (corresponding to seawater signa- ture) by detrital material (named shale signature).
Wilson et al. (2013) also showed that sequential acid- reductive leaching might dissolve the detrital material con- taminating the leachate and suggested using the method outlined by Gourlan et al. (2008, 2010), who used acetic acid (CH3COOH) leaching on non-decarbonated sediments for extracting an authigenic εNd signal.
In this study, we used a simple and quick protocol described by Gourlan et al. (2008, 2010) to measure sea- water εNd, which consists of treatment of 300–400 mg of
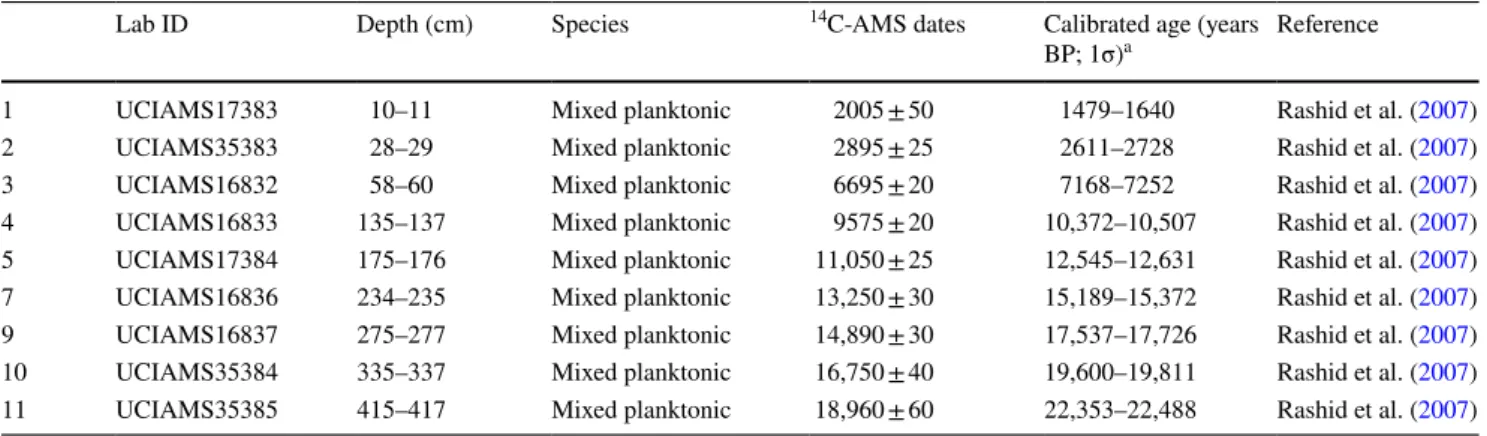
Table 2 14C-AMS dates of the Andaman Sea sediment core RC12-344
a All 14C-accelerator mass-spectrometer (14C-AMS) dates were determined on the mixed planktonic foraminifers. The 14C-AMS dates were obtained at the Keck Carbon Cycle laboratory of the University of California, Irvine. 14C-AMS dates were converted to calendar years before present (1950) using the calibration program (CALIB 7.1) of Stuiver et al. (2019) utilizing the MARINE13.14C dataset. We employed a local reservoir (∆R) correction of 11 ± 35 years following Dutta et al. (2001)
Lab ID Depth (cm) Species 14C-AMS dates Calibrated age (years
BP; 1σ)a Reference
1 UCIAMS17383 10–11 Mixed planktonic 2005 ± 50 1479–1640 Rashid et al. (2007)
2 UCIAMS35383 28–29 Mixed planktonic 2895 ± 25 2611–2728 Rashid et al. (2007)
3 UCIAMS16832 58–60 Mixed planktonic 6695 ± 20 7168–7252 Rashid et al. (2007)
4 UCIAMS16833 135–137 Mixed planktonic 9575 ± 20 10,372–10,507 Rashid et al. (2007)
5 UCIAMS17384 175–176 Mixed planktonic 11,050 ± 25 12,545–12,631 Rashid et al. (2007)
7 UCIAMS16836 234–235 Mixed planktonic 13,250 ± 30 15,189–15,372 Rashid et al. (2007)
9 UCIAMS16837 275–277 Mixed planktonic 14,890 ± 30 17,537–17,726 Rashid et al. (2007)
10 UCIAMS35384 335–337 Mixed planktonic 16,750 ± 40 19,600–19,811 Rashid et al. (2007)
11 UCIAMS35385 415–417 Mixed planktonic 18,960 ± 60 22,353–22,488 Rashid et al. (2007)
pulverized sediments by CH3COOH (1 N) in excess. This leaching allows total dissolution of the carbonate fraction and most of the Mn-oxides around microfossils in which the seawater εNd is trapped (Gourlan et al. 2008). The superna- tant fluid, carrying the seawater signal, was collected and evaporated. Nd was separated from the leachate in two steps.
The REEs were separated on a Bio-Rad column (AG 50W- X8 cationic resin). The Nd was then isolated from the other REEs on an REE-specific resin (Eichrom® Ln-Spec) using 0.180 M HCl acid. The εNd were measured on a Nu Plasma MC-ICP-MS in the ENS-Lyon laboratory and corrected for mass fractionation to 146Nd/144Nd = 0.7219. The Rennes Nd standard was run regularly and provided a 143Nd/144Nd of 0.511964 ± 0.000019 (2σ standard deviation, n = 34).
A bracketing method was applied to correct εNd for bias using the Rennes Nd standard value (Chauvel and Blichert- Toft 2001). Total procedural blank was below 80 pg of Nd (n = 5). The εNd data are given in the supporting information (Table S1).
6 Results
To avoid repetition, the G. ruber δ18O were not detailed here, as most of these data were described in Rashid et al. (2007).
However, briefly, δ18O range from −1.5 to −1.7‰ between 465 and 223 cm (Fig. 3). A transition from high to low δ18O is found between 230 and 220 cm. In comparison to the
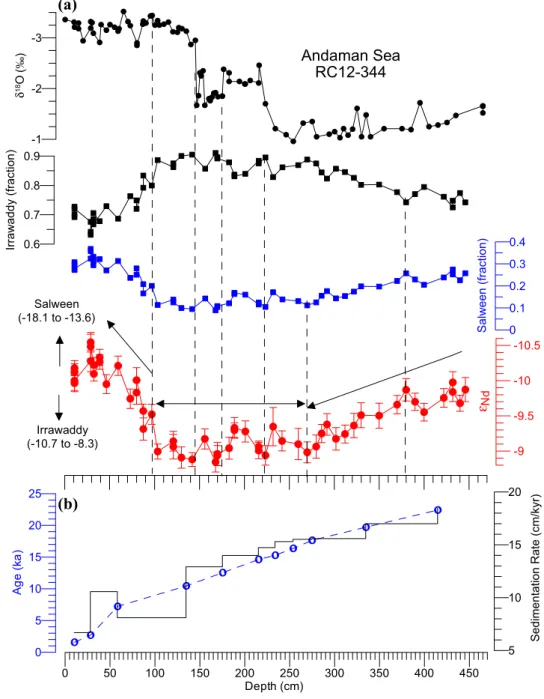
Fig. 3 a Downcore planktonic Globigerinoides ruber (white) δ18O, estimate of the Irrawaddy and Salween river contribu- tions to seawater εNd budget and seawater εNd (and maximum error bars) from Andaman Sea core RC12-344; b sedimenta- tion rates (cm/ka) derived by extrapolating 14C-AMS dates (Table 2), which are calibrated to calendar years using the CALIB program employing 400 years and 11 ± 35 years reservoir and local reservoir (∆R) ages, respectively, are plotted. Note that the vertical discontinuous lines in (a) guide the abrupt climate transitions.
Seawater εNd data are given in Table S1
0 50 100 150 200 250 300 350 400 450
Depth (cm)
-9 -9.5 -10 -10.5
εNd -1
-2 -3
δ18O (‰)
0 5 10 15 20 25
Age (ka)
0.6 0.7 0.8 0.9
Irrawaddy (fraction)
0 0.1 0.2 0.3 0.4
Salween (fraction)
5 10 15 20
Sedimentation Rate (cm/kyr)
Andaman Sea RC12-344 (a)
(b)
Irrawaddy (-10.7 to -8.3)
Salween (-18.1 to -13.6)
interval between 465 and 223 cm, low δ18O are observed between 216 and 175 cm. The interval between 175 and 156 cm shows δ18O that are relatively low compared to the interval between 465 and 223 cm but higher than those of the δ18O between 220 and 175 cm. The interval between 145 and 0 cm shows an average of −3.2‰, with no major fluctuations.
In contrast to the δ18O, seawater εNd data show an inter- esting structure (Fig. 3). The εNd data can be partitioned into four trends: (1) a gradual change from less (~ −10) to more (~ −9) radiogenic between 445.5 and 269.5 cm, (2) a stable interval from 269.5 to 96.5 cm in which εNd are relatively
stable with occasional minor fluctuation, (3) a gradual change from −9.5 to −9.7 between 96.5 and 72.5 cm, and (4) a stable value of ~ −10.2 between 72.5 and 10.5 cm (Fig. 3).
7 Discussion
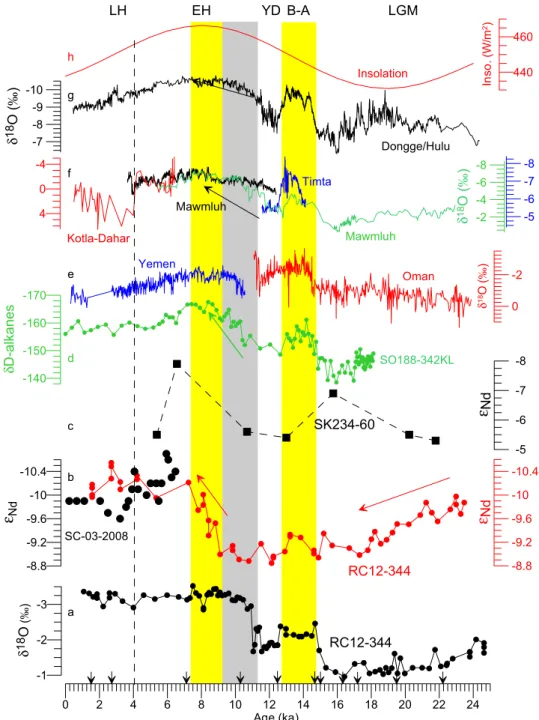
7.1 The Andaman Sea LGM and Deglacial Climate To place our Andaman Sea εNd data into broader Indo-Asian monsoon context, we plotted the available high-resolution terrestrial ISM proxy records in Fig. 4. A few available εNd
Fig. 4 A few selected Indo- Asian monsoon paleo-proxy records are plotted according to their independent age models.
a G. ruber δ18O and b seawater εNd (red circles, this study) from the Andaman Sea core RC12- 344 and εNd (black circles) from the western Andaman Sea core SC-03-2008 (Achyu- than et al. 2014); and c central Andaman Sea core SK234-60 (Awasthi et al. 2014) εNd record;
d δd-alkanes of northern Bay of Bengal core SO188-342KL (Contreras-Rosales et al. 2014);
speleothems δ18O of (e) Oman (red) (Shakun et al. 2007) and Yemen (blue) (Fleitmann et al.
2007) of western Arabian Sea;
speleothems δ18O of (f) Timta (blue) (Sinha et al. 2005) and Mawmluh (black; Berkelham- mer et al. 2012; and green;
Dutt et al. 2015) and δ18O of gastropod aragonite (red) of paleolake Kotla–Dahar from India (Dixit et al. 2014); g Dongge/Hulu speleothems δ18O (Dykoski et al. 2005; Wang et al. 2001); and h solar insola- tion (August) at 20°N latitude (Laskar et al. 2004). Downward arrows are the 14C-AMS dates used to construct the age model of RC12-344. EH and LH Early and Late Holocene, YD Younger Dryas, B/A Bølling–Allerød, LGM Last Glacial Maximum
0 2 4 6 8 10 12 14 16 18 20 22 24
Age (ka)
-8.8 -9.2 -9.6 -10 -10.4
εNd
-1 -2 -3 δ18O (‰)
-5 -6 -7 -8
εNd -140
-150 -160 -170
δD-alkanes
-8.8 -9.2 -9.6 -10 -10.4
εNd
0 -2 δ18O (‰)
-5 -6 -7 -8 -7
-8 -9 -10 δ18O (‰)
4 0 -4
440 460 Inso. (W/m2)
-2 -4 -6 -8
δ18O (‰) B-A
YD
a b c d e f g h
M G L H
E H
L
RC12-344 RC12-344 SK234-60
SO188-342KL Yemen Oman
Kotla-Dahar
Mawmluh
Mawmluh Timta
Dongge/Hulu Insolation
SC-03-2008
data from the Andaman Sea and Bay of Bengal are also plotted (Achyuthan et al. 2014; Awasthi et al. 2014). Over a general increasing εNd trend from −10.1 to −9, a few millen- nial- to centennial-scale less radiogenic εNd events between 22.2 and 16.2 ka in the RC12-344 have equivalent low δ18O events in the Dongge and Mawmluh speleothems (Fig. 4f, g). These synchronous events reflect changes in the inten- sity of the ISM. Further, the δd-alkanes between 18.2 and 17 ka (Fig. 4d) are also low, consistent with the low δ18O of Dongge and Mawmluh and an equivalent εNd event of a slight increase at RC12-344, also suggesting a reduced ISS outflow. Between 17.2 and 8.8 ka, the seawater εNd are rela- tively stable (Fig. 4b), with a minor rise in less radiogenic values in the warm Bølling–Allerød period.
The warm B/A and cold YD periods are clearly identified in the RC12-344 δ18O (Fig. 4a), consistent with the Indian and Chinese speleothems δ18O (Fig. 4e–g) and δd-alkanes of Bay of Bengal core SO188-342KL (Fig. 4d). In contrast to the speleothems δ18O, the Andaman Sea εNd are less radiogenic during the B/A, indicating increased discharge from the ISS rivers. Such fluctuation in εNd is insignificant given that the other ISM paleo-proxy records (Fig. 4) show dramatic changes. For example, the foraminifera and speleo- thems δ18O and δd-alkanes show clear and sharp changes in B/A and YD suggesting strong/wet and weak/dry Indo-Asian monsoons (Rashid et al. 2011; Dutt et al. 2015), respectively.
7.2 Andaman Sea Holocene Climate 7.2.1 Early to Mid‑Holocene
Between 9.1 and 7.2 ka, a rapid change from more to less radiogenic εNd is identified. This transition during the early Holocene is in sharp contrast to the abrupt change in which the transition from high to low δ18O in foraminifera occurred at 11 ka (Fig. 4a). It may suggest a lag between the terrestrial erosion and εNd signature at RC12-344. Further, the regional changes of the ISM recorded in the δd-alkanes, Mawmluh δ18O, and seawater εNd show heterogeneous strength of the ISM. The rapid transition from high to low δd-alkanes occurred between 10.9 and 9.2 ka (Fig. 4d), representing changes from less to more rainfall, and hence a weak and dry to strong and wet ISM (Contreras-Rosales et al. 2014).
The lowest δd-alkanes were found between 9.2 and 7.2 ka, suggesting the highest runoff associated with the strongest and wettest ISM. This is also in agreement with the work by Joussain et al. (2017) on sediments from the active channel- level systems of the northern Bengal fan, which suggest that this period corresponds to the maximum ISM rainfall, with an increase in detrital material. The Mawmluh δ18O show two-step ISM intensification: (1) between 11.2 and 9.2 ka, δ18O ranging from −6.1 to −5.8‰, which suggests a gradual intensification from weak and dry to strong and wet ISM;
and (2) the lowest δ18O between 9.2 and 7.3 ka, indicating the strongest and wettest ISM (Berkelhammer et al. 2012).
In summary, the Andaman Sea εNd trend during the early Holocene is not a stand-alone feature of the ISM, but con- firms a similar regional trend found in the highly resolved Mawmluh δ18O of NE India and the δd-alkanes from the Bay of Bengal.
7.2.2 Mid‑ to Late Holocene
An interpolated age of 1.5 ka corresponds to εNd of −10.1 at 10.5 cm sub-bottom depth of RC12-344, which is closer to the modern Andaman Sea seawater εNd at PA-S- 10 (Amakawa et al. 2000). No major fluctuation in εNd is observed between 7.2 and 1.5 ka (Fig. 4b). However, higher- resolution εNd data for the past 6.5 ka (Fig. 4b) show fluctua- tions on the western Andaman Sea (Achyuthan et al. 2014).
The variations observed in εNd were explained by the mixing between (1) a less radiogenic end-member corresponding to greater input of solutes from the Indian subcontinent, and hence higher rainfall, and (2) a more radiogenic end- member which corresponds to lower rainfall on the conti- nent and greater input of solute from the island-arc rocks in the western Andaman Islands. In comparison to the εNd of Achyuthan et al. (2014), the paleolake Kotla Dahar gas- tropod aragonite (Fig. 4f) shows a change from low to high δ18O (Dixit et al. 2014). These progressively higher δ18O were explained by less rainfall and hence a weaker ISM, consistent with the earlier findings (Rashid et al. 2011; Clift et al. 2012) and recent studies in the Bengal fan (Joussain et al. 2017; Hein et al. 2017). The εNd range from −9.6 to
−10.7 at SC-03-2008 cannot be compared to the RC12-344 εNd due to the coarse resolution for the past 6.5 ka. Further, the site SC-03-2008 is located close to the Andaman Islands, which may have received sediments of andesitic and dacitic volcanic rocks from northern Andaman and Landfall Islands.
Those igneous rocks have more radiogenic εNd than those of the ISS catchments (Ray et al. 2011).
7.3 New Andaman Sea Record and Regional Monsoonal Climate
Potential sources (Table 1) for the Andaman Sea εNd are briefly outlined above. Divergent εNd enters into the Anda- man Sea at different points due to the diversity of basement rocks (Robinson et al. 2014) as well as changes in relative proportions through time. Moreover, the average εNd of the Indian Ocean seawater is −8 ± 2.5 (Piepgras et al. 1979;
Singh et al. 2012; Cogez et al. 2013), which is the result of mixing by (1) Atlantic waters inputs (−9.2 ± 1.5; Jeandel 1993), (2) Indonesian throughflow (−4 ± 1; Amakawa et al.
2000), and (3) Himalayan river discharge (−14 ± 3; Gold- stein and Jacobsen 1987; Yu et al. 2017). The contribution
from the northern Indian Ocean water masses to the Anda- man Sea is negligible (Amakawa et al. 2000; Singh et al.
2012). The strong heterogeneities in εNd (close to the con- tinental margins; Rempfer et al. 2012) are observed locally due to the short residence time of Nd compared to the mixing time of oceans (Frank 2002). Therefore, we pro- pose that any change in the εNd at RC12-344 lies mostly within the variable contributions by the ISS rivers, with a minor contribution from the northern Indian Ocean water masses (Amakawa et al. 2000; Singh et al. 2012). Further, we hypothesize that the fluctuations in εNd are linked to a reduction or an increase in the discharge as a function of dilution. In this reasoning, the contribution of the ISS riv- ers increases or decreases synchronously with the discharge derived by strengthening or weakening of the ISM. In other words, discharge from every river increases or decreases in equal proportion, without recognizing the heterogeneity of the ISS catchments and their proportional contribution to the Andaman Sea εNd.
A binary mixing model between the Irrawaddy (more radiogenic end-member) and the Salween (less radiogenic end-member) rivers supports the other possibility. In this understanding, different rivers contribute in different propor- tions. We consider that the Sittoung River has a very limited impact on the ISS systems because of its low discharge and the “distance limit principle” in which only the local input controls the εNd (Cogez et al. 2013). In such a scenario, a binary mixing equation can be written as follows:
where AS is the Andaman Sea core RC12-344 εNd, IR is the Irrawaddy river, SR is the Salween river, and α is the mass fraction (unknown) from the Irrawaddy freshwater Nd, equal to the mass of Nd dissolved fraction coming from the Irrawaddy river, on the total mass of Nd in the water at RC12-344.
Modern river water εNd of the Irrawaddy and Salween is not well constrained; moreover, only the modern sediments of these rivers were analyzed. Nevertheless, Goldstein and Jacobsen (1987) showed that the dissolved Nd and detrital Nd in GB rivers are isotopically identical within ± 0.5 εNd. Therefore, in most cases, the εNd of the suspended load is a good approximation of εNd of river waters. This agrees with the work of Singh et al. (2012) and is consistent with the findings of Chapman et al. (2015), in which the authors analyzed major elements and Sr isotopes of the Irrawaddy and Salween rivers. The authors demonstrated that water chemistry reflects the bedrock geology of both rivers. Taking into account these findings, our εNd data and the range of 𝜀IR and 𝜀SR Nd
Nd values (Fig. 3), the εNd𝜀IR
Nd = −8.3 and 𝜀SR
Nd = −14.4 can reasonably be used for our model (Gourlan et al. 2010).
Consequently, we estimated the contribution of both end- members to the Andaman Sea for the changes in εNd in four 𝜀AS
Nd = 𝜀IRNd𝛼+ 𝜀SRNd(1− 𝛼),
steps: (1) during the gradual change from less to more radio- genic εNd between 24.6 and 17.2 ka, the contribution from the Irrawaddy river increased from ≈ 73% to 89% and the contribution from the Salween river decreased from ≈ 27%
to 11%; (2) the contributions from both the Irrawaddy and Salween rivers remained stable (87–13% each) through the relatively stable interval between 17.2 and 8.8 ka; (3) the contribution from the Irrawaddy and Salween rivers decreased and increased, respectively, in the period between 8.8 and 6 ka. This proportional contribution between two rivers potentially allowed a gradual change from more to less radiogenic εNd that eventually stabilized to −10.2; and finally, (4) the contribution from the Irrawaddy and Salween rivers accounted for 68% and 32%, respectively, for the late Holocene.
There are several uncertainties in estimating α due to the wide range in the εNd end-members of both rivers. Conse- quently, we estimated the error range of the mixing ratio and calculated average values for both contributions for the past 24 ka. It is important to emphasize that due to a mini- mal value of −8.9 obtained for the RC12-344 sediments, the Irrawaddy river εNd must be close to the value proposed by Allen et al. (2008). So, taking into account the higher and lower isotopic values of the Irrawaddy river, we esti- mated (1) an increase in the contribution by the Irrawaddy from ≈ 76 ± 7% to 90 ± 7% and a decrease from ≈ 24 ± 7%
to 10 ± 3% by the Salween before 17.2 ka; (2) then contri- butions remained ≈ 89 ± 2% for the Irrawaddy and 12 ± 4%
for the Salween during the stable interval between 17.2 and 8.8 ka; (3) the estimation remained the same from 8.8 to 6 ka; and (4) the Irrawaddy and Salween river contributions were estimated to be ≈ 72 ± 8% and 28 ± 8%, respectively, for the recent period. In any event, the Irrawaddy river plays a major role in this binary mixing model.
Moreover, the parameter considered to change the εNd at site RC12-344 is the variation in the mass of freshwater coming from each end-member. Obviously, the Nd concen- trations of each river have an impact on the εNd. Neverthe- less, it is extremely difficult (to date impossible) to recon- struct the past Nd concentrations. Gaillardet and Dupré (2014) analyzed and compiled trace elemental abundances in the dissolved load of many rivers worldwide and showed spatial variability between 2 and 500 ng/L in Nd dissolved concentrations in rivers. In general, the dissolved Nd con- centration in Himalayan rivers is estimated using tributaries collected in a unique period, such as for G–B dissolved Nd input into the Bay of Bengal, where the Yamuna river col- lected in the Southwest monsoon (SWM) period is used as representative of the whole Ganges river (Yu et al. 2017).
The only available value from the Indus river is 0.003 ng/L (Gaillardet and Dupré 2014). Chapman et al. (2015) recently published data for the Irrawaddy and Salween rivers. Unfor- tunately, no Nd data were obtained; only major elements
and Sr isotopic ratios were determined. To summarize, the concentrations of the REEs of the Himalayan rivers are not well documented. The main reason is their low abundance, which implies that a change in the concentrations will have a negligible impact on the mixing model. For these reasons, we favor the mixing model involving constant concentrations for each river through time.
There is evidence to support our new εNd estimate.
For example, our findings are in agreement with those of Awasthi et al. (2014), in which a three-component mix- ing model was proposed. In that model, contributions of the Irrawaddy, Salween–Sittoung and Ganga–Brahmaputra (SS–GB), and Indo-Burman-Arakan and Andaman Islands are quantified for the late Holocene. Further, Awasthi et al.
(2014) proposed a ternary mixing grid by plotting εNd ver- sus 87Sr/86Sr to delineate the contributions of the Indo–Bur- man–Arakan–Andaman, Irrawaddy, and SS–GB rivers at SK234-60 (Fig. 1). The more radiogenic εNd at site SK234- 60 are most likely derived from the igneous and volcanic rocks of the Andaman Islands, which are plentiful on the western Andaman Sea. It should be noted that the εNd and
87Sr/86Sr data used in the plot were determined in the sili- cate fraction. In any event, our mixing model, and follow- ing Awasthi et al. (2014), suggests that the first two sources were the main detrital sediment suppliers at RC12-344, with a contribution of 80–50% for Irrawaddy, and the SS–GB accounting for 20–35%. Colin et al. (1999) obtained two εNd data (i.e., 2 ka; −11.3 and 19.2 ka; −11.5) from core RC12-344 in the silicate fraction. Those εNd diverge from our RC12-344 εNd data by more than one epsilon unit, which is expected given that the extraction of εNd was carried out in two different phases. In fact, a possible offset between the Nd particulate (detrital material) and the Nd dissolved (seawater) fractions was observed and explained in several studies (e.g., Goldstein and Jacobsen 1987; Rousseau et al.
2015; Jeandel and Oelkers 2015).
It is well known that the detrital fraction enables identifi- cation of the sources, while the dissolved fraction reflects the intensity of continental weathering, sources, and changes in paleocirculation (Frank 2002). Consequently, it is expected that the detrital and dissolved fractions can have different Nd isotopic values. Moreover, several studies reported εNd differences between the two fractions. For example, Gold- stein and Jacobson (1987) suggested a difference of some εNd units between the εNd suspended and dissolved river loads. Jeandel and Oelkers (2015) recently demonstrated that an important dissolution of the particulate fraction occurs in seawater after its arrival in the ocean (desorption and exchange processes also occurred). Rousseau et al. (2015) analyzed the dissolved, particulate, and colloidal εNd values of the Amazon estuary and showed an offset between par- ticulate and dissolved εNd values. These authors also sug- gested that the dissolved Nd is a mixture of the dissolved
Nd from the suspended particulate matter, the remaining river fraction, and the ocean seawater end-member. This showed that the dissolved Nd fractions could be modified by the release of Nd from the suspended particulate matter (a process which increases with the salinity) and its removal by colloid coagulation. These processes are controlled by several parameters, including the mineralogy of suspended particulate matter, pH, and dissolved organic carbon, and could modify the εNd values of the dissolved fraction and also explain in part εNd differences observed between the detrital and dissolved fractions in marine sediments. Finally, smaller quantities of particulates are transported far from their sources into the oceans (Milliman and Farnsworth 2011). This transport over long distances may also affect the detrital εNd values and emphasize the offset between detrital and dissolved εNd values.
Our findings are consistent with the theory proposed by Colin et al. (1999) that the Irrawaddy river was the main contributor of detrital sediment to the northeastern Anda- man Sea. It is possible that variations in εNd might be due to internal changes in the end-member composition, which cannot be ruled out entirely. However, it would be surpris- ing that internal change would occur without having any driver, i.e., changes in the intensity of terrestrial erosion.
More erosion will not necessarily add more Nd. Neverthe- less, the fluctuations in contributions by the ISS rivers corre- late well with the other ISM paleo-proxy records. Therefore, we favor the proposal that the Irrawaddy river remained the main contributor of seawater εNd for the past 24 ka and the εNd signature of Andaman Sea results from a mixture of Nd derived from the ISS rivers.
The latest (Dutt et al. 2015) and earlier (Berkelham- mer et al. 2012) Mawmluh caves δ18O data in conjunc- tion with the Timta (Sinha et al. 2005), Dandak and Gupt- eswar (Yadava and Ramesh 2005), and Baratang (Laskar et al. 2013) caves δ18O records provide the past 36 ka ISM records for the first time from the Indian subcontinent. The glacial ISM records (Fig. 4a) tightly correlate with those of the Chinese speleothems and Greenland ice cores, which is explained by the ITCZ and sea-ice coupling in the north Atlantic (Battisti et al. 2014). However, this coupling between the polar climate and Indo-Asian monsoon breaks down for the Holocene as the Tibetan Plateau ice-cores (Rashid et al. 2011, 2013) as well as the data presented here. The Holocene records from Oman (Fleitmann et al.
2003) and Yemen (Shakun et al. 2007) show some degree of similarity with the Mawmluh speleothems (Berkelham- mer et al. 2012). The major transition from the deglacial to B/A at 14.6 ka in Yemeni speleothems is abrupt but the transition from the B/A to YD is gradual, not the abrupt change observed in the new Mawmluh cave and other paleo- proxy records (Fig. 4). However, the new Andaman Sea εNd and Mawmluh δ18O show a strong correlation that suggests
similar changes recorded in both proxies. The discrepancies between the Arabian Sea/Chinese speleothems and Indian subcontinent paleo-monsoon proxies may be due to the loca- tion of the records, in that the former records are located on the fringe of the ISM, whereas the latter records are located directly in the monsoon domain (Berkelhammer et al. 2012).
Therefore, the Arabian Sea/Chinese paleo-monsoon proxies lacked the ISM sensitivity of northeastern India, especially for the Holocene. Taken together with the Mawmluh cave δ18O and our new εNd data, this suggests a consistent vari- ability in the ISM strength for the past 24 ka.
8 Summary and Conclusions
Seawater εNd for the past 24 ka were determined from the Andaman Sea sediment core RC12-344. The new εNd data were used as a proxy to assess the strength of the past ISM and discharge by the Irrawaddy–Salween and Sittoung riv- ers. The Andaman Sea εNd trend agrees with the other past- ISM proxy records, namely speleothems, and marine and lake sediments, and suggests coherent changes in peninsu- lar India. New data show four trends: (1) a gradual change from less to more radiogenic εNd between 24 and 17.2 ka, (2) a stable interval from 17.2 to 8.8 ka in which the εNd is relatively stable with occasional minor fluctuations, (3) a gradual change from more to less radiogenic εNd between 9 and 7 ka, and (4) a stable, less radiogenic εNd since 7 ka.
As the river discharge is closely linked to the ISM, we pro- pose a binary mixing model involving the Irrawaddy and Salween–Sittoung outflow to determine the evolution of the Andaman Sea seawater εNd. We hypothesize that the Irrawaddy river remained the main contributor of seawater εNd for the past 24 ka. However, our hypothesis can be fur- ther tested by acquiring additional background geochemical data for Myanmar rivers.
Acknowledgements HR wishes to acknowledge support from the Research and Development Corporation (RDC) of the province of Newfoundland and Labrador and the Atlantic Canada Opportunities Agency (ACOA). M.-J. Zhu, J.-L. Xing, M. Vermooten, and M.-Q.
Dong are thanked for their help in processing sediment samples. The Lamont-Doherty Earth Observatory of Columbia University, Palisades, NY is acknowledged for providing samples for the study. This study also benefited from financial support from Joseph Fourier University and the INSU program “SYSTER”. Julian Dust and other anonymous reviewers are thanked for their constructive and useful comments to further refine the initial version of our manuscript.
Open Access This article is distributed under the terms of the Crea- tive Commons Attribution 4.0 International License (http://creat iveco mmons .org/licen ses/by/4.0/), which permits unrestricted use, distribu- tion, and reproduction in any medium, provided you give appropriate credit to the original author(s) and the source, provide a link to the Creative Commons license, and indicate if changes were made.
References
Achyuthan H, Nagasundaram M, Gourlan AT, Eastoe C, Ahmad SM, Padmakumari VM (2014) Mid-Holocene Indian summer monsoon variability off the Andaman Islands, Bay of Bengal. Quat Intern 349:232–244
Ahmad SM, Anil Babu G, Padmakumari VM, Dayal AM, Sukhija BS, Nagabhushanam P (2005) Sr, Nd isotopic evidence of ter- rigenous flux variations in the Bay of Bengal: implications of monsoons during the last ~ 34,000 years. Geophys Res Lett 32:1–4
Ali S, Hathorne EC, Frank M, Gebregiorgis D, Stattegger K, Stumpf R, Kutterolf S, Johnson JE, Giosan L (2015) South Asian monsoon history over the past 60 kyr recorded by radiogenic isotopes and clay mineral assemblages in the Andaman Sea. Geochem Geophys Geosys. https ://doi.org/10.1002/2014g c0055 86
Allen R, Najman Y, Carter A, Barfod D, Bickle MJ, Chapman HJ, Garzanti E, Vezzoli G, Ando S, Parrish RR (2008) Provenance of the Tertiary sedimentary rocks of the Indo-Burman ranges, Burma (Myanmar): Burman arc or Himalayan derived? J Geol Soc 165:1045–1057
Amakawa H, Nozaki Y (1998) Nd isotopic variations of surface sea- waters from the eastern Indian Ocean and its adjacent oceanic regions. Min Mag 62A:47–48
Amakawa H, Alibo DS, Nozaki Y (2000) Nd isotopic composition and REE pattern in the surface waters of the eastern Indian Ocean and its adjacent seas. Geochim Cosmochim Acta 64:1715–1727 Awasthi N, Ray JS, Singh AK, Band ST, Rai V (2014) Provenance of
the late Quaternary sediments in the Andaman Sea: implications for monsoon variability and ocean circulation. Geochem Geophys Geosys 15:3890–3906
Barnett TP, Dumenil L, Schlese U, Roeckner E (1988) The effect of Eurasian snow cover on global climate. Science 239:504–507 Battisti DS, Ding Q, Roe GH (2014) Coherent pan-Asian climatic and
isotopic response to orbital forcing of tropical insolation. J Geo- phy Res 119:11997–12020
Bayon G, German CR, Boella RM, Milton JA, Taylor RN, Nesbitt RW (2002) Sr and Nd isotope analyses in paleoceanography: the sepa- ration of both detrital and Fe–Mn fractions from marine sediments by sequential leaching. Chem Geol 187:179–199
Bender F (1983) Geology of Burma. Gebrüder Borntraeger, Berlin Berkelhammer M, Sinha A, Stott LD, Cheng H, Pausata FSR,
Yoshimura K (2012) An abrupt shift in the Indian monsoon 4000 years ago. In: Giosan L, Fuller DQ, Nicoll K, Flad RK, Clift PD (eds) Climates, landscapes, and civilizations. Geophysi- cal Monograph series 198. American Geophysical Union, Wash- ington, DC, pp 75–87
Blaser P, Lippold J, Gutjahr M, Frank N, Link JM, Frank M (2016) Extracting foraminiferal seawater Nd isotope signatures from bulk deep-sea sediment by chemical leaching. Chem Geol 439:189–204 Borg LE, Banner JL (1996) Neodymium and strontium isotopic con- straints on soil sources in Barbados, West Indies. Geochim Cos- mochim Acta 60:4193–4206
Braun J, Voisin C, Gourlan AT, Chauvel C (2015) Erosional response of an actively uplifting mountain belt to cyclic rainfall variations.
Earth Surf Dynam 3:1–14
Buffle J, Van Leeuwen HP (1992) Environmental particles: 1. In: envi- ronmental analytical and physical chemistry series. Lewis Pub- lishers, London
Burton KW, Vance D (2000) Glacial-interglacial variations in the neodymium isotope composition of seawater in the Bay of Ben- gal recorded by planktonic foraminifera. Earth Planet Sci Lett 176:425–441
Cane M (2010) Climate: a moist model monsoon. Nature 463:163–164
Chapman H, Bickle M, Thaw SH, Thiam HN (2015) Chemical fluxes from time series sampling of the Irrawaddy and Salween rivers, Myanmar. Chem Geol 401:15–27
Chauvel C, Blichert-Toft J (2001) A hafnium isotope and trace element perspective on melting of the depleted mantle. Earth Planet Sci Lett 190:137–151
Chen F, Li XH, Wang XL, Li QL, Siebel W (2007) Zircon age and Nd–
Hf isotopic composition of the Yunnan Tethyan belt, southwestern China. Int J Earth Sci 96:1179–1194
Clift PD, Carter A, Giosan L, Durcan J, Duller GAT, Macklin MG, Alizai A, Tabrez AR, Danish M, Laningham SV, Fuller DQ (2012) U-Pb zircon dating evidence for a Pleistocene Sarasvati River and capture of the Yamuna River. Geology 40:211–214 Cogez A, Allègre CJ, Meynadier L, Lewin E (2013) A statistical
approach to the Nd isotopes distributions in the oceans. Mineral Mag. https ://doi.org/10.1180/minma g.2013.077.5.3
Colin C, Turpin L, Bertauz J, Despraries A, Kissel C (1999) Ero- sional history of the Himalayas and Burman ranges during the last two glacial–interglacial cycles. Earth Planet Sci Lett 171:647–660
Contreras-Rosales LA, Jennerjahn T, Tharammal T, Meyer V, Lückge A, Paul A, Schefuß E (2014) Evolution of the Indian summer monsoon and terrestrial vegetation in the Bengal region during the past 18 ka. Quat Sci Rev 102:133–148
Dixit Y, Hodell DA, Petrie CA (2014) Abrupt weakening of the sum- mer monsoon in northwest India ~ 4100 years ago. Geology 42:339–342
Dutt S, Gupta AK, Clemens SC, Cheng H, Singh RK, Kathayat G, Edwards RL (2015) Abrupt changes in Indian summer monsoon strength during 33,800 to 5500 years BP. Geophys Res Lett. https ://doi.org/10.1002/2015g l0640 15
Dutta K, Bhushan R, Somayajulu BLK (2001) ∆R Correction values for the northern Indian Ocean. Radiocarbon 43:483–488 Dykoski CA, Edwards RL, Cheng H, Yuan D, Cai Y, Zhang M, Lin Y,
Qing J, An ZS, Revenaugh J (2005) A high-resolution, absolute- dated Holocene and deglacial Asian monsoon record from Dongge Cave, China. Earth Planet Sci Lett 233:71–86
Fleitmann D, Burns SJ, Mudelsee M, Neff U, Kramers J, Mangini A, Matter A (2003) Holocene forcing of the Indian monsoon recorded in a stalagmite from southern Oman. Science. https ://
doi.org/10.1126/scien ce.10831 30
Fleitmann D, Burns SJ, Mangini A, Mudelsee M, Kramers J, Villa I, Neff U, Al-Subbary AA, Buettner A, Hippler D, Mattera A (2007) Holocene ITCZ and Indian monsoon dynamics recorded in stalag- mites from Oman and Yemen (Socotra). Quat Sci Rev 26:170–188 Frank M (2002) Radiogenic isotopes: tracers of past ocean circulation
and erosional input. Rev Geophys. https ://doi.org/10.1029/2000r g0000 94
Gaillardet J, Viers J, Dupré B (2014) Trace elements in River Waters (Chap. 7.7). In: Turekian KK, Holland HD (eds) Treatise on geo- chemistry, 2nd edn. Elsevier, Oxford, pp 195–235
Goldstein SJ, Jacobsen SB (1987) The Nd and Sr isotopic systematics of river-water dissolved material: implications for the sources of Nd and Sr in seawater. Chem Geol 66:245–272
Gourlan AT, Meynadier L, Allegre CJ (2008) Tectonically driven changes in the Indian Ocean circulation over the last 25 Ma: neo- dymium isotope evidence. Earth Planet Sci Lett 26:353–364 Gourlan AT, Meynadier L, Allègre CJ, Tapponnier P, Birck JL, Joron
JL (2010) Northern Hemisphere climate control of the Bengali rivers discharge during the past 4 Ma. Quat Sci Rev 29:2484–2498 Gutjahr M, Frank M, Stirlinga CH, Klemm V, van de Flierdt T, Hal- liday AN (2007) Reliable extraction of a deepwater trace metal isotope signal from FeMn oxyhydroxide coatings of marine sedi- ments. Chem Geol 242:351–370
Hasan Z, Akhter S, Kabir A (2014) Analysis of rainfall trends in south- east Bangladesh. J Environ 3:51–56
Hein CJ, Galy V, Galy A, France-Lanord C, Kudrass H, Schwenk T (2017) Post-glacial climate forcing of surface processes in the Ganges–Brahmaputra river basin and implications for carbon sequestration. Earth Planet Sci Lett 478:89–101
Huck CE, van de Flierdt T, Jimenez-Espejo FJ, Bohaty SM, Röhl U, Hammond SJ (2016) Robustness of fossil fish teeth for seawater neodymium isotope reconstructions under variable redox condi- tions in an ancient shallow marine setting. Geochem Geophys Geosys. https ://doi.org/10.1002/2015g c0062 18
Jacobsen SB, Wasserburg GJ (1980) Sm–Nd isotopic evolution of chondrites. Earth Planet Sci Lett 50:139–155
Jeandel C (1993) Concentration and isotopic composition of Nd in the southern Atlantic Ocean. Earth Planet Sci Lett 117:581–591 Jeandel C, Oelkers EH (2015) The influence of terrigenous particu- late material dissolution on ocean chemistry and global element cycles. Chem Geol 395:50–66
Joussain R, Liu ZF, Colin C, Duchamp-Alphonse S, Yu ZJ, Moréno E, Fournier L, Zaragosi S, Dapoigny A, Meynadier L, Bassinot F (2017) Link between Indian monsoon rainfall and physical erosion in the Himalayan system during the Holocene. Geochem Geophys Geosyst 18:3452–3469
Laskar J, Robutel P, Joutel F, Gastineau M, Correia ACM, Levrad B (2004) A long-term numerical solution for the insolation quanti- ties of the earth. Astrono Astrophy 428:261–285
Laskar AH, Yadava MG, Ramesh R, Polyak VJ, Asmerom Y (2013) A 4 kyr stalagmite oxygen isotopic record of the past Indian summer monsoon in the Andaman Islands. Geochem Geophys Geosyst 14:3555–3566
Licht A, France-Lanord C, Reisberg L, Fontaine C, Soe AN, Jaeger JJ (2013) A palaeo Tibet–Myanmar connection? Reconstructing the Late Eocene drainage system of central Myanmar using a multi- proxy approach. J Geol Soc 170:929–939
Lupker M, France-Lanord C, Galy V, Lave J, Kudrass H (2013) Increasing chemical weathering in the Himalayan system since the Last Glacial Maximum. Earth Planet Sci Lett 365:243–252 Martin EE, Blair SW, Kamenov GD, Scher HD, Bourbon E, Basak C,
Newkirk DN (2010) Extraction of Nd isotopes from bulk deep sea sediments for paleoceanographic studies on Cenozoic time scales.
Chem Geol 269:414–431
Milliman JD, Farnsworth KL (2011) River discharge to the coastal ocean: a global synthesis. Cambridge University Press, Cambridge Milliman JS, Meade RH (1983) World-wide delivery of river sediment
to the oceans. J Geology 91:1–21
Milliman JD, Syvitski JPM (1992) Geomorphic/tectonic control of sediment discharge to the ocean: the importance of small moun- tainous rivers. J Geology 100:525–544
Miriyala P, Sukumaran NP, Nath BN, Ramamurty PB, Sijinkumar AV, Vijayagopal B, Ramaswamy V, Sebastian T (2017) Increased chemical weathering during the deglacial to mid-Holocene sum- mer monsoon intensification. Sci Rep. https ://doi.org/10.1038/
srep4 4310
Murata F, Terao T, Hayashi T, Asada H, Matsumoto J (2008) Relation- ship between the atmospheric conditions at Dhaka, Bangladesh, and rainfall at Cherrapunjee, India. Nat Hazards 44:399–410 Naqvi WA, Charles CD, Fairbanks RG (1994) Carbon and oxygen iso-
topic records of benthic foraminifera from the northeast Indian Ocean: implications on glacial-interglacial atmospheric CO2 changes. Earth Planet Sci Lett 121:99–110
Olivier N, Boyet M (2006) Rare earth and trace elements of microbial- ites in upper Jurassic coral- and sponge-microbialite reefs. Chem Geol 230:105–123
Piepgras DJ, Wasserburg GJ, Dasch EG (1979) The isotopic com- position of Nd in different ocean masses. Earth Planet Sci Lett 45:223–236
Ramaswamy V, Rao PS, Rao KH, Thwin S, Rao NS, Raiker V (2004) Tidal influence on suspended sediment distribution and dispersal