Dissertation Kiel, 2017
Georgi Laukert
Ocean circulation and shelf processes in the Arctic
Mediterranean traced by radiogenic neodymium isotopes,
rare earth elements and stable oxygen isotopes
Ocean circulation and shelf processes in the Arctic Mediterranean traced by radiogenic neodymium
isotopes, rare earth elements and stable oxygen isotopes
Dissertation zur Erlangung des Doktorgrades Dr. rer. nat.
der Mathematisch-Naturwissenschaftlichen Fakultät der Christian-Albrechts-Universität zu Kiel
vorgelegt von Georgi Laukert
Kiel, 2017
- i -
1. Gutachter und Betreuer: Prof. Dr. Martin Frank 2. Gutachter: Prof. Dr. Don Porcelli
Eingereicht am: 26. Januar 2017 Tag der Disputation: 20. Februar 2017 Zum Druck genehmigt: 20. Februar 2017
Gez. Prof. Dr. Natascha Oppelt, Dekanin
Gutachter
- ii -
Erklärung
Hiermit erkläre ich an Eides statt, dass ich die vorliegende Abhandlung, abgesehen von der Beratung durch meinen Betreuer, nach Inhalt und Form selbstständig erarbeitet habe und keine anderen, als die von mir aufgeführten Quellen und Hilfsmittel, verwendet wurden.
Diese Arbeit ist unter Einhaltung der Regeln guter wissenschaftlicher Praxis der Deutschen Forschungsgemeinschaft entstanden und wurde weder in Auszügen noch in ganzer Form an einer anderen Stelle im Rahmen eines Prüfungsverfahrens eingereicht.
Teile dieser Arbeit sind bereits in einer Fachzeitschrift veröffentlicht, wurden zur Veröffentlichung eingereicht oder sind in Vorbereitung eingereicht zu werden.
Kiel, den 26. Januar 2017
Georgi Laukert
- iii -
CONTENTS
ABSTRACT ... 1
KURZFASSUNG ... 3
1. INTRODUCTION... 6
1.1 The changing Arctic Mediterranean ... 6
1.2 Bathymetry, hydrography and ocean circulation in the Arctic Mediterranean...7
1.3 Annual hydrographic variability of the Siberian shelf seas... 10
1.4 Principles and application of neodymium isotopes as water mass tracer ... 11
1.5 Principles and application of REEs in seawater ... 14
1.6 REE sources in the Arctic Mediterranean and their εNd signatures... 17
1.7 Stable oxygen isotope systematics and source-defined components ... 21
1.8 Objectives and outline of the thesis and contributions to the chapters ... 22
2. METHODS ... 25
2.1 Sample collection and pre-concentration ... 25
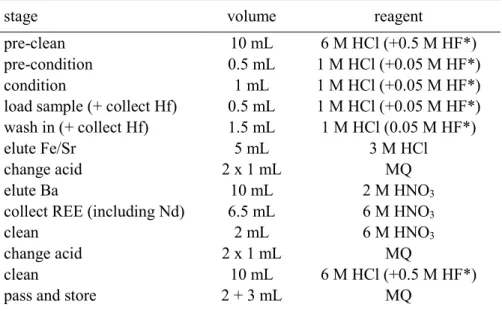
2.2 Chemical procedures including chromatographic purification ... 26
2.3 Neodymium isotope and ID concentration measurements via MC-ICP-MS ... 28
2.4 Rare earth element concentration measurements ... 28
2.5 Oxygen isotope, nutrient and sample salinity measurements ... 29
2.6 Binary and ternary mixing based on salinity, Nd isotopes and [Nd]... 29
3. PUBLICATION AND MANUSCRIPTS ... 31
CHAPTER I: Ocean circulation and freshwater pathways in the Arctic Mediterranean based on a combined Nd isotope, REE and oxygen isotope section across Fram Strait .... 31
CHAPTER II: Transport and transformation of riverine Nd isotope and rare earth element signatures in high latitude estuaries: A case study from the Laptev Sea ... 63
CHAPTER III:Propagation of Greenland freshwater in the western Fram Strait - Evidence from dissolved Nd isotopes and REEs ... 89
4. SUMMARY, CONCLUSIONS AND OUTLOOK ... 100
4.1 Summary and Conclusions ...100
4.2 Outlook ... 103
DANKSAGUNG ... 105
REFERENCES ... 106
DATA TABLES ... 127
- 1 -
ABSTRACT
The warming of the Arctic region in the recent past has proceeded at rates double that of the global average and has been accompanied by rapid sea ice retreat and increased heat and freshwater fluxes to the Arctic Mediterranean (i.e. the Arctic Ocean and the Nordic Seas, AM). Further warming will have strong impacts on ocean circulation, freshwater pathways, and marine ecosystems in the AM. Disentangling the sources, distribution and mixing of water masses involved in the transport and transfer of heat and freshwater is therefore critical for the understanding of present and future hydrological changes in the high-latitude and polar regions and their consequences. This study refines the knowledge of water mass circulation and mixing in the AM and provides new insights into the processes occurring on the Arctic shelves and in high-latitude estuaries. A multi-proxy approach is used combining dissolved radiogenic Nd isotopes (εNd), rare earth elements (REEs) and stable oxygen isotopes (δ18O) together with standard hydrographic tracers.
The sources, distribution and mixing of water masses that circulate in the AM and pass the Fram Strait are assessed through evaluation of dissolved εNd and REE, and δ18O data obtained from samples recovered in 2012 along a full water depth section extending between Svalbard and Greenland at ~79 °N, and through a compilation and reassessment of literature Nd isotope and concentration data previously reported for other sites within the AM. The Nd isotope and REE distribution in the central Fram Strait and the open AM primarily reflects the lateral advection of water masses and their mixing, whereas seawater-particle interactions exert important control only above the shelf regions. For example, on the NE Greenland Shelf, remineralization of biogenic and/or release from detrital particles is recorded in bottom waters. Advection of warm Atlantic Water (AW) in the upper water column of the eastern and central Fram Strait is clearly reflected by an εNd signature of -11.7 and a Nd concentration ([Nd]) of 16 pmol/kg.
Freshening and cooling of the AW on its way through the AM are accompanied by a continuous change towards more radiogenic Nd isotope compositions (e.g. -10.4 of dense Arctic Atlantic Water). This change results from mixing with intermediate waters but also mirrors the admixture of dense Kara Sea waters and Pacific-derived waters.
Exchange with basaltic formations of Iceland and southeastern Greenland is suggested to impart the intermediate and deep waters of the AM with more radiogenic εNd signatures, which reach -9.5 in the Fram Strait. Significant inputs of Nd from Svalbard are not observed and surface waters and Nd on the western Svalbard Shelf originate in the Barents Sea. Shallow (< 200 m) waters of Arctic origin form the core of the East Greenland Current above the Greenland slope and have relatively radiogenic εNd
(reaching -8.8) and elevated [Nd] (21-29 pmol/kg), which together with δ18O and standard hydrographic tracers are used to determine the proportions of Pacific-derived (< 30 % based on Nd isotopes) and Atlantic-derived seawater, as well as of river waters (<
8 %). A change in the Nd isotope compositions to less radiogenic values (-12.4) and an increase in [Nd] (38 pmol/kg) are observed at water depths above 100 m near the Greenland coast documenting addition of Greenland-sourced freshwater (GFW). The
- 2 -
amount of GFW contained in the upper water column on the NE Greenland Shelf reached 6 % in 2012. Data obtained for the years 2014 and 2015 for the northern and southern NE Greenland Shelf suggest similar fractions of GFW for shallow waters in the Norske Trough and east of Ob Bank, indicating southward and northward propagation of GFW along the Greenland coast assuming that the NE Greenland Ice Stream is the freshwater source. The Nd isotope compositions of Arctic-derived waters (εNd ~ -9) and other water masses were essentially constant over the time period 2012-2015, which provides a solid basis for quantitative estimates of GFW admixture. The GFW distribution suggests that future increased GFW supply forced by global warming will lead to additional freshening of shallow Arctic waters, which, once these waters have traversed the Nordic Seas, may ultimately affect overturning strength in the northern Labrador Sea. Overall, the results obtained from the Fram Strait demonstrate that the pronounced gradients in εNd and REE contents in the upper water column provide a reliable basis for assessments of short-term shallow hydrological changes within the AM.
New insights into the processes occurring in high latitude estuaries are provided by dissolved Nd isotope and REE compositions together with δ18O data for the Laptev Sea based on filtered samples collected during two summers (2013 + 2014) and one winter (2012). The Laptev Sea is a Siberian Shelf sea characterized by extensive river- runoff, sea-ice production and ice transport into the Arctic Ocean. The broad range in εNd (-6 to -17), REE concentrations (16 to 600 pmol/kg for Nd) and REE patterns found in the frame of this study is attributed to freshwater supply from the Siberian rivers and advection of open ocean Arctic Atlantic Water. Strikingly and contrary to expectations, there is no evidence for significant release of Nd from particulate phases and Nd isotopes can thus be used to assess water mass mixing together with the salinity after correction for variations in the salinity caused by sea-ice formation and melting. High fractions of riverine contributions from the Lena River (up to 75 %) are determined for the surface layer of the eastern Laptev Sea with significant interannual variations, while the less variable advection of Yenisei and Ob freshwater (up to ~20 %) is restricted to the western Laptev Sea. Essentially all Laptev shelf waters are depleted in light (L)REEs, while the distribution of the heavy (H)REEs shows a deficiency at the surface and an excess in the bottom layer. A combination of REE removal through coagulation of nanoparticles and colloids and REE redistribution within the water column through formation and melting of sea ice and river ice is suggested to account for the distribution of all REEs. Estuarine removal of riverine REEs starts at salinities close to 10 and after a drop of all REEs by about 30 % transfers into preferential LREE removal, which for Nd reaches 75 % at salinities near 34. Although the delayed onset of dissolved REE removal contrasts with observations from most other estuarine environments, the distributions coincide remarkably well with results from recent experiments simulating estuarine mixing with organic-rich river waters. The melting and formation of sea ice and river ice lead to further REE depletion at the surface and enrichments in the bottom water layer as a function of ice melting and brine transfer, respectively. The ice-related processes contribute to the redistribution of other elements and may also affect macronutrient distribution and primary productivity in high latitude estuaries.
- 3 -
KURZFASSUNG
In der jüngsten Vergangenheit erwärmte sich die arktischen Region doppelt so schnell wie der Rest der Erde, was von einem schnellen Rückgang des Meereises sowie von erhöhten Süßwasser- und Wärmeflüssen in das arktische Mittelmeer (AM) begleitet wurde (dies umfasst das Nordpolarmeer, das Europäische Nordmeer sowie die Grönlandsee und die Islandsee). Die fortschreitende Erderwärmung wird starke Auswirkungen auf die Ozeanzirkulation, die Süßwassertransportwege und die Meeresökosysteme im AM haben. Die Bestimmung der Herkunft, Verteilung und Mischung von Wassermassen, die an der Lieferung und Transformation von Wärme und Süßwasser im AM beteiligt sind, ist für das Verständnis der gegenwärtigen und zukünftigen hydrologischen Veränderungen im AM und den damit verbundenen Konsequenzen daher von entscheidender Bedeutung. Diese Studie vertieft das Wissen über die Wassermassenzirkulation und -mischung im AM und liefert neue Einblicke in Prozesse, die in den arktischen Schelfmeeren und in den Flussmündungen der hohen nördlichen Breiten ablaufen. Hierzu wurde eine kombinierte Untersuchung gelöster radiogener Neodymisotope (εNd), gelöster Seltenerdelemente (REEs), stabiler Sauerstoffisotope (δ18O) und herkömmlicher hydrographischer Tracer angewandt.
Die Herkunft, Verteilung und Mischung von Wassermassen, die Teil der Zirkulation innerhalb des AM sind und die Framstraße passieren, wird durch die Auswertung der oben genannten Parameter an Proben bestimmt, die in der gesamten Wassersäule im Jahr 2012 entlang eines 79°N-Schnittes zwischen Svalbard und Grönland entnommen wurden. Eine Zusammenstellung und Neubewertung von Literaturdaten, die Nd-Isotopensignaturen und Nd-Konzentrationen aus anderen Gebieten innerhalb des AM einschließen, wird ebenfalls herangezogen. Die Verteilung von gelösten Nd- Isotopensignaturen und REE-Konzentrationen in der zentralen Framstraße und im offenen AM spiegelt primär die laterale Advektion von Wassermassen und deren Mischung wider, wohingegen Meerwasser-Partikel-Wechselwirkungen nur auf den arktischen Schelfen eine wichtige Rolle spielen. So ist auf dem nordöstlichen (NE) Grönland-Schelf die Freisetzung von Nd durch Remineralisation von biogenen und/oder Auflösung von detritischen Partikeln im bodennahen Bereich zu beobachten. Die Advektion des warmen atlantischen Wassers (AW) innerhalb der oberen Wassersäule der östlichen und zentralen Framstraße wird deutlich durch eine εNd-Signatur von -11.7 und eine Nd-Konzentration ([Nd]) von 16 pmol/kg angezeigt. Während der Zirkulation von AW innerhalb des AM wird dessen Abkühlung und Abnahme des Salzgehaltes durch eine kontinuierliche Veränderung hin zu radiogeneren Nd-Isotopensignaturen begleitet (beispielsweise hat dichtes Arktisches Atlantisches Wasser eine Signatur von -10.4).
Diese Veränderung resultiert einerseits aus der Mischung mit tieferen Wassermassen, aber auch aus der Beimischung von dichtem Schelfwasser aus der Karasee und Meerwasser pazifischen Ursprungs. Die radiogeneren εNd-Signaturen von Zwischen- und Tiefenwässern (bis zu -9.5) werden durch den Austausch mit basaltischen Formationen von Island und Südostgrönland erklärt. Signifikante Einträge von Nd aus Svalbard werden nicht beobachtet und Oberflächenwasser und Nd auf dem westlichen Svalbard-
- 4 -
Schelf stammen aus der Barentssee. Oberflächennahe (< 200 m) Wässer arktischen Ursprungs bilden den Kern des Ostgrönlandstroms über dem Kontinentalrand Grönlands und haben ebenfalls relativ radiogene εNd-Signaturen (bis zu -8,8) und erhöhte [Nd] (21-29 pmol/kg), die zusammen mit δ18O und herkömmlichen hydrographischen Tracern verwendet werden, um die Anteile von Wässern pazifischen (< 30 % basierend auf Nd-Isotopen) und atlantischen Ursprungs sowie von Flusswasser (< 8 %) zu bestimmen. Eine Änderung hin zu niedrigeren εNd-Werten (-12.4) und eine Zunahme von [Nd] (bis zu 38 pmol/kg) zur Grönländischen Küste hin wird in Wassertiefen bis 100 m beobachtet und dokumentiert die Zumischung von Süßwasser grönländischen Ursprungs (GFW). Die in der oberen Wassersäule auf dem NE Grönlandschelf enthaltene Menge an GFW erreichte im Jahr 2012 ca. 6 %. Die Daten für die Jahre 2014 und 2015 deuten auf ähnliche Anteile von GFW für die oberflächennahen Wasserschichten im untermeerischen Norske-Tal (südliche Teil des NE Grönlandschelfs) und östlich der Ob Bank (nördlicher Teil des NE Grönlandschelfs) hin, was die südliche und nördliche Ausbreitung von GFW entlang der Küste Grönlands dokumentiert, vorausgesetzt dass die Herkunft des GFW der NE-Grönland-Eisstrom ist. Die Nd- Isotopenzusammensetzungen von oberflächennahen Wässern arktischen Ursprungs (εNd
~ -9) und anderen Wassermassen im AM waren im Zeitraum 2012-2015 im Wesentlichen konstant, was eine solide Grundlage für die quantitative Bestimmung der GFW- Zumischung zur oberen Wassersäule darstellt. Die GFW-Verteilung legt nahe, dass der durch die globale Erderwärmung künftig erhöhte GFW-Eintrag in den Ozean zu einer zusätzlichen Aussüßung der oberflächennahen arktischen Wässer führen wird und nach ihrer Advektion in den Nordatlantik die Tiefenkonvektion im der nördlichen Labradorsee beeinflussen könnte. Die Ergebnisse aus der Framstraße zeigen insgesamt, dass die ausgeprägten Gradienten der εNd-Signaturen und REE-Konzentrationen in der oberen Wassersäule eine zuverlässige Grundlage für die Beurteilung kurzfristiger oberflächennaher hydrologischer Veränderungen innerhalb des AM liefern.
Neue Einblicke in die Prozesse, die innerhalb von Flussmündungen der hohen nördlichen Breiten vorherrschen, liefern gelöste Nd-Isotopensignaturen und REE- Zusammensetzungen sowie δ18O-Daten aus der Laptewsee, die an gefilterten Wasserproben bestimmt wurden, die während zweier arktischer Sommer (2013 + 2014) und eines Winters (2012) genommen wurden. Die Laptewsee ist eines der sibirischen Schelfmeere, das durch einen sehr hohen Flusswassereintrag, sowie durch starke Meereisproduktion und den Export von Meereis in den Arktischen Ozean gekennzeichnet ist. Die im Rahmen dieser Studie gefundenen große Variabilität in εNd- Signaturen (-6 bis -17), REE-Konzentrationen (16 bis 600 pmol/kg für Nd) und REE- Muster werden der Süßwasserzufuhr aus den verschiedenen sibirischen Flüssen sowie der Advektion von modifiziertem AW zugeschrieben. Bemerkenswerterweise, und entgegen den Erwartungen, gibt es keinen Nachweis für eine signifikante Freisetzung von Nd aus partikulärem Material und die Nd-Isotopensignaturen können somit zusammen mit dem Salzgehalt verwendet werden um die Wassermassenmischung zu bestimmen. Dieser wurde auf Änderungen korrigiert, die durch den Salztransfer während der Bildung und Schmelze des Meereises verursacht wurden. Für die
- 5 -
Oberflächenwässer der östlichen Laptewsee werden hohe Anteile von Flusswasser der Lena (bis zu 75 %) bestimmt, wobei signifikante zwischenjährliche Variationen der Flusswasser-Verteilung innerhalb der Laptewsee beobachtet wurden. Die Advektion von Süßwasser des Jenissej und Ob (bis zu 20 %) hingegen zeigt eine geringere zwischenjährliche Variabilität und deren Vorkommen beschränkt sich auf die westliche Laptewsee. Alle Schelfwässer in der Laptewsee sind generell abgereichert an leichten (L)REEs, während die Verteilung der schweren (H)REEs ein Defizit an der Oberfläche und einen Überschuss in Bodennähe zeigt. Als Erklärung für diese REE Verteilung wird eine Kombination aus zwei Prozessen vorgeschlagen: Einerseits findet eine Ausfällung gelöster REEs durch Koagulation von REE-reichen und durch Flüsse eingetragene Nanopartikel und Kolloide statt und andererseits werden die REEs innerhalb der Wassersäule durch die Bildung und das Schmelzen von Meereis und Flusseis umverteilt.
Die Ausfällung aller eingetragenen REEs innerhalb der Lenamündung um etwa 30 % beginnt bei Salzgehalten nahe 10 und wird gefolgt von einer bevorzugten LREE- Ausfällung, die für Nd mindestens 75 % beträgt und bis zu Salzgehalten von 34 anhält.
Der verzögerte Beginn der Ausfällung steht im Widerspruch zu bisherigen Beobachtungen aus anderen Flussmündungsgebieten, stimmt jedoch bemerkenswert gut überein mit neueren Experimenten, die die Mischung von Meerwasser und Flusswasser, das reich an organischen Verbindungen ist, simulieren. Das Schmelzen und die Bildung von Meereis und Flusseis führen zu einem weiteren Defizit der REEs in der oberflächennahen Wasserschicht und zu Anreicherungen in der Bodenwasserschicht als Funktion des Eisschmelzens durch Verdünnung bzw. der Eisbildung und der dadurch verursachten Laugenbildung. Die Eisprozesse haben auch Auswirkungen auf die Verteilung von anderen Metallen und von Nährsoffen, und damit auch auf die Primärproduktivität in eisbeeinflussten Regionen.
- 6 -
1. INTRODUCTION
1.1 The changing Arctic Mediterranean
The Arctic region has warmed more than twice as fast as the global average in the recent past, a robust feature known as Arctic amplification (e.g. Cohen et al., 2014; Serreze et al., 2009; Serreze and Barry, 2011). The concurrent rapid sea ice retreat is projected to result in an ice-free Arctic summer before the middle of the 21st century (e.g. Holland et al., 2006; Wang and Overland, 2009). Both warming and sea ice loss significantly contribute to an intensification of the hydrological cycle in the Arctic region, which is evidenced by increasing precipitation (Kattsov et al., 2007) and river runoff (Peterson et al., 2002) and accompanied by accelerated mass loss of the Greenland ice sheet (Bamber et al., 2012). The observed increased freshwater supply is of global significance, as it contributes to the freshening of the North Atlantic and thus may cause global climatic feedbacks through weakening of the Atlantic Meridional Overturning Circulation (e.g.
Rahmstorf et al., 2015; Yang et al., 2016).
The warming also significantly affects oceanic conditions in the Arctic Mediterranean (i.e. the Arctic Ocean and the Nordic Seas, AM). In addition to the freshening, the AM undergoes substantial warming by increasing poleward transport of oceanic heat, which is regarded to be another facet of the Arctic amplification (Spielhagen et al., 2011 and references therein). Most of the oceanic heat is supplied by advection of warm and saline waters of Atlantic origin that enter the AM across the Greenland-Scotland Ridge (e.g. Aagaard et al., 1987; Rudels et al., 2004). These waters have in recent decades exhibited unprecedented temperatures compared to the last two millennia (Spielhagen et al., 2011), with a maximum temperature so far reached in 2006 (Schauer et al., 2008). Their advection was also shown to have a significant impact on the Arctic sea-ice cover through upward heat loss (Dmitrenko et al., 2014; Polyakov et al., 2010).
Both phenomena, the freshening and the warming of the AM, cause a clearly discernable alteration of Arctic marine ecosystems (Wassmann et al., 2011 and references therein) and affect various physical and chemical processes occurring in the open AM and on the wide Arctic shelves (e.g. Bauch et al., 2010; Dmitrenko et al., 2014; Hölemann et al., 2011; Janout et al., 2016; Moore et al., 2015; Polyakov et al., 2010; Rippeth et al., 2015; Semiletov et al., 2016; Shakhova et al., 2010). The water masses involved in the transport and transfer of heat and freshwater within the AM therefore not only play a key role in regulating the heat and freshwater budget of the AM, but also significantly contribute to the alteration of the marine ecosystems and to changes of various chemical and physical processes. A detailed investigation of their sources, distribution and circulation is therefore critical for the understanding of present and potential near- future hydrological, biological and biogeochemical changes in this highly dynamic and climatically sensitive region.
- 7 -
1.2 Bathymetry, hydrography and ocean circulation in the Arctic Mediterranean
The AM is a semi-enclosed ocean that comprises the Nordic Seas (i.e. the Greenland Sea, the Iceland Sea and the Norwegian Sea, NS) and the Arctic Ocean (AO) (Rudels et al., 1999b and references therein), which are connected through the Fram Strait gateway (sill depth of ~2545 m) and the Barents Sea (average depth of ~230 m) (Fig. 1). The AO itself consists of ~50 % shallow shelf seas and ~50 % deep basins and is divided by the Lomonosov Ridge (sill depth of ~1870 m) into the Eurasian and the Canadian (or Amerasian) Basins. The Eurasian Basin is further subdivided by the Nansen-Gakkel Ridge (sill depth of ~3000 m) into the Nansen Basin (~4000 m deep) and the Amundsen Basin (~4500 m deep) and the Canadian Basin is separated into the Canada Basin and the Makarov Basin (both ~4000 m deep) by the Alpha-Mendeleev Ridge (sill depths of
~2400 m) (Jones, 2001; Mauritzen et al., 2013). Exchange between the AM and the North Atlantic is maintained across the Greenland-Scotland Ridge (sill depth of ~840 m in the Faroe Bank Channel and ~640 m in the Denmark Strait) and the Canadian Archipelago (major gateways are the Nares Strait, the Lancaster Sound, and the Jones Sound, with maximum sill depths of ~220 m), while communication with the Pacific is restricted to the ~50 m deep and ~50 km wide Bering Strait.
The water column of the AO is highly stratified (Aagaard et al., 1985; Carmack, 1990; Jones, 2001). The upper water column is dominated by riverine runoff from the Arctic Rivers, which constitutes ~10 % of the world’s river discharge (Aagaard and Carmack, 1989). The riverine freshwater is mainly transported or stored within the Polar Mixed Layer (PML), which occupies the uppermost water column (< ~50 m) and is isolated from the Atlantic Layer by a cold and almost isothermal halocline (Jones, 2001).
The latter is maintained by the admixture of dense brine-enriched shelf waters (Aagaard et al., 1981; Melling and Lewis, 1982) and historically has been divided into the upper and the lower halocline, which were suggested to mainly comprise waters of Pacific and Atlantic origin, respectively (Jones and Anderson, 1986). In contrast to the nutrient-poor lower halocline (salinities of 34.2-34.4), the upper halocline (salinities of 32.8-33.2) is characterized by high nutrient concentrations, as well as low oxygen and pH values, in agreement with its Chukchi and East Siberian seas origin, where remineralization of organic matter and release of decay products occur in brine-enriched shelf bottom waters (Anderson et al., 2013). While the upper halocline is limited to the Canadian Basin of the AO and only rarely reaches the Amundsen Basin where it merges with the PML, the lower halocline can be found throughout the entire AO. According to Rudels et al. (2005), the ~150 m thick Arctic halocline is a distinct water mass and not just an indication of a sharp salinity gradient. Waters spreading within the Arctic halocline and the PML have been classified as Polar Surface Water (PSW) or Polar Water (Rudels et al., 2012; 2005). The composition of the PSW that exits the AO through the western Fram Strait via the southward flowing East Greenland Current (EGC) has been the focus of numerous studies that tried to decipher the different Arctic derived components and documented seasonal and interannual variations of their relative fractions (e.g. Dodd et
- 8 -
al., 2009; Dodd et al., 2012; Falck, 2001; Falck et al., 2005; Jones et al., 2008b; Laukert et al., 2017; Rabe et al., 2013; Taylor et al., 2003).
The relatively warm and saline Atlantic-derived waters form the Atlantic Layer of the AM below the Arctic halocline (Aagaard and Carmack, 1989; Aagaard et al., 1985) and reach depths of ~750 m within the AO (Rudels et al., 2004). It is common practice to refer to these waters as “Atlantic Water” (AW). The AW not only is the major source
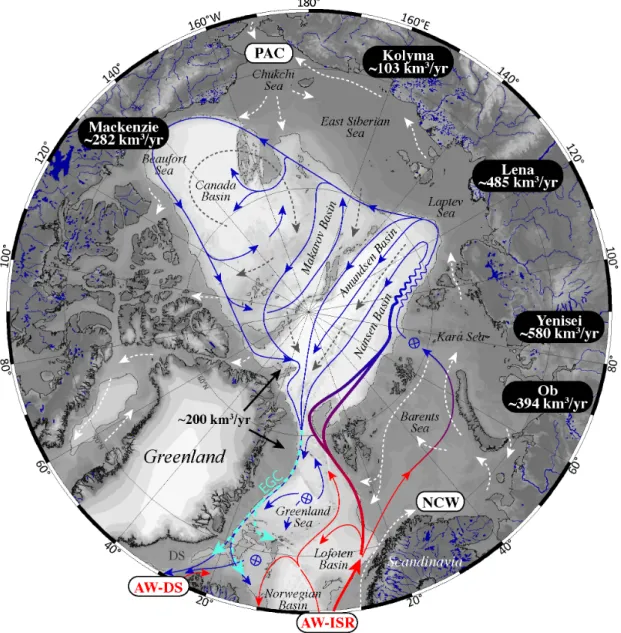
Figure 1: Bathymetric map of the AM (IBCAO; Jakobsson et al., 2012) with circulation scheme of the upper layers (dashed white and gray lines) and the subsurface Atlantic and intermediate layers (solid red and blue lines; change in color represents transformation of Atlantic Water) (modified after Rudels et al., 2012). Flow of the East Greenland Current (EGC) is indicated in addition (dashed cyan lines). Circled crosses indicate sites of convection or sinking from intermediate and AW layers to deeper levels. Water masses and major Arctic rivers that contribute to the AM are provided in white and black rounded boxes, respectively. Water masses are labeled as follows: Atlantic Water at the Iceland-Scotland Ridge – AW-ISR, Atlantic Water at the Denmark Strait – AW-DS, Pacific- derived water – PAC. Mean annual discharge of the rivers (R-Arctic-NET, http://www.r- arcticnet.sr.unh.edu/) and from Greenland (for 2010, Bamber et al., 2012) to the AM is given in km3/yr. The figure was produced using Ocean Data View (Schlitzer, 2016) and modified manually.
- 9 -
of oceanic heat to the AM but also dominates the circulation within the AM (Fig. 1). It enters the AM across the Greenland-Scotland Ridge and is transported northward via the Norwegian Atlantic Current (Aagaard et al., 1987), which further north is transferred into the West Spitsbergen Current (WSC) (e.g. Rudels et al., 1999b; 2004). While one part of the AW returns to the Nordic Seas within the Fram Strait or slightly north of it and is termed Recirculating Atlantic Water (RAW), the other part enters the AO as the Fram Strait Branch Water (FSBW), and, after subdivision into the Yermak and the Svalbard streams and their recombination north of Svalbard, continues to flow eastward as the Arctic Circumpolar Boundary Current along the continental margins of the AO (Aksenov et al., 2011; Rudels et al., 1999b). While the circulation of the FSBW is mainly restricted to the Nansen Basin, AW entering the AO through the Barents Sea continues to flow along the continental slope and ultimately enters the Makarov and Canada Basins (Rudels et al., 2015). During its transport through the AO, AW of both branches loses heat due to ice melting and exchange with the atmosphere and/or mixing with colder waters from the Barents Sea, the Bering Strait, and with river runoff (e.g. Rudels et al., 2015). This transformation results in the formation of the Atlantic-derived halocline water (i.e. mostly the lower Arctic halocline, see above) and the cooler (θ ≤ 2 °C) Arctic Atlantic Water (AAW), which north of the Fram Strait acquires a bi-modal structure due to the recombination of the two branches (Rudels et al., 2012). Together with the RAW, the AAW exits the AO through the western part of Fram Strait via the EGC and forms one of the major sources of the Denmark Strait Overflow Water (Havik et al., 2016).
Below the Atlantic Layer, the Upper Polar Deep Water (UPDW) and the Arctic Intermediate Water (AIW) occupy most of the intermediate depths in the AO and the NS, respectively. While the UPDW consists of Arctic intermediate waters prevailing below the AAW and above the Lomonosov Ridge (~1700 m) (Rudels et al., 2000) and has a similarly bi-modal structure compared to the AAW, the AIW is formed through cooling and convection of AAW and RAW after their detachment from the EGC in the northern NS (Rudels et al., 2012). There, the AIW spreads below the AW and also re- enters the AO as part of the WSC. The UPDW is mainly ventilated by boundary convection processes, which are thought to transfer shelf waters with high amounts of brines to deeper depths (e.g. Aagaard and Carmack, 1989). The ventilation of this intermediate layer in the Eurasian Basin is faster (~200 years) than that in the Canadian Basin (~300 years) (Tanhua et al., 2009).
The Eurasian Basin Deep Water (EBDW) and Canadian Basin Deep Water (CBDW) are found below the intermediate depths (> ~1700 m) and are confined to the major basins of the AO, but also exit the AO along the East Greenland margin (e.g.
Rudels et al., 2000). Due to the deep ocean circulation of the AM being isolated from the world ocean below ~840 m depth (i.e. this is the deepest sill depth of the Greenland- Scotland Ridge), the EBDW and the CBDW have relatively long ventilation times of
~250-300 and ~360-800 years, respectively (Tanhua et al., 2009 and references therein).
The deep waters from the Nordic Seas are commonly summarized as the Nordic Seas Deep Water (NDW) and include the Greenland Sea Deep Water (GSDW), the Iceland Sea Deep Water (ISDW) and the Norwegian Sea Deep Water (NSDW) (e.g. Rudels et al.,
- 10 -
2012; 2005). The stratification in the NS in general is less well defined compared to that of the AO due to the strong advection of Arctic- and Atlantic-derived water masses, but also due to the transformation of the latter to deeper levels at sites of deep convection (Aagaard, 1989).
In contrast to the generally cyclonic movement of AW and other subsurface water masses within the AO (Fig. 1), the movement of sea ice is mainly anticyclonic and is controlled by the Beaufort Gyre and the Transpolar Drift Stream. Both wind-driven currents not only govern sea-ice transport within the AO but also control the freshwater movements in the uppermost water column (Fig. 1), causing freshwater accumulation in the Canadian Basin (e.g. Giles et al., 2012). The exact flow paths of sea ice and freshwater and their changes are regulated by the North Atlantic Oscillation and the Arctic Oscillation (Ambaum et al., 2001), which influence transport in a similar fashion (e.g.
Steele et al., 2004).
1.3 Annual hydrographic variability of the Siberian shelf seas
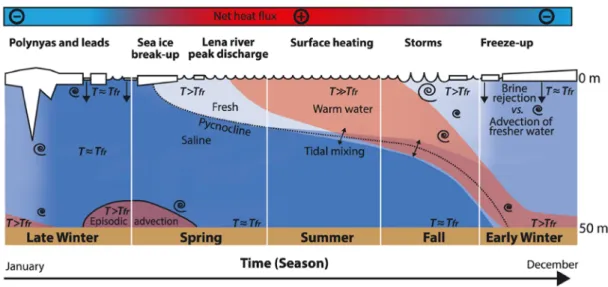
The hydrography of the vast and shallow Siberian shelf seas is strongly influenced by river discharge, sea-ice formation and melting, tides, wind mixing and episodic advection of Arctic basin waters (e.g. Janout et al., 2016), and thus differs significantly from that of the open AM. As an example, the annual hydrographic variability of the Laptev Sea is illustrated in Fig. 2 as a schematic drawing (Janout et al., 2016) and discussed in the following.
During winter (i.e. November to April), the near-coast regions of the shelf seas are covered by landfast ice (i.e. ice that is fastened to the coast), while mobile pack ice dominates the central and outer regions (e.g. Bareiss and Görgen, 2005). So-called polynyas (i.e. openings in the ice cover) frequently form along the landfast-ice edges due to southerly winds (e.g. Bareiss and Görgen, 2005) leading to extreme air-sea heat fluxes and persistent sea-ice formation, as well as salinification of the water column due to brine rejection. Increasing solar radiation during spring and early summer (i.e. April to July) induces fast-ice breakup and sea-ice melt, which coincide with maximum river discharge rates that are several times higher than their annual mean (R-Arctic-NET, see http://www.r-arcticnet.sr.unh.edu/). The freshwater addition from rivers and sea-ice melt results in the formation of a fresh and warm surface layer, which is separated from the marine and brine enriched near-bottom waters by a strong vertical density and salinity gradient (i.e. seasonal pycnocline) throughout summer (i.e. August and September). Increased storm activity and a decrease in river discharge in late summer and fall (i.e. late September and October) decrease stratification again and allow cooling and mixing of the water column (e.g. Hölemann et al., 2011; Janout et al., 2016; Janout and Lenn, 2014). This generally leads to a nearly homogeneous water column during winter, except when summer stratification was anomalously strong before, winter mixing was weak (e.g. Dmitrenko et al., 2012 and references therein) or in areas where
- 11 -
freshwater is supplied beneath the fast-ice (e.g. close to the Lena Delta in the Laptev Sea).
Strong riverine runoff and the resulting lateral salinity gradients are among the most important factors that affect the complex water column structure and thus the physical as well as the biogeochemical environment in the shelf seas. The freshwater distribution on the shelves is mainly controlled by the atmospheric pressure conditions.
For example, the spreading and distribution of the Lena River plume has been linked to larger-scale atmospheric indices (e.g. Morison et al., 2012; Thibodeau et al., 2014) and to regional wind fields during summer (e.g. Dmitrenko et al., 2008; Janout et al., 2015), which either push the freshwater northwards across the shelf or eastwards into the East Siberian Sea.
1.4 Principles and application of neodymium isotopes as water mass tracer
Neodymium is a rare earth element and has seven naturally occurring stable isotopes (142Nd, 143Nd, 144Nd, 145Nd, 146Nd, 148Nd, and 150Nd). A fraction of the isotope 143Nd (abundance ~12.2 %) has been produced via α-decay of the samarium (Sm) isotope 147Sm (abundance ~15 %), which has a shorter half-life (~1.06 x 10¹¹ y) than that of 148Sm, which has also been confirmed to be radioactive (half life of ~7 x 10¹⁵ y). The decay of 147Sm is thus short enough to produce small but measurable changes in the abundance of the daughter isotope 143Nd over time, while the decay of 148Sm does not produce measurable
Figure 2: Schematic drawing of the annual hydrographic variability on the Laptev Sea shelf showing the dominant processes that control the structure of the water column. The density within the water column is indicated by the colors, with lighter colors representing less dense waters. The red area shows the spatiotemporal transformation of the warmed surface water to deeper levels. Water temperatures are expressed as “near freezing” (T ≈ Tfr), “above freezing” (T > Tfr), and “significantly above freezing” (T ≫ Tfr). The color bar indicates air-sea heat fluxes. Figure adopted from Janout et al. (2016).
- 12 -
changes in the abundance of its daughter 144Nd. Commonly, the radiogenic 143Nd isotope is normalized to the primordial isotope 144Nd, and the 143Nd/144Nd ratio typically is expressed in the εNd notation, which denotes the deviation of a measured 143Nd/144Nd ratio from the Chondritic Uniform Reservoir (CHUR) in parts per 10000, with CHUR having a modern 143Nd/144Nd value of 0.512638 (Jacobsen and Wasserburg, 1980). The εNd
notation thus is defined by the following equation:
𝜀𝜀𝑁𝑁𝑁𝑁=
⎣⎢
⎢⎢
⎡� 𝑁𝑁𝑁𝑁143
144𝑁𝑁𝑁𝑁� 𝑆𝑆𝑆𝑆𝑆𝑆𝑆𝑆𝑆𝑆𝑆𝑆
�143𝑁𝑁𝑁𝑁
144𝑁𝑁𝑁𝑁� 𝐶𝐶𝐶𝐶𝐶𝐶𝐶𝐶
−1
⎦⎥
⎥⎥
⎤
× 10,000
Given that Nd is more incompatible than Sm in solid-liquid magmatic systems, it preferentially accumulates in the melt during partial melting or fractional crystallization over Sm. This produces lower Sm/Nd ratios in the melt than in the residue, ultimately yielding higher 143Nd/144Nd ratios in the mantle (i.e. the residue fraction) compared to those in the crust (i.e. the melt fraction). Consequently, young mantle-derived rocks formed at mid-ocean ridges or at hotspots (e.g. basalts, diorites, gabbros) exhibit higher
143Nd/144Nd ratios compared to the old continental rocks (e.g. granites, metamorphic rocks) and thus have higher, more radiogenic εNd values than old continental rocks, which typically have more negative (i.e. unradiogenic) εNd values. The rock εNd signatures do not only vary as a function of the age of the rocks, but also as a function of the Sm/Nd ratio of the rocks, which causes distinct εNd signatures for different continental regions and geological formations.
During physical and chemical weathering of the continental crustal material Nd isotopes are generally not affected significantly by isotopic fractionation (Frank, 2002 and references therein) and thus the characteristic Nd isotope compositions of the rocks are transferred to the rivers and subsequently to the oceans. The quasi-conservative behavior of Nd in the open ocean (Frank, 2002; Goldstein and Hemming, 2003) and its intermediate oceanic residence time of several hundred years (Arsouze et al., 2009;
Rempfer et al., 2011; Tachikawa et al., 2003) then imparts water masses with distinct εNd
signatures at the ocean boundaries and allows tracing of these water masses and their mixing in the open ocean. However, the Nd isotope distribution in the oceans is not only controlled by the εNd signatures of the source material and the advection and mixing of water masses, but also depends on various criteria that govern the marine distribution of the rare earth elements (see section 1.5). While biological processes or evaporation do not fractionate Nd isotopes (e.g. Frank, 2002) and they are also not affected by hydrothermal contributions (e.g. German et al., 1990; Halliday et al., 1992), the preformed Nd isotope distribution can be changed significantly through particle- seawater interactions (see also section 1.5). In the open oceans, alterations of the seawater Nd isotope composition without significant changes in the Nd concentration were globally observed in intermediate and deep waters at ocean margins, and the responsible mechanism was termed “boundary exchange” (Lacan and Jeandel, 2005).
- 13 -
According to Jeandel (2016) the processes and locations contributing to boundary exchange are discharge of large amounts of freshly weathered particles at the river mouths, submarine weathering of deposited sediments along the margins, submarine groundwater discharges and release via subterranean estuaries. The constant Nd concentrations are likely maintained during this process because release of Nd through
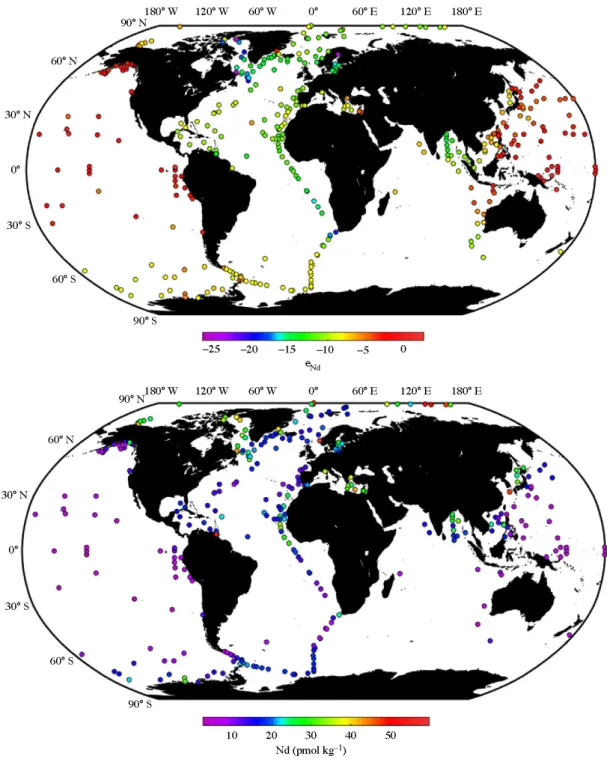
Figure 3: Map of surface seawater Nd isotopic compositions (upper panel) and Nd concentrations (lower panel). Only seawater samples from depths shallower than 100 m are shown and samples with Nd concentrations > 60 pmol/kg are not shown in order to visualize the main features of the Nd distribution in the open ocean. Modified after van de Flierdt et al., 2016).
- 14 -
dissolution, desorption or remineralization competes with Nd removal through precipitation and adsorption. Another observation that complicates the applicability of Nd isotopes as a water mass tracer is that the Nd concentration profiles within the open water column are mostly decoupled from profiles of Nd isotopes (e.g. Goldstein and Hemming, 2003), a phenomenon summarized under the term “Nd paradox” (Siddall et al., 2008). The Nd paradox was suggested to result from ”reversible scavenging” (Nozaki and Alibo, 2003; Siddall et al., 2008), a process that involves vertical transport of the REEs through a combination of formation and remineralization of organic particles or scavenging and release from inorganic particles. These processes for example have been recently confirmed to contribute to the REE distribution observed in the North Atlantic (e.g. Lambelet et al., 2016; Stichel et al., 2015).
Still, the modern marine Nd isotope distribution, in particular in near surface waters, can to a large extent be attributed to the εNd signatures supplied by the continental sources, which can be seen in Fig. 3, in which global surface seawater Nd isotopic compositions and Nd concentrations are plotted (van de Flierdt et al., 2016).
While the Pacific is characterized by relatively radiogenic εNd signatures in agreement with the young mantle-derived lithologies that surround this ocean basin (cf. circum- Pacific belt), the North Atlantic exhibits less radiogenic seawater εNd values consistent with Nd input from the old rocks of North America and Greenland. The upper water column Nd isotope distribution of the AM is also mainly controlled by the riverine and marine sources (see Fig. 4 and chapter I). This overall illustrates that Nd isotopes are a powerful tool to study modern water mass provenance and their mixing. In addition, as indicated above, the Nd isotopes are also a useful tool to investigate processes that change their distribution beyond what can be expected from water mass advection and mixing (e.g. Lambelet et al., 2016; Stichel et al., 2015). They are also widely applied in paleoceanography as a tracer for change of past water mass provenance and ocean circulation on different timescales (e.g. Böhm et al., 2015; Chen et al., 2012; Dausmann et al., 2015; Fagel and Mattielli, 2011; Fagel et al., 2014; Haley and Polyak, 2013; Teschner et al., 2016; Werner et al., 2014).
1.5 Principles and application of REEs in seawater
The rare earth elements (REEs) are defined as a group of transition metals that include all lanthanides (i.e. lanthanum, La, cerium, Ce, praseodymium, Pr, neodymium, Nd, samarium, Sm, europium, Eu, gadolinium, Gd, terbium, Tb, dysprosium, Dy, holmium, Ho, erbium, Er, thulium, Tm, ytterbium, Yb and lutetium, Lu), as well as yttrium (Y) and scandium (Sc). The latter has historically been classified as a REE but typically is not considered due to its small ionic radius. A subdivision into light (L)REEs (from La up to and including Eu), middle (M)REEs (from Gd up to and including Dy) and heavy (H)REEs (from Ho up to and including Lu) is often applied to cluster REEs of similar behavior. The REEs behave coherently in nature but a gradual decrease in ionic radius and an increase in covalent character with increasing atomic number due to the filling of
- 15 -
the 4f-orbital (i.e. the lanthanide contraction) lead to small but systematic changes in the geochemical behavior across the group. While the LREEs are highly incompatible in a magmatic solid-liquid system and thus prefer the liquid phase (i.e. the melt), the HREEs are more compatible and thus prefer to stay in the solid phase (i.e. the mantle).
The fractionation of elements during partial melting and fractional crystallization of igneous minerals and rocks in the past has led to the chemical differentiation of the Earth’s interior (Hofmann, 1988), and means for the modern REE distributions that different minerals and lithologies are imparted with distinct REE concentrations and distribution patterns.
Once the minerals and rocks are exposed at the Earth’s surface, they are physically and chemically weathered and the mobilized REEs are introduced into the oceans mainly via rivers (e.g. Byrne and Sholkovitz, 1996; Goldstein et al., 1984) and through atmospheric inputs (e.g. de Baar, 1983; Elderfield and Greaves, 1982; Frank, 2002; Sholkovitz, 1993; Tachikawa et al., 1999). The mobilization and fractionation of lithogenic REEs during weathering has been suggested to depend on (i) the chemistry of the waters involved, soil pH and the concentration of dissolved organic matter, (ii) the abundance and weathering pattern of the weathered minerals and (iii) the formation of secondary phases in soils that sequester the REEs (Baskaran, 2011 and references therein). This complex interplay of parameters and processes makes it almost impossible to predict the exact concentrations of the mobilized REEs. Assessments of the REE budget and distribution in the oceans therefore require observational data from the land-ocean interface, which ideally include REE end-member concentrations of the individual sources of weathered material. Due to the lithogenic origin of the REEs, it is common practice to normalize their concentrations to those of a continental reference material, for example to those of the Post Archean Australian Shale (PAAS, McLennan, 2001). This approach not only allows tracking changes after the REEs have been introduced into the oceans but also provides the basis for detecting subtle differences in the REE patterns.
The rivers are assumed to be the main primary source of lithogenic REEs to the oceans. The REEs supplied via the riverine loads span a wide range of concentrations (e.g. Elderfield et al., 1990; Goldstein and Jacobsen, 1987), which generally are higher (Nd > ~100 pmol/kg) than those determined in open ocean seawater (up to ~50 pmol/kg for Nd, see Fig. 3 which presents the updated global Nd database provided by van de Flierdt et al. (2016). Similar to the heterogeneity in REE concentrations observed for the rivers, the relative REE distribution patterns differ between most rivers and partly exhibit distinct anomalies for individual REEs (e.g. Elderfield et al., 1990; Sholkovitz, 1992, 1995). However, compared to the REE distributions in seawater, most riverine REE distributions are characterized by lower HREE to LREE ratios (e.g. Elderfield et al., 1990), resulting in overall flat or slightly HREE-enriched PAAS-normalized REE patterns (Goldstein and Jacobsen, 1988a, b). Rivers that are enriched in the MREEs are less common and exhibit hump-shaped PAAS-normalized REE patterns (e.g. Tepe and Bau, 2014).
- 16 -
The riverine REEs are supplied to the oceans within different size pools. The REEs carried in the suspended load (> 0.2 or 0.45 μm) are quickly removed from the water column and thus likely have no significant influence on the REE distribution in the open oceans, in contrast to REEs supplied by the dissolved load. While early investigations considered everything that passes the 0.2 (or 0.45) μm filter membrane to be dissolved (e.g. Elderfield et al., 1990), recent investigations differentiate between the truly dissolved pool (< 1 or 10 kDa) and the colloidal pool (1 or 10 kDa < REE < 0.2 or 0.45 μm) (e.g. Merschel et al., 2017; Rousseau et al., 2015; Tepe and Bau, 2015). The latter hosts different REE-bearing nanoparticles and colloids (NPCs), which are composed either of organic (e.g. humic and vulvic acids) or inorganic (e.g. mineral particles and volcanic ash, including Fe and Mn (oxyhydr)oxides) material. As the river water mixes with seawater, the seawater cations induce coagulation of the NPCs, which are then removed from the water column as they settle to the seafloor (Boyle et al., 1977).
This process has often been indirectly documented by a sharp decrease of the dissolved REE concentrations in the low-salinity zone of several global estuaries together with concurrent preferential removal of LREEs over HREEs (e.g. Åström et al., 2012; Elderfield et al., 1990; Lawrence and Kamber, 2006; Nozaki et al., 2000; Pokrovsky et al., 2014;
Rousseau et al., 2015; Sholkovitz and Szymczak, 2000; Sholkovitz, 1995). The fractionation between LREEs and HREEs has been attributed to the combined effects of HREEs preferentially staying in solution and the general affinity of all REEs to attach to surfaces of organic or inorganic NPCs (Lee and Byrne, 1993). The removal of REEs in estuaries globally amounts to ~70 % for Nd, but differs between rivers (Rousseau et al., 2015). Recent experiments simulating estuarine mixing show that the composition of the rivers and in particular the riverine NPCs plays a major role in estuarine REE behavior (Merschel et al., 2016; Tepe and Bau, 2016). While large amounts of organic NPCs contained in river water inhibit the aggregation of REEs until salinities of ~10 are reached, the presence of large amounts of inorganic NPCs favors fast and strong REE removal (Merschel et al., 2016). River chemistry also controls estuarine release of NPC- bound REEs at higher salinities (e.g. Tepe and Bau, 2016). Arctic estuarine mixing experiments of Tepe and Bau (2016) show that this process likely only occurs when the riverine end-member is rich in inorganic NPCs and poor in organic NPCs. In addition to release of NPC-bound REEs, the release of REEs from suspended or deposited lithogenic particles was suggested to occur in estuaries, but to date was only demonstrated for the Amazon River (Rousseau et al., 2015).
All above-mentioned estuarine processes (i.e. REE removal through coagulation of NPCs, remobilization of REEs from aggregated NPCs and release of REEs from suspended or deposited lithogenic particles) also play an important role in the development of the seawater pattern (Hoyle et al., 1984; Nozaki et al., 2000; Rousseau et al., 2015; Sholkovitz, 1995). However, the distribution of the REEs in the oceans also highly depends on their residence times (close to the oceanic overturning time of ~1000 years; Broecker and Peng, 1982), their oxidation state (+3 for all REEs, except for Ce and Eu that also can occur in +2 and +4 oxidation states, respectively; e.g. Brookins, 1989) and seawater-particle interactions either occurring at the more widely defined land-
- 17 -
ocean interface including the margins (i.e. processes summarized under the term
“boundary exchange”, see section 1.4) or within the water column of the open ocean (e.g.
vertical redistribution of the REEs through combined formation and remineralization of organic particles or scavenging and release from inorganic particles, a process summarized as “reversible scavenging”, see section 1.4). Lateral advection of water masses that have a distinct REE distribution pattern depending on their age and their source region also significantly contribute to the distribution of the REEs within the oceans (often called “preformed” distribution; e.g. Zheng et al., 2016). All these criteria contribute differently in different oceanic settings and regions, resulting in distinct REE distributions observed within the oceans. In general, the water column in the Pacific and the Atlantic oceans is depleted in REEs at the surface and enriched at depth, while the concentrations are higher in the deep Pacific than in the deep Atlantic, likely as a function of water mass ages (Goldstein and Hemming, 2003). The REE distribution within the AM differs fundamentally from those of the Pacific and Atlantic oceans, given its REE enrichment in the upper water column due to high riverine inputs and almost constant REE concentrations at greater depths (Andersson et al., 2008; Porcelli et al., 2009; Westerlund and Öhman, 1992; Yang and Haley, 2016). The latter can likely be explained by the circulation pattern of the AM and the low primary productivity, which both inhibit strong vertical transport of REEs from the upper water column to deeper levels (see chapter I).
The PAAS-normalized seawater REE patterns are globally depleted in LREEs and have a pronounced Ce anomaly (e.g. Elderfield and Greaves, 1982), which forms due to the oxidation of Ce3+ to insoluble Ce4+. Yttrium develops a positive anomaly and may decouple from Ho during estuarine mixing although it is its geochemical twin (e.g. Bau et al., 1995; Lawrence and Kamber, 2006). Thus, while the Ce anomaly provides valuable information on the oxidation state of seawater and sediments and the age of the water masses, the Y/Ho ratio mainly provides information on estuarine processes. Several studies have shown that the dissolved REE concentrations and their distribution patterns can provide valuable information on the composition of the source rocks and input pathways, the amount of time that passed since the last exposure of waters to weathering inputs, and particle adsorption and desorption processes (e.g. Garcia-Solsona et al., 2014;
Haley et al., 2014; Hathorne et al., 2015; Molina-Kescher et al., 2014; Osborne et al., 2015;
Rousseau et al., 2015; Wilson et al., 2013; Zheng et al., 2016).
1.6 REE sources in the Arctic Mediterranean and their ε
Ndsignatures
While the amount of Nd data globally has doubled between 2011 and 2015 (van de Flierdt et al., 2016), no dissolved Nd data from the AM have been published during this period of time. Observations from pioneering studies performed in the 2000s (Andersson et al., 2008; Lacan and Jeandel, 2004a, b; Porcelli et al., 2009; Zimmermann et al., 2009), however, still allow a holistic evaluation of the major Nd sources (see below and Fig. 4).
- 18 -
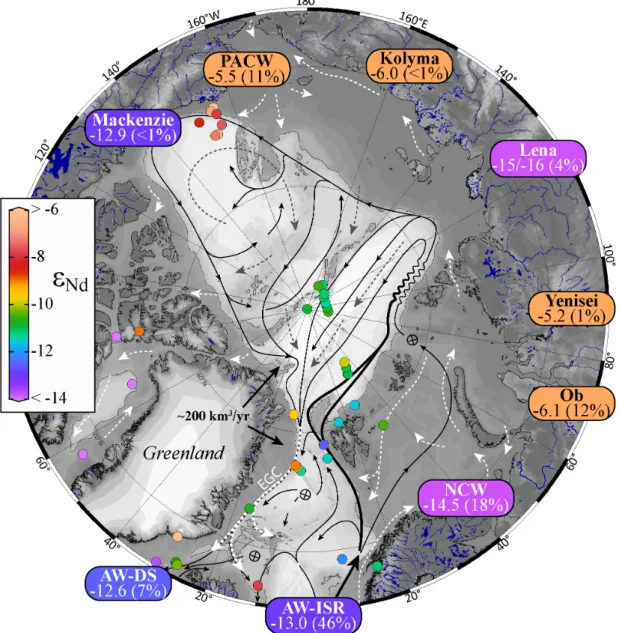
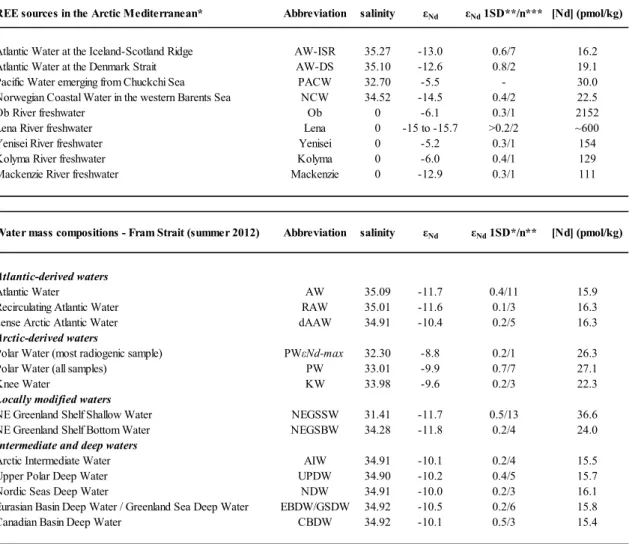
Figure 4: Map of the AM (Fig. 1) showing the εNd distribution, which is color-coded and provided for REE sources (color-coded rounded boxes with εNdvalues) and shallow seawater samples compiled from literature (color-coded circles) (Andersson et al., 2008; Lacan and Jeandel, 2004a, b; Piepgras and Wasserburg, 1987; Porcelli et al., 2009; Werner et al., 2014; Zimmermann et al., 2009). Only seawater data from water depths shallower than 60 m and uncertainties (2σ) better than 0.7 are shown. Rare earth element sources with known εNd values and [Nd] are Atlantic Water (AW) entering through the Iceland-Scotland Ridge (AW-ISR) and the Denmark Strait (AW-DS) (Lacan and Jeandel, 2004a,b), Norwegian Coastal Water (NCW; Petrova, 2015), modified Pacific-derived water emerging from the Chukchi Sea (PACW; Dahlqvist et al., 2007; Porcelli et al., 2009) and major Arctic rivers (Persson et al., 2011; Porcelli et al., 2009; Zimmermann et al., 2009). Bold black arrows indicate mean freshwater flux from Greenland into the Arctic Ocean and the Nordic Seas for the year 2010 (Bamber et al., 2012). The estimated Nd inputs of the corresponding sources are given as percentage of the total Nd input into the AM taking into account volume transport and [Nd] of the sources (only rivers with discharges >100 km3/yr are considered). Further information on the REE sources of the AM is provided in the text. The figure was produced using Ocean Data View (Schlitzer, 2016) and modified manually.
- 19 -
The AW is clearly the major marine source of Nd (~53 % of Nd input to the AM;
estimated here by taking into account volume transport (for mean volume transport of water masses see Mauritzen et al., 2013; for mean discharge of the Arctic rivers see R- Arctic-NET, http://www.r-arcticnet.sr.unh.edu/) and [Nd] (Lacan and Jeandel, 2004a, b;
Persson et al., 2011; Petrova, 2015; Porcelli et al., 2009; Zimmermann et al., 2009) of all known Nd sources) and is characterized by an average εNd signature of -13.0 (1 SD = 0.6, n = 7) and an average Nd concentration ([Nd]) of 16.2 pmol/kg (1 SD = 2.1) at the Iceland-Scotland Ridge (AW/ISR; data from Lacan and Jeandel, 2004b) and average εNd = -12.6 (1 SD = 0.8, n = 2) and [Nd] = 19.1 pmol/kg (1 SD = 0.5) at the Denmark Strait (AW/DS; data from Lacan and Jeandel, 2004a). As discussed in chapter I, the AW which enters the AO through the eastern Fram Strait carries an εNd signature of -11.7 (1 SD = 0.4, n = 11) and [Nd] = 15.9 pmol/kg (1 SD = 0.5). The AW that enters the AO through the Barents Sea has an εNd signature of -12.4 (1 SD = 0.4, n = 5) and [Nd] = 16.7 pmol/kg (1 SD
= 1.3) in the western Barents Sea (Petrova, 2015). There is also clear evidence that the Nd isotopic composition of AW gradually changes during transport across the AM due to admixture of other water masses (see chapter I).
The second largest marine REE source (~18 % of the Nd input into the AM) is the Norwegian Coastal Water (NCW) that enters the AM from the North Sea. It flows along the western and northern coast of Norway (i.e. Norwegian Coastal Current) and is characterized by S < 34.7 in the Barents Sea (Loeng, 1991). These waters mainly originate from the Baltic Sea (Gascard et al., 2004), where the dissolved Nd isotopic compositions are relatively unradiogenic (εNd < -13) and an εNd signature of -15.6 is reported for the surface sample closest to the Danish Straits (Chen et al., 2013). Water mass data from the western Barents Sea that resemble NCW characteristics also show a relatively unradiogenic εNd composition of -14.5 and [Nd] = 22.5 pmol/kg (Petrova, 2015).
In contrast to these relatively unradiogenic Nd sources, Pacific-derived waters entering the AO through the Bering Strait have more radiogenic εNd values between -4 and -6 (Dahlqvist et al., 2007). These waters are modified towards less radiogenic values through water-shelf interaction in the Chukchi Sea, which results in εNd values of ~ -5.5 and Nd concentrations of up to ~30 pmol/kg (PACW; see Porcelli et al., 2009) for waters leaving the shelf. These waters are the third largest REE source (~11 % of Nd input to the AM) and the largest source with radiogenic Nd isotopic compositions.
The Siberian and North American Rivers draining into the Arctic Ocean have a wide range of Nd concentrations and isotopic compositions (see Persson et al., 2011;
Porcelli et al., 2009; Zimmermann et al., 2009), and their Nd input to the AM is estimated to be ~19 % (here, only rivers with known [Nd] and discharge rate > 100 km3/yr are considered). Their initial Nd concentrations can be a hundred times higher than those of typical seawater, but a considerable fraction is removed in estuaries and on the Arctic shelves (Porcelli et al., 2009). The major rivers (Mackenzie, Lena, Yenisei, Ob and Kolyma) have been sampled in 2003 (Zimmermann et al., 2009), and only the Lena River was re-sampled in 2004 (Porcelli et al., 2009) and in 2008 (Persson et al., 2011).
No shift in the isotopic composition (εNd= -14.2±0.3 for 2003; εNd = -13.6±0.4 for 2004) but large differences in Nd concentrations (826 pmol/kg for 2003; 477 pmol/kg for
- 20 -
2004) have been observed between 2003 and 2004, and seasonal variations in weathering inputs and precipitation were suggested to account for this change (Porcelli et al., 2009). However, the εNd and [Nd] values from 2003 and 2004 (Porcelli et al., 2009; Zimmermann et al., 2009) reported for the Lena River do not exactly represent the Nd isotopic composition of freshwater at the Lena Delta, since they were obtained from samples collected ~500 km upstream (Zhigansk, Russian Federation; see Zimmermann et al., 2009, for further information). Additionally, the sample from 2003 was only filtered a few days after collection (Zimmermann et al., 2009). Persson et al.
(2011) reported a less radiogenic εNd of -15 and [Nd] ~600 pmol/kg for the Lena River water at the river mouth. Seawater data close to the Lena Delta from September 2013 indicate a slightly less radiogenic signature of the Lena River water with εNd ~ -16 and [Nd] ~550 pmol/kg (see chapters I and II). The change in the Nd isotopic composition from -14 (~500 km upstream) to -15/-16 (Lena Delta) most likely results from the different compositions of the geological formations within the Lena River catchment combined with seasonal variations in river runoff.
Additional contributions of Nd via glacial meltwater and runoff are also likely.
Dissolved REE concentrations in glacial waters from the Kangerlussuaq area in western Greenland were for example shown to be ~60 times higher (for [Nd]) than those of typical seawater and indicate significant input of REEs from the Greenland Ice Sheet to the North Atlantic (Tepe and Bau, 2015). Tepe and Bau (2015) suggested local Archean basement as well as Asian dust to be the main sources of REEs, which indicates a mixture of different Nd isotopic compositions to be released to the North Atlantic. For shelf waters (30.5 < S < ~33) close to the Nansen Fjord on the east side of Greenland, Lacan and Jeandel (2004a) also reported high [Nd] (~100 pmol/kg) with a distinct Nd isotopic signature (εNd ~ -3.5), suggesting that this enrichment is caused by lithogenic input from the basaltic Fjord area. The input of Greenland-sourced Nd to the AM is also evidenced by seawater Nd data from the Fram Strait (see chapter I).
A direct release of REEs from aeolian dust to the sea surface was shown to occur worldwide (e.g. Goswami et al., 2014; Greaves et al., 1999; Rickli et al., 2010). However, in the polar region the low temperatures and the sea-ice cover largely prevent a direct release of REEs from the atmosphere to the Arctic Ocean in winter and year-round in the central Arctic. Instead, the REEs are most likely scavenged by snow, deposited on the sea ice and only released during snow and sea-ice melting. No REE concentrations have been reported as yet for Arctic snow deposited on the Arctic sea-ice cover and the contribution of REE inputs through snow melting is thus unknown.
Similarly, no observational evidence is available for significant Nd fluxes during sea-ice formation or melting. Sea-ice production is accompanied by salt rejection into the underlying water with the remaining salt in the ice being trapped in liquid interstitial brines (e.g. Notz and Worster, 2009). No dissolved REE concentrations have been reported for Arctic fast or pack ice to date, but it is reasonable to assume that the distribution of the dissolved REEs will be consistent with the salinity changes. The salinity of Arctic sea ice mainly ranges from close-to-zero to ~10 (e.g. Vancoppenolle et al., 2009 and references therein), with an overall average salinity of ~4 (Bauch et al.,
![Figure 3: Distribution of the salinity (all CTD data), the Nd isotopic composition (ε Nd ) and the Nd concentration measured with the isotope dilution method ([Nd] ID , in pmol/kg) along the latitudinal section at 78.8° N](https://thumb-eu.123doks.com/thumbv2/1library_info/5335280.1681163/48.892.133.763.152.845/distribution-salinity-isotopic-composition-concentration-measured-dilution-latitudinal.webp)
![Figure 6: Salinity versus ε Nd , [Nd] ID and HREE/LREE (PAAS-normalized), as well as interpolated silicate concentrations ([Si] interp , in μmol/kg) versus εNd plots for all samples (grey dots) and distinct water masses (see](https://thumb-eu.123doks.com/thumbv2/1library_info/5335280.1681163/52.892.140.449.348.1108/figure-salinity-normalized-interpolated-silicate-concentrations-samples-distinct.webp)
