Analog of microwave-induced resistance oscillations induced in GaAs heterostructures by terahertz radiation
T. Herrmann,1I. A. Dmitriev,2,3D. A. Kozlov,4,5M. Schneider,1B. Jentzsch,1Z. D. Kvon,4,5P. Olbrich,1V. V. Bel’kov,3 A. Bayer,1D. Schuh,1D. Bougeard,1T. Kuczmik,1M. Oltscher,1D. Weiss,1and S. D. Ganichev1
1Terahertz Center, University of Regensburg, 93040 Regensburg, Germany
2Max Planck Institute, 70569 Stuttgart, Germany
3Ioffe Institute, 194021 St. Petersburg, Russia
4Rzhanov Institute of Semiconductor Physics, 630090 Novosibirsk, Russia
5Novosibirsk State University, 630090 Novosibirsk, Russia (Received 5 March 2016; published 1 August 2016)
We report on the study of terahertz radiation-induced MIRO-like oscillations of magnetoresistivity in GaAs heterostructures. Our experiments provide an answer on two most intriguing questions—effect of radiation helicity and the role of the edges—yielding crucial information for an understanding of the MIRO (microwave-induced resistance oscillations) origin. Moreover, we demonstrate that the range of materials exhibiting radiation-induced magneto-oscillations can be largely extended by using high-frequency radiation.
DOI:10.1103/PhysRevB.94.081301
One of the most interesting phenomena recently observed in two-dimensional electron systems (2DES) is microwave (MW) -induced resistance oscillations (MIRO) and associated zero resistance states (ZRS) [1–7], reviewed, e.g., in [8]. Like Shubnikov–de Haas oscillations (SdH), MIRO are periodic on a 1/B scale, but occur at lower magnetic fields and show much weaker temperature dependence. Phenomenologically, they are very similar to Weiss oscillations [9], which reflect the commensurability between the cyclotron orbit radius and the period of a periodic potential. MIRO by contrast, reflect the commensurability between the MW photon energy 2πf and the cyclotron energy ωc. In extremely clean samples the minima of the MIRO develop into ZRS [3–5], which are explained [10] in terms of an instability of the system and formation of current domains, occurring when the conductivity becomes negative under MW irradiation (see also [8,11,12]).
In spite of numerous experiments and significant advances in their theoretical understanding, there is still no commonly accepted microscopic description of the effect [13,14] and the ongoing MIRO investigations remain challenging [15–21].
Consequently, new materials have been studied [22–25] and new theoretical models have been put forward [26–30]. To the most pressing issues which need to be clarified experimentally and which might help to differentiate between the different models belong the MIRO polarization dependence [7,8,31]
and the “bulk” or “edge” nature of the effect.
So far the majority of experimental work has been done in the MW regime (1–350 GHz) and there are only a few reports on MIRO excited at terahertz (THz) frequencies [32–34].
Here we report on the observation of pronounced MIRO-like oscillations induced by THz radiation. We exploit the specific advantages of THz laser radiation not present in the MW regime, i.e., the possibility to focus it onto a spot smaller than the sample’s size and easy control of the radiation’s polarization. The most important features clearly detected on a large variety of samples are (i) a very weak dependence of the oscillations’ amplitude on the photon helicity and (ii) the bulk nature of the effect. Furthermore, our study shows that the MIRO oscillations can be excited at THz frequencies even
in the samples with low mobility, whereas in the MW range ultrahigh mobility samples are crucially needed for this type of experiments.
We study the radiation-induced oscillations in Al- GaAs/GaAs quantum wells of 10 or 12.5 nm thickness.
While THz MIRO oscillations have been observed in Hall bar samples [33], in this work we used Corbino disk samples, which measure directlyσxx. The inner,ri, and the outer,ro, radius of the gold-germanium contacts and samples’ transport parameters are given in TableI (see also the Supplemental Material [35]). The effect of THz radiation on conductivity σxx was studied in the temperature range fromT =2.5 K to about 20 K. The MIRO effect is most pronounced after the cooled samples have been exposed to room light, but the effect is also present for samples kept in the dark. All data presented in figures and tables were obtained after sample illumination.
The THz experiments were performed using continuous wave (cw) CH2O2 and CH2F2 lasers [36–38] operating at frequencies f =0.69 and 1.63 THz, respectively. The radiation at normal incidence is focused onto a spot size of about 3.4 mm diameter. The beam has an almost Gaussian profile, measured by a pyroelectric camera [39,40]. Right- and left-handed circularly polarized radiation is obtained by aλ/4 quartz plate [41–43]. The inset in Fig.1(b)sketches the setup.
Applying a bias voltage,Udc=50 mV, and measuring the photovoltageUon the load resistorRL=50we obtained the photoconductivityσxx∝U.
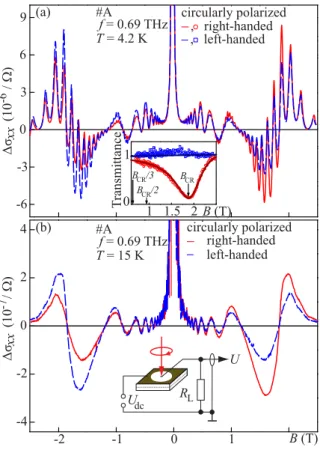
Irradiating the samples with THz radiation and sweeping the magnetic fieldBresults in conductivity oscillationsσxx. Figure1shows the photoconductivity (PC) for sample A and f =0.69 THz. The oscillations reflect two 1/Bperiodicities:
one at low B corresponding to the MIRO oscillations and the other, at higher fields |B| ∼1 T, corresponding to SdH oscillations. While the former oscillations are detected up to temperatures of about 20 K, the latter are observed at substantially lower temperatures only. The oscillations are observed for structures with mobilities betweenμ=1.8×10⁶ and 1.5×105cm2/V s and with electron densities fromne=4 to 24×1011 cm−2. Figure2 showsσxx normalized to the
TABLE I. Samples and their transport data atT =2 K including the electron densityneand mobilityμ, as well as the momentum,τp, and quantum,τq, relaxation times.
ri ro μ ne τp τq
Sample (mm) (mm) 103(cm2/Vs) 1011(cm−2) (ps) (ps)
A 0.25 1.5 820 12.0 33 4.2
B 0.3 1.0 1800 9.3 71 12.0
C 0.3 1.0 150 18.0 6 1.3
D 0.25 1.5 980 24.0 39 1.9
E 0.25 1.5 280 3.7 11 4.1
dark conductivity,σxx/σxx, for different samples. The data clearly show that the oscillations are periodic in =ω/ωc
withω=2πf and exhibit extrema at = N±1/4, where
NN =1,2,3. . .denote the position of the nodes [44,45]
and+(−) corresponds to minima (maxima). Here, the position of the cyclotron resonance (CR) atω=ωchas been obtained from the transmission experiments displayed in the inset of Fig.1(a). The overall behavior of the observed 1/Boscillations including the exponential damping at lowBand the 1/4 shift of the minima and maxima from the nodes corresponds to the well known MIRO effects as is further discussed below. Strikingly, Figs.1and2reveal that the oscillation amplitudes depend only weakly on the radiation helicity and some samples (B and D)
9 6 3 0 -3 -6 4
2
0
-2
-4
)/ 01(σΔxx-7)/ 01(σΔxx-6
B(T)
-2 -1 0 1
Tf= 0.69 THz= 15 K Tf= 0.69 THz= 4.2 K
#A
#A
B(T)
1 2
ecnattimsnar
T 0 1 (a)
(b)
left-handed right-handed circularly polarized
Udc RL
1.5
BCR
B /3CR
B /2CR
, left-handed , right-handed circularly polarized
U
FIG. 1. Magnetic field dependence ofσxx induced by modu- lated cw radiation with powerP ≈10 mW. The inset in panel (a) shows the transmission data. Lines show the transmission calculated after [47] by taking multiple reflections within the substrate and the superradiant decay into account [47–50].
1 2 3 4 5 6 7 c
0 (a)
(c) (b) -0.2
0.2
0 -0.005 0.005
0 0.04
0 -0.04
0 (d)
(e)
0
σ/σΔxxxx
#D
= 15 K T
#C
= 15 K T
#B
= 9.4 K T right-handed left-handed
#A
= 15.5 K T
×25
×40
×5
×50 0.04
0.004 -0.04
-0.004
×17 experiment
theory
#A
= 4.2 K T f= 0.69 THz
FIG. 2. σxx/σxx as a function ofω/ωc. The green line in (a) is a fit of the low-B tail of the oscillations using Eq. (1) with aB-independent A =A∞ [44]. Such fit yields Aexpt.∞ =0.056 in agreement with theory [52] yielding Atheor∞ ∼0.04. The monotonic part ofσxx/σxx in panel (a) is subtracted. Data for >2.5 are magnified by the factors shown in the panels.
show nearly no helicity dependence. By contrast, transmission, displayed in the inset in Fig.1(a), strongly depends on helicity.
CR for positive B occurs only for right-handed circular polarization and vice versa. Indeed, in agreement with the theory of CR [46], the transmitted power drops nearly to zero for the cyclotron resonance active configuration (CRA), whereas the signal for the opposite helicity, i.e., for the inactive configuration (CRI), is almost B independent. Active and inactive helicity interchange for negative magnetic fields (not shown). Note that the detected polarization behavior and the shape of transmittance minimum are well fitted by taking multiple reflections in the substrate and superradiant decay into account [47–50] (see solid lines in the inset of Fig.1(a)and the Supplemental Material [35]). To demonstrate that the weak polarization dependence of the MIRO oscillations is not caused by saturation effects we measured σxx at different power levels. These data show [35] that the signal scales linearly with power and reducing the power by ten times does not change the ratio between CRA and CRI signals. The overall same results are obtained forf =1.63 THz [35]. The only differences are the signal magnitude and rescaledB-field positions of CR and oscillations.
The results shown in Figs.1and2are obtained for Corbino disks with an outer diameter 3 mm, thus being of the order of the laser spot size. To exclude possible effects stemming from irradiation of the contacts’ edges we carried out measurements on disks with 8.5 mm diameter, i.e., significantly larger than the spot size. These samples are indicated by a subscript L in the sample index. Figures3(a)and3(b)show that the oscillations can be efficiently excited without THz irradiation of the
)stinu .bra(σΔxx10
-5 0
1 2 3 4 c
0 5
CRA CRI
x(mm) 0 1 2 3
)stinu .bra( edutilpmA
1 0.8 0.6 0.4 0.2 0 x
y 0
(a)
(b)
(c)
= 3 transmittance= 4
#A
= 4.2 K T L
#DL1
#A
4.25 mm r =O
L
cc 4 2
r =O 4.25 mm rO
f= 0.69 THz T= 4.2 K T= 4.2 K 10
-10 0
FIG. 3. σxxas a function of ω/ωc for large size samples AL (a) and DL1(b) with a metal mask (gray square) preventing irradiation of contacts. (c) Oscillation amplitude as a function of the laser spot position for sample covered by a metal mask with a slit (see inset).
The beam is scanned along the slit from bulk regions of the Corbino disk onto the outer contact area. The solid line shows the transmission signal measured simultaneously with the oscillations.
contacts. We measured the photoconductivity under irradiation of the sample through a hole in a metal mask covering the contacts. The mask was mounted at a distance ≈1 mm from the sample surface [see inset in Fig.3(a)]. Furthermore, we removed a part of the metal screen and scanned the beam across the edge [see inset in Fig. 3(c)]. Figure 3(c) shows that the signal decreases as the laser beam approaches the edge, demonstrating that the oscillation amplitude just follows the decrease in absorbed radiation power. Hence, the data directly show that oscillations are dominated by bulk effects in 2DES and, at least in the THz range, do not come from the edge phenomena such as ponderomotive forces excited by contacts/edge illumination [29] or radiation- induced modification of the edge transport [30]. Importantly, the polarization dependence of the oscillations remains weak for any position of the laser spot including both geometries, where the contacts are avoided and where the beam is focused on the edge. This is illustrated in Fig.4, where the ratios of the oscillation amplitude for CRA and CRI configurations are
1 3 4
0 9
1 3 5 7
T= 4.2 K 1
2 5
2 3 4 00
1 2
T= 15 K 3
c
A/ ACRACRI
A/ ACRACRI
Γ=0
Γ=0.36 Γ=0.19
#AL
#A
#D
#B
#C
#DL2
#DL1
f= 0.69 THz
f= 0.69 THz
#E
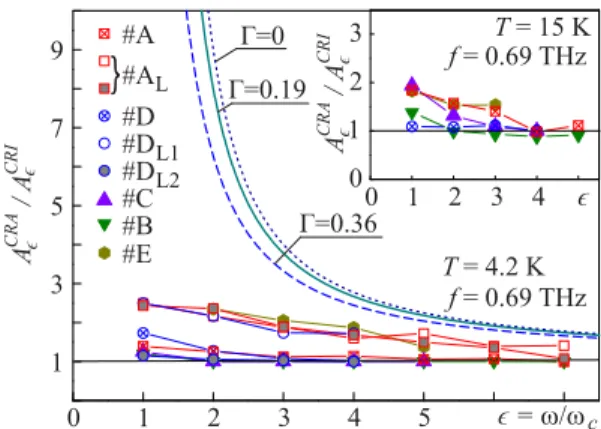
FIG. 4. ACRA/ACRIvs for all samples. For sample ALit is shown for the laser focused in between the contacts (open squares) and onto the edge of the outer Corbino contact (solid squares). DL1and DL2
are large samples made from the same wafer. Lines are calculated using Eq. (3) for=0.19 and 0.36 corresponding to samples A and D, respectively.
shown as a function ofω/ωc. In all cases and especially for low oscillation indices the experimental CRA/CRI ratio is always much smaller than the calculated one, shown for different radiative decay(discussed below) in Fig.4. The finding that the THz-induced oscillations depend only weakly on helicity is in line with the results of Smetet al., who examined MIROs at MW frequencies [7].
Now we discuss the results within the inelastic [6,51,52]
and the displacement [53–57] mechanisms, which ascribe the magneto-oscillations of the PC to radiation-assisted scattering between disorder-broadened Landau levels. This theory is a nonequilibrium extension of linear transport theory in high Landau levels [58], and accounts for both real-space displacements of electron orbits in individual photon-assisted scattering events (displacement contribution) and associated nonequilibrium occupation of electronic states within the disorder-broadened Landau levels (inelastic contribution).
Within this theory the conductivity oscillations are given by [59]
σxx/σxx = − A sin(2π ) exp(−α ), (1) where the exponential damping withα=2π/ωτqcorresponds to the dirty limitωcτq 1 of strongly overlapping Landau levels. Importantly, the factorA becomesB independent for
=ω/ωc1. Fitting the low-Bdata in Fig.2(a)using Eq. (1) with constant A∞=A | →∞ reveals that the experimental oscillation amplitude, Aexpt.∞ =0.056, agrees well with the theoretical predictions for the inelastic mechanism [52], Atheor∞ ∼0.04 (see [44] and the Supplemental Material [35]).
This shows, in particular, that σxx follows the n3e/ω4 dependence predicted for a dominant inelastic mechanism. In accordance with Eq. (1), the number of resolved oscillations for all samples in Fig.2 is roughly equal toωτq/2. Hereτq
are taken from the analysis of SdH oscillations (see TableI).
This highlights the important role ofτq in the appearance of oscillations and explains why at THz frequencies they can be observed in samples with relatively low mobility.
While the inelastic mechanism of MIRO describes the experimental findings for large ω/ωc quite well, it cannot explain the weak polarization dependence measured for ω/ωc5. In theory, the polarization dependence of σxx follows the absorbanceK=σxx(±)(ω)E±2/2, where σxx(±)(ω) is the dissipative part of the linear dynamic conductivity, E± is the amplitude of the screened radiation electric field, and +(−) labels the CRI (CRA) configuration [60,61]. Although the magneto-oscillations inσxxare of quantum origin, their polarization dependence stems from Drude theory [62,63] and reflects the classical dynamics of 2DES in crossed magnetic fieldBand electric field of the THz wave, yielding [46]
A ∝K ∝ E±2
(1± |ωc|/ω)2+γ2, γ =1/ωτp 1. (2) In order to relateE±, acting on the electrons in 2DES, to the electric field E±(0) of the incoming wave, one needs to take into account both the dynamical screening by the 2DES and multiple reflections within the dielectric substrate (Fabry- Perot interference). The former is dominated by the Hall part σxy(±)(ω) of the dynamic conductivity and is described by the superradiant decay rate=e2ne/2ω 0mcγ [47–50]. The
effect of the dynamical screening is most simply expressed in the case of constructive Fabry-Perot interference [64]: the absorbance still has the form of Eq. (2) whereE±get replaced byE±(0)andγ by (+γ). Then, sinceγ, the ratio of the CRA and CRI absorption coefficient and oscillation amplitude is given by
KCRA
KCRI =ACRA
ACRI (1+ |ωc|/ω)2+2
(1− |ωc|/ω)2+2. (3) Note that the value ofis fully determined byneandmknown precisely from independent measurements. Taking multiple reflections into account (see Supplemental Material [35]), the transmission data for CRA and CRI polarization can be perfectly fitted using the above expression for[see inset in Fig. 1(a)]. In Fig. 4 we present the ratio (3) calculated for different samples. The smallestACRA/ACRI value is obtained for the largest , in our case =0.36 for sample D with the largest carrier densityne=2.4×1012cm−2(see dashed line in Fig. 4). Clearly, for low harmonics ω/ωc5, the theoretical predictions forACRA/ACRI strongly deviate from
the experimental data in Fig. 4. Unreasonably high values of1.5 would be needed to match experiment. For higher harmonics, however, i.e., forω/ωc5,ACRA/ACRI →1 both in theory and experiment. As detailed in the Supplemental Material [35], the data in this low-B region are in good quantitative agreement with theory.
To summarize, our experiments provide clear evidence that MIRO oscillations in the THz regime are excited in the “bulk”
of 2DES and not at contacts/sample boundaries. In the THz range they are also observed at much lower mobilities of the 2DES as compared to the MW regime suggesting that they appear atωτq−1. Although at high harmonics of the cyclotron resonance the observed MIRO oscillations are well described by the inelastic mechanism [52], their polarization dependence at low harmonics is at odds with any existing theoretical description of MIRO.
ACKNOWLEDGMENTS
Financial support via the German Science Foundation DFG, the Volkswagen Stiftung Program, RFBR (N 14-02-01246), and RAS is gratefully acknowledged.
[1] M. A. Zudov, R. R. Du, J. A. Simmons, and J. L. Reno, Phys. Rev. B64,201311(R)(2001).
[2] P. D. Ye, L. W. Engel, D. C. Tsui, J. A. Simmons, J. R. Wendt, G. A. Vawter, and J. L. Reno, Appl. Phys. Lett. 79, 2193 (2001).
[3] R. G. Mani, J. H. Smet, K. von Klitzing, V. Narayanamurti, W. B.
Johnson, and V. Umansky,Nature (London)420,646(2002).
[4] M. A. Zudov, R. R. Du, L. N. Pfeiffer, and K. W. West, Phys. Rev. Lett.90,046807(2003).
[5] C. L. Yang, M. A. Zudov, T. A. Knuuttila, R. R. Du, L. N.
Pfeiffer, and K. W. West,Phys. Rev. Lett.91,096803(2003).
[6] S. I. Dorozhkin,JETP Lett.77,577(2003).
[7] J. H. Smet, B. Gorshunov, C. Jiang, L. Pfeiffer, K. West, V. Umansky, M. Dressel, R. Meisels, F. Kuchar, and K. von Klitzing,Phys. Rev. Lett.95,116804(2005).
[8] I. A. Dmitriev, A. D. Mirlin, D. G. Polyakov, and M. A. Zudov, Rev. Mod. Phys.84,1709(2012).
[9] D. Weiss, K. von Klitzing, K. Ploog, and G. Weimann,Europhys.
Lett.8,179(1989).
[10] A. V. Andreev, I. L. Aleiner, and A. J. Millis,Phys. Rev. Lett.
91,056803(2003).
[11] I. A. Dmitriev, M. Khodas, A. D. Mirlin, and D. G. Polyakov, Phys. Rev. Lett.111,206801(2013).
[12] S. I. Dorozhkin, V. Umansky, L. N. Pfeiffer, K. W. West, K.
Baldwin, K. von Klitzing, and J. H. Smet,Phys. Rev. Lett.114, 176808(2015).
[13] M. A. Zudov,Phys. Rev. B92,047301(2015).
[14] S. A. Mikhailov,Phys. Rev. B92,047302(2015).
[15] Q. Shi, M. Khodas, A. Levchenko, and M. A. Zudov,Phys. Rev.
B88,245409(2013).
[16] A. D. Levin, Z. S. Momtaz, G. M. Gusev, and A. K. Bakarov, Phys. Rev. B89,161304(R)(2014).
[17] S. Chakraborty, A. T. Hatke, L. W. Engel, J. D. Watson, and M. J. Manfra,Phys. Rev. B90,195437(2014).
[18] Q. Shi, P. D. Martin, A. T. Hatke, M. A. Zudov, J. D. Watson, G. C. Gardner, M. J. Manfra, L. N. Pfeiffer, and K. W. West, Phys. Rev. B92,081405(R)(2015).
[19] A. D. Levin, Z. S. Momtaz, G. M. Gusev, O. E. Raichev, and A. K. Bakarov,Phys. Rev. Lett.115,206801(2015).
[20] A. A. Bykov, I. S. Strygin, A. V. Goran, A. K. Kalagin, E. E.
Rodyakina, and A. V. Latyshev,Appl. Phys. Lett.108,012103 (2016).
[21] S. A. Studenikin, A. S. Sachrajda, J. A. Gupta, Z. R. Wasilewski, O. M. Fedorych, M. Byszewski, D. K. Maude, M. Potemski, M.
Hilke, K. W. West, and L. N. Pfeiffer,Phys. Rev. B76,165321 (2007).
[22] M. A. Zudov, O. A. Mironov, Q. A. Ebner, P. D. Martin, Q. Shi, and D. R. Leadley,Phys. Rev. B89,125401(2014).
[23] Q. Shi, Q. A. Ebner, and M. A. Zudov,Phys. Rev. B90,161301 (2014).
[24] R. Yamashiro, L. V. Abdurakhimov, A. O. Badrutdinov, Yu. P.
Monarkha, and D. Konstantinov,Phys. Rev. Lett.115,256802 (2015).
[25] D. F. Karcher, A. V. Shchepetilnikov, Yu. A. Nefyodov, J. Falson, I. A. Dmitriev, Y. Kozuka, D. Maryenko, A. Tsukazaki, S. I.
Dorozhkin, I. V. Kukushkin, M. Kawasaki, and J. H. Smet, Phys. Rev. B93,041410(R)(2016).
[26] Y. M. Beltukov and M. I. Dyakonov, Phys. Rev. Lett. 116, 176801(2016).
[27] V. A. Volkov and A. A. Zabolotnykh,Phys. Rev. B89,121410(R) (2014).
[28] O. V. Zhirov, A. D. Chepelianskii, and D. L. Shepelyansky, Phys. Rev. B88,035410(2013).
[29] S. A. Mikhailov,Phys. Rev. B83,155303(2011).
[30] A. D. Chepelianskii and D. L. Shepelyansky,Phys. Rev. B80, 241308(R)(2009).
[31] T. Ye, H.-C. Liu, Z. Wang, W. Wegscheider, and R. G. Mani, Sci. Rep.5,14880(2015).
[32] A. Wirthmann, B. D. McCombe, D. Heitmann, S. Holland, K. J.
Friedland, and Can-Ming Hu,Phys. Rev. B76,195315(2007).
[33] Z. D. Kvon, D. A. Kozlov, S. N. Danilov, C. Zoth, P. Vierling, S. Stachel, V. V. Bel’kov, A. K. Bakarov, D. V. Dmitriev, A. I.
Toropov, and S. D. Ganichev,JETP Lett.97,41(2013).
[34] R. G. Mani, A. N. Ramanayaka, Tianyu Ye, M. S. Heimbeck, H. O. Everitt, and W. Wegscheider,Phys. Rev. B87,245308 (2013).
[35] See Supplemental Material athttp://link.aps.org/supplemental/
10.1103/PhysRevB.94.081301for the details of the transmission data analysis, comparison of experimental results for MIRO- like oscillations with the theory of inelastic mechanism, linear magnetotransport data, and additional results on THz radiation- induced resistance oscillations.
[36] S. D. Ganichev, S. A. Tarasenko, V. V. Bel’kov, P. Olbrich, W. Eder, D. R. Yakovlev, V. Kolkovsky, W. Zaleszczyk, G.
Karczewski, T. Wojtowicz, and D. Weiss,Phys. Rev. Lett.102, 156602(2009).
[37] S. D. Ganichev, I. N. Yassievich, W. Prettl, J. Diener, B. K.
Meyer, and K. W. Benz,Phys. Rev. Lett.75,1590(1995).
[38] P. Olbrich, C. Zoth, P. Lutz, C. Drexler, V. V. Bel’kov, Ya. V.
Terent’ev, S. A. Tarasenko, A. N. Semenov, S. V. Ivanov, D. R.
Yakovlev, T. Wojtowicz, U. Wurstbauer, D. Schuh, and S. D.
Ganichev,Phys. Rev. B86,085310(2012).
[39] S. D. Ganichev,Physica B273-274,737(1999).
[40] E. Ziemann, S. D. Ganichev, I. N. Yassievich, V. I. Perel, and W. Prettl,J. Appl. Phys.87,3843(2000).
[41] S. D. Ganichev and W. Prettl,Intense Terahertz Excitation of Semiconductors(Oxford University Press, Oxford, 2006).
[42] V. V. Bel’kov and S. D. Ganichev,Semicond. Sci. Technol.23, 114003(2008).
[43] P. Olbrich, E. L. Ivchenko, R. Ravash, T. Feil, S. D. Danilov, J. Allerdings, D. Weiss, D. Schuh, W. Wegscheider, and S. D.
Ganichev,Phys. Rev. Lett.103,090603(2009).
[44] In our experiments, the positions of the nodes deviate a bit from the integer values of being established in both theory and previous MW measurements [45,8]. Accordingly, the data is fitted using Eq. (1) with sin(2π ) replaced by sin(2π[ + 0]).
The small shifts 0varying from sample to sample both in sign and magnitude (see Supplemental Material [35]) are likely to be of instrumental origin and should be disregarded. In Fig.2(a),
0= −0.09.
[45] R. G. Mani, J. H. Smet, K. von Klitzing, V. Narayanamurti, W. B. Johnson, and V. Umansky,Phys. Rev. Lett.92,146801 (2004).
[46] K. Seeger,Semiconductor Physics: An Introduction(Springer, New York, 2004).
[47] G. Abstreiter, J. P. Kotthaus, J. F. Koch, and G. Dorda,Phys.
Rev. B14,2480(1976).
[48] K. W. Chiu, T. K. Lee, and J. J. Quinn,Surf. Sci. 58, 182 (1976).
[49] S. A. Mikhailov,Phys. Rev. B70,165311(2004).
[50] Qi Zhang, T. Arikawa, E. Kato, J. L. Reno, Wei Pan, J. D.
Watson, M. J. Manfra, M. A. Zudov, M. Tokman, M. Erukhi- mova, A. Belyanin, and J. Kono,Phys. Rev. Lett.113,047601 (2014).
[51] I. A. Dmitriev, A. D. Mirlin, and D. G. Polyakov,Phys. Rev.
Lett.91,226802(2003).
[52] I. A. Dmitriev, M. G. Vavilov, I. L. Aleiner, A. D. Mirlin, and D. G. Polyakov,Phys. Rev. B71,115316(2005).
[53] V. I. Ryzhii, Sov. Phys. - Solid State11, 2078 (1970).
[54] V. I. Ryzhii, R. A. Suris, and B. S. Shchamkhalova, Sov. Phys.
- Semicond.20, 1299 (1986).
[55] A. C. Durst, S. Sachdev, N. Read, and S. M. Girvin,Phys. Rev.
Lett.91,086803(2003).
[56] M. G. Vavilov and I. L. Aleiner, Phys. Rev. B 69, 035303 (2004).
[57] M. Khodas and M. G. Vavilov, Phys. Rev. B 78, 245319 (2008).
[58] T. Ando, A. B. Fowler, and F. Stern,Rev. Mod. Phys.54,437 (1982).
[59] I. A. Dmitriev, M. Khodas, A. D. Mirlin, D. G. Polyakov, and M. G. Vavilov,Phys. Rev. B80,165327(2009).
[60] Note that in the case of linearly polarized ac field, the displacement mechanism yields an additional contribution to photoconductivity sensitive to the relative orientation of the ac and dc fields. While polarization sensitivity of this kind has been studied in [61,31], unambiguous observation of this displacement contribution remains a challenging task.
[61] R. G. Mani, A. N. Ramanayaka, and W. Wegscheider,Phys. Rev.
B84,085308(2011).
[62] The same polarization dependence is expected for nonequilib- rium magneto-oscillations caused by classical memory effects [26,63].
[63] I. A. Dmitriev, A. D. Mirlin, and D. G. Polyakov,Phys. Rev. B 70,165305(2004).
[64] Equation (3) is written for the constructive Fabry-Perot interfer- ence inside the dielectric substrate, in which case the broadening of the CR is maximized. In other conditions the ratioACRA/ACRI can only increase (see Supplemental Material [35]).