Fine structure of high-power microwave-induced resistance oscillations
Q. Shi,1M. A. Zudov,1I. A. Dmitriev,2,3,4,*K. W. Baldwin,5L. N. Pfeiffer,5and K. W. West5
1School of Physics and Astronomy, University of Minnesota, Minneapolis, Minnesota 55455, USA
2Department of Physics, University of Regensburg, 93040 Regensburg, Germany
3Max Planck Institute for Solid State Research, 70569 Stuttgart, Germany
4Ioffe Physical Technical Institute, 194021 St. Petersburg, Russia
5Princeton University, Department of Electrical Engineering, Princeton, New Jersey 08544, USA (Received 19 September 2016; published 20 January 2017)
We report on observation of a fine structure of microwave-induced resistance oscillations in an ultraclean two-dimensional electron gas. This fine structure is manifested by multiple secondary sharp extrema, residing beside the primary ones, which emerge at high radiation power. Theoretical considerations reveal that this fine structure originates from multiphoton-assisted scattering off short-range impurities. Unique properties of the fine structure allow us to access all experimental parameters, including microwave power, and to separate different contributions to photoresistance. Furthermore, we show that the fine structure offers a convenient means to quantitatively assess the correlation properties of the disorder potential in high-quality systems, allowing separation of short- and long-range disorder contributions to the electron mobility.
DOI:10.1103/PhysRevB.95.041403
When a two-dimensional electron gas (2DEG) is exposed to microwave radiation and weak perpendicular magnetic field B, the magnetoresistance acquires prominent 1/B-periodic oscillations [1,2] which give rise to zero-resistance states [3–13] when the resistivity at the minima approaches zero [14].
These oscillations, termed microwave-induced resistance os- cillations (MIRO), are usually [15–20] attributed to the effect of Landau quantization on the radiation-assisted scattering off impurities. This affects the transport properties both directly (displacement mechanism [21–26]) and indirectly through the emergence of a nonequilibrium electron distribution function oscillating with energy (inelastic mechanism [6,27,28]). The resulting photoresistivity δρω oscillates with the ratio = ω/ωcof the microwave frequencyω=2πf to the cyclotron frequencyωc=eB/m(mis the electron effective mass) [29],
δρω ρD
= −λ2ηP2π sin(2π ), (1) where ρD is the Drude resistivity, η (specified below) is a dimensionless coefficient describing the combined strength of the displacement and inelastic contributions, P is the dimensionless microwave power, and λ=exp(−/2f τq) is the Dingle factor. In the expression forλ(λ1), describing the amplitude of weak oscillations in the density of states due to Landau quantization, τq−1=τq0−1+τin−1(T) is the “total”
quantum scattering rate including contributions from both the temperature- (T-) independent disorder andT-dependent electron-electron scattering (τq0−1andτin−1, respectively) to the Landau level broadening [25,29].
Equation (1), applicable in the regime of low power,P 1, and overlapping Landau levels,λ1, well describes MIRO measured in many experiments [14]. It has been demonstrated that under stronger microwave radiation, P 1, the oscil- lation amplitude undergoes a crossover to sublinear power dependence [30]. Concomitantly, the oscillation extrema move closer to the nodes at integer[30]. Such behavior is expected
*Corresponding author: ivan.dmitriev@physik.uni-regensburg.de
from theory [24,28,30] which attributes the nonlinear-in-P corrections to multiphoton processes and/or to modification of thermalization rate.
In this Rapid Communication, we report on a fine structure of MIRO which emerges under intense low-frequency mi- crowave irradiation in an ultraclean 2DEG. This fine structure is manifested by additional (“secondary”) sharp extrema residing besides the primary ones. Following theoretical framework of Ref. [30], we demonstrate that this fine structure originates from multiphoton-assisted scattering off short-range impurities, which are inherently present even in ultrahigh mobility 2DEG. The properties of fine structure enable us to determine the microwave power seen by our 2DEG and to single out different photoresistance contributions, which has not been possible before [31]. The fine structure can also potentially be used as a tool to separate sharp and smooth disorder components of the electron mobility which is a subject of intense current interest but is difficult to achieve by conventional techniques [32–35].
The data presented below were obtained from a∼4 ×4 mm square sample cleaved from a heterostructure containing a symmetrically modulation-doped, 30-nm-wide GaAs/AlGaAs quantum well. A brief illumination with a light-emitting diode resulted in an electron density n≈3.0×1011 cm−2 and a mobility μ≈3.1×107 cm2/Vs (transport relaxation time τ ≈1.2 ns). The microwave radiation from the signal gener- ator was delivered to the sample via a rectangular waveguide at various powers spanning two orders of magnitude. The longitudinal resistance was measured using low-frequency lock-in amplification under continuous microwave irradiation at a pumped liquid helium bath temperature ofT ≈1.35 K.
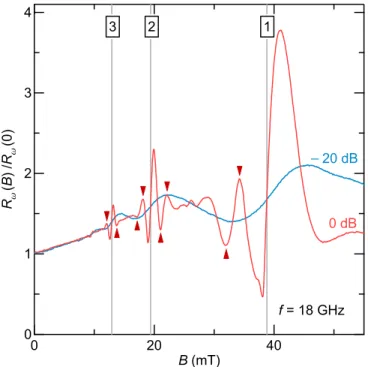
In Fig.1, we present the longitudinal magnetoresistance normalized to its zero-field value Rω(B)/Rω(0), recorded under microwave radiation of frequency f =18 GHz for two different power levels corresponding to 0 and−20 dB attenuation, as marked. Vertical lines, marked by=1,2,3, correspond to cyclotron resonance harmonics characterized by vanishing photoresponse. At low power (PdB= −20 dB), we observe smooth MIRO exhibiting the conventional damped
FIG. 1. Longitudinal magnetoresistance normalized to its zero- field valueRω(B)/Rω(0), measured atf =18 GHz for two different power levels corresponding to an attenuationPdB=0 and−20 dB.
Vertical lines mark=1, 2, 3. Secondary extrema are marked by triangles.
sinelike waveform, as prescribed by Eq. (1). In contrast, the data at the maximum power Pmax (PdB =0 dB) reveal a very rich and unusual waveform highlighted by multiple additional sharp features around each node at=N =1,2,3.
The “secondary extrema,” whose positions are marked by triangles, lie roughly symmetrically around each node and have an amplitude comparable to the primary extrema closest to the nodes. Although less pronounced, similar fine structure was observed at other frequencies [36].
In Fig. 2, we plot the measured photoresistance (solid lines) normalized to the zero-field resistance without radiation, δRω/R0, as a function of at different powers. Here, we focus on structures around=2 and 3 where Landau levels strongly overlap, λ1. The high- and low-power regimes are illustrated in Figs.2(a)and2(b), respectively. A gradual transition between the two distinct waveforms shown in Fig.1 is apparent. With decreasing power, secondary extrema move away from integer . Their amplitude decreases until they disappear at PdB∼ −8 dB (−8 dB corresponds to PP∗
specified below). This behavior clearly distinguishes the observed fine structure from the fractional MIRO [37–41]:
distinct features in the photoresponse around certain rational =12,13,32, etc., characteristic for the regime of well-separated Landau levels [42,43] and the crossover regimeωcτq∼1 [40].
At still lower power [Fig.2(b)] the positions of the primary extrema still move away from the nodes and finally saturate at =N±1/4 consistent with Eq. (1).
We now turn to a quantitative analysis of the re- sults within the quantum kinetic framework developed in Refs. [24,26,28,30,44,45]. For arbitrary microwave powerP and forλ1, the general expression for the photoresponse
FIG. 2. Measured (solid lines) and calculated (dotted lines) photoresistance normalized by the zero-field resistance without radiationδRω/R0, as a function ofat different power attenuations:
from 0 to −8 dB (a) and from −12 to −20 dB (b), in −2 dB steps. The parameters of disorder used in calculation areτ=1.2 ns, τsh=1.7 ns, andτsm=75 ps.
reads as [30]
δρω
ρD
=λ2(Fdis+Fin), (2) with the displacement and inelastic terms given by
Fdis=τ ∂[γ¯(ξ)]−1, Fin= 2τγ¯(ξ)∂γ(ξ)
τin−1+γ(0)−γ(ξ), (3) where ξ =2√
Psinπ . Aiming at a realistic description of elastic scattering in high-mobility 2DEGs with a minimal number of parameters, we use a two-component disorder model [44], with its sharp (smooth) component being weakly (strongly) correlated at the scale of the Fermi wavelength.
Within this model, γ(ξ)= J02(ξ)
τsh + 1 τsm
1
(1+χ ξ2)1/2 , (4a)
¯
γ(ξ)= 1 τsh
J02(ξ)−J12(ξ) + χ
τsm
1−χ ξ2/2
(1+χ ξ2)5/2, (4b) whereτsh−1andτsm−1(τsm−1τsh−1) characterize the strength of sharp and smooth disorder, respectively, while χ1/21 is the typical scattering angle off smooth disorder. Here, the smooth component describes the potential of remote ionized donors. It dominates in the quantum rate:τq0−1≡γ(0)=τsm−1+ τsh−1τsm−1. In turn, the short-range component accounts for residual impurities in close proximity to the 2DEG [46]
which can contribute significantly to the momentum relaxation rateτ−1≡γ¯(0)=χ τsm−1+τsh−1. This model was successfully employed to describe related nonequilibrium effects in the
presence of strong dc excitation [26,44,47–52]. With ¯γ given by Eq. (4b), the displacement termFdis=Fdis(sh)+Fdis(sm) entering Eq. (2) naturally divides into the “sharp” (∝τsh−1) and
“smooth” (∝τsm−1) parts, while forFin such separation is not possible.
As argued below, the fine structure in Figs. 1 and 2 originates from the sharp-disorder displacement contribution
Fdis(sh)= − τ
τshπ cot(π )ξ J1(ξ)[J2(ξ)−3J0(ξ)]. (5) The expression involving Bessel functions oscillates with ξ [53]. Neglecting other contributions, for Psin−2(π ) (ξ 1) one thus obtains
δρω
ρD 4λ2 τ
τshcot(π ) cos(4√
Psinπ ). (6) Equations (5) and (6) predict that, with increasingP, more and more secondary extrema should show up in the photoresponse and, once present, each extremum should move towards the nearest node. The sensitivity of the extrema positions to microwave power thus offers a unique opportunity to quantitatively access P sensed by our 2DEG. Indeed, the positions of principal secondary extrema are given by ξ = 2√
Psinπ ±2.9. Such scaling is observed in our data shown in Fig.2and the analysis using Eq. (5) forPdB>−8 dB yields P 15P /Pmax. We also notice that the secondary extrema are expected to emerge at P >P∗=1.452∼2.1 (as follows from|ξ|2.9 and|sinπ |1). In accord with this estimate, the fine structure in Fig.2 becomes visible at PdB = −8 dB which corresponds toP 2.4.
Having obtainedP as a function of power attenuation, we turn to examination of the data at low power, where Eqs. (2)–(4) reduce to the linear-in-P Eq. (1) with
η≡ηin+ηsh+ηsm=2τin
τ + 3τ
2τsh +6χ2τ
τsm . (7) The inelastic lifetime can be estimated as τin(T) (EF/T2) ln−1(aBvF/2), where EF and vF denote the Fermi energy and velocity, =max{T /,ω3/2c τ1/2}, and aB10 nm is the effective Bohr radius [28]. At the coolant temperatureT0=1.35 K, we obtainτin120 ps (at∼2).
On the other hand, the Dingle analysis of the lowest power photoresistance (PdB= −20 dB) yields the quantum lifetime τq≈46 ps comparable to the estimate for τin. Sinceτq−1= τq0−1+τin−1, the contribution of electron-electron scattering to the Landau level broadening should be taken into account, wherefrom we obtainτsmτq0 75 ps. We then model the lowest-P photoresistance trace using Eqs. (1) and (7), with τ/τsh being the only adjustable parameter (note that χ can be found fromτ/τsh+χ τ/τsm =1 for a given τ/τsh,τ, and τsmτq0). A dotted line, computed using τ/τsh =0.7, is virtually indistinguishable from the experimental trace [54].
From this analysis we conclude that MIRO at low P are dominated by the displacement term associated with the sharp disorder componentηsh1.05,ηin 0.2, andηsm0.03.
With a knowledge of τ/τsh, we can now compute the photoresistance using Eqs. (2)–(4) for all other power levels.
The results, presented by dotted lines in Fig.2, demonstrate excellent agreement at allPdB, accurately capturing the fine
FIG. 3. (a) Extracted quantum scattering rate 1/τqvs normalized powerP /Pmax. (b) SlopeSN, obtained from the data, as a function ofP /Pmax, on a log-log scale, forN =1 (circles), 2 (squares), and 3 (triangles).
structures observed at higher intensities. This supports the previous analysis and confirms that the detected fine structure of MIRO originates from the multiphoton-assisted scattering by short-range impurities as described by Eqs. (5) and (6).
Apart from the known microwave power, the only parameter which was allowed to vary while generating theoretical curves in Fig.2was the electron temperature, to account for electron heating by high-power microwaves. Sinceτin∼τqτ ∼τsh, we expect that heating affects primarily the quantum scattering rate entering the Dingle factor. The prefactorη, on the other hand, is affected only slightly, as it is dominated byηsh. Our analysis reveals thatτqinitially stays constant atτq(T0)≈46 ps but eventually decreases toτq(Tmax)≈32 ps atP =Pmax[see Fig.3(a)]. Usingτin(T0)=0.12 ns andτin∝T−2, we obtain Tmax1.7 K andτin(Tmax)0.5τin(T0).
We confirm the effect of heating by analyzing the slope
∂(δρω/ρD) of the MIRO signal at integer=N =1,2, . . .. According to Eqs. (2)–(4), the photoresponse near integer should remain linear inPat arbitrary power, as long asλand ηremainPindependent. The slope is most easily found from Eq. (1):
SN ≡∂(δρω/ρD)|=N −4π2N ηPλ2. (8) Figure3(b)demonstrates that the slopeSN, obtained from our data at=N =1,2,and 3, indeed increases linearly with power up toP ≈1.5 (P /Pmax≈0.1) but tends to saturate or even decrease at higherP. Deviations at higherP become progressively stronger for larger N, confirming that ηin η[54] so that heating of electrons primarily affectsτqentering λ2=exp(−N/f τq).
We now summarize our analysis procedure. We first extract Pfrom the position of the satellite extrema observed at higher powers and then find otherPusing known attenuation factors.
Next, by doing standard Dingle analysis on the low-power data [Eq. (1)], we obtain the quantum lifetimeτq. Using the inelastic
FIG. 4. (a) CalculatedFdis(sh)(marked as “sh”),Fdis(sm)(“sm”),Fin
(“in”), and their sumFtot(“tot”) vs, forτ/τsh=0.7,τin/τ=0.05, χ=0.018, andP=15. (b) The same forτ/τsh=0.3,τin/τ=2, χ=0.042, andP =15.
rateτinfrom theoretical estimates, the scattering rate of smooth disorder is obtained as 1/τsm=1/τq−1/τin. We then fit the low-power photoresistance with Eqs. (1) and (7), leavingτ/τsh as the only fitting parameter. The photoresistance with fixed τsh andτsm is then calculated for all power levels, with the only parameter allowed to vary with power being the electron temperature. We use the slope of photoresistance at integer as a crosscheck, to confirm that the inelastic contribution is small and that the primary effect of heating is the suppression ofτq.
Figure 4(a) illustrates the behavior of the subleading contributionsFdis(sm) and Fin which are largely irrelevant for the conditions of our experiment but can strongly affect the photoresponse in other parametric regimes. The contributions Fdis(sh), Fdis(sm), and Fin are plotted with the above parameters found forP =Pmax, together with their sumFtot=Fdis+Fin
entering Eq. (2). Here, bothFdis(sm)andFinare small compared to Fdis(sh). The large sharp disorder component produces a pronounced fine structure in the inelastic term similar to Fdis(sh). Apart from being small due toτin/τ 1,Fin exhibits different positions of the secondary extrema and decays faster than Fdis(sh) for ξ 1. Figure 4(b) illustrates the parametric regime when the inelastic time is large, τin/τ =2, while the transport rate is dominated by the smooth component of disorder χ τ/τsm=0.7 (to keepτq0 τsm unchanged, we use χ=0.042). Here, smooth disorder washes out the fine structure inFinwhich dominates the photoresponse. Despite still significant contribution of sharp disorder to the transport rate 1/τ,τ/τsh=0.3, in this parametric regime the resulting
fine structure inFdis(sh)is hardly visible on top of stronger, yet featureless, contribution ofFdis(sm)+Fin.
According to the above theory, a sufficiently strong short- range disorder component is crucial for the observation of the fine structure. Apart from that, we have seen that the photoresponse is affected by detrimental heating effects which, in principle, can exponentially suppress MIRO at microwave intensities still insufficient to detect the fine structure. To avoid excess heating, it is therefore desirable [36] to employ lower radiation frequencies as P∼f−4. Using lower f, however, inevitably pushes MIRO to lower B which calls for samples with long quantum lifetimes. In addition, high transport mobility is also desirable since it helps to reduce both the heating effects and the inelastic contribution, which otherwise could overwhelm the MIRO signal and mask the fine structure. Finally, a nonuniformity of the microwave field across the sample may also smear out the fine structure, leaving exclusively the inhomogeneously broadened primary extrema in the observed averaged signal.
In summary, we have observed and investigated high- intensity MIRO exhibiting multiple satellite oscillations. This fine structure is qualitatively distinct from conventional MIRO and can be quantitatively explained by theory considering multiphoton-assisted scattering by short-range impurities.
Unique properties of the fine structure enable us to estimate all experimental parameters, including radiation intensity, draw quantitative conclusions about partial contributions to microwave photoresistance, and evaluate the role of electron heating. Furthermore, fine structure offers an opportunity to quantify short- and long-range disorder contributions to the electron mobility. For our 2DEG we demonstrate that the mobility is limited by short-range disorder, which is responsible for about 70% of the transport scattering rate.
We thank M. Khodas for discussions. The work at the University of Minnesota was funded by the NSF Grant No.
DMR-1309578. The work at the University of Regensburg was funded by the German Research Foundation (DFG). The work at Princeton University was funded by the Gordon and Betty Moore Foundation through the EPiQS initiative Grant No.
GBMF4420, and by the National Science Foundation MRSEC Grant No. DMR-1420541. Preliminary measurements were performed at the National High Magnetic Field Laboratory, which is supported by NSF Cooperative Agreement No.
DMR-0654118, and by the State of Florida.
[1] M. A. Zudov, R. R. Du, J. A. Simmons, and J. L. Reno,Phys.
Rev. B64,201311(R)(2001).
[2] P. D. Ye, L. W. Engel, D. C. Tsui, J. A. Simmons, J. R. Wendt, G. A. Vawter, and J. L. Reno,Appl. Phys. Lett.79,2193(2001).
[3] R. G. Mani, J. H. Smet, K. von Klitzing, V. Narayanamurti, W. B. Johnson, and V. Umansky,Nature (London) 420, 646 (2002).
[4] M. A. Zudov, R. R. Du, L. N. Pfeiffer, and K. W. West,Phys.
Rev. Lett.90,046807(2003).
[5] C. L. Yang, M. A. Zudov, T. A. Knuuttila, R. R. Du, L. N.
Pfeiffer, and K. W. West,Phys. Rev. Lett.91,096803(2003).
[6] S. I. Dorozhkin,JETP Lett.77,577(2003).
[7] J. H. Smet, B. Gorshunov, C. Jiang, L. Pfeiffer, K.
West, V. Umansky, M. Dressel, R. Meisels, F. Kuchar, and K. von Klitzing, Phys. Rev. Lett. 95, 116804 (2005).
[8] S. I. Dorozhkin, L. Pfeiffer, K. West, K. von Klitzing, and J. H.
Smet,Nat. Phys.7,336(2011).
[9] S. I. Dorozhkin, V. Umansky, L. N. Pfeiffer, K. W. West, K.
Baldwin, K. von Klitzing, and J. H. Smet,Phys. Rev. Lett.114, 176808(2015).
[10] A. V. Andreev, I. L. Aleiner, and A. J. Millis,Phys. Rev. Lett.
91,056803(2003).
[11] A. Auerbach, I. Finkler, B. I. Halperin, and A. Yacoby,Phys.
Rev. Lett.94,196801(2005).
[12] J. Alicea, L. Balents, M. P. A. Fisher, A. Paramekanti, and L.
Radzihovsky,Phys. Rev. B71,235322(2005).
[13] I. A. Dmitriev, M. Khodas, A. D. Mirlin, and D. G. Polyakov, Phys. Rev. Lett.111,206801(2013).
[14] I. A. Dmitriev, A. D. Mirlin, D. G. Polyakov, and M. A. Zudov, Rev. Mod. Phys.84,1709(2012).
[15] MIRO were also discussed in contexts of non-Markovian memory effects [16,17], excitation of collective modes [18], and contact/edge phenomena [19,20].
[16] I. A. Dmitriev, A. D. Mirlin, and D. G. Polyakov,Phys. Rev. B 70,165305(2004).
[17] Y. M. Beltukov and M. I. Dyakonov, Phys. Rev. Lett. 116, 176801(2016).
[18] V. A. Volkov and A. A. Zabolotnykh,Phys. Rev. B89,121410 (2014).
[19] A. D. Chepelianskii and D. L. Shepelyansky,Phys. Rev. B80, 241308(2009).
[20] S. A. Mikhailov,Phys. Rev. B83,155303(2011).
[21] V. I. Ryzhii, Fiz. Tverd. Tela (Leningrad)11, 2577 (1969) [Sov.
Phys.–Solid State11, 2078 (1970)].
[22] A. C. Durst, S. Sachdev, N. Read, and S. M. Girvin,Phys. Rev.
Lett.91,086803(2003).
[23] X. L. Lei and S. Y. Liu,Phys. Rev. Lett.91,226805(2003).
[24] M. G. Vavilov and I. L. Aleiner, Phys. Rev. B 69, 035303 (2004).
[25] V. Ryzhii, A. Chaplik, and R. Suris,JETP Lett.80,363(2004).
[26] M. Khodas and M. G. Vavilov,Phys. Rev. B78,245319(2008).
[27] I. A. Dmitriev, A. D. Mirlin, and D. G. Polyakov,Phys. Rev.
Lett.91,226802(2003).
[28] I. A. Dmitriev, M. G. Vavilov, I. L. Aleiner, A. D. Mirlin, and D. G. Polyakov,Phys. Rev. B71,115316(2005).
[29] I. A. Dmitriev, M. Khodas, A. D. Mirlin, D. G. Polyakov, and M. G. Vavilov,Phys. Rev. B80,165327(2009).
[30] A. T. Hatke, M. Khodas, M. A. Zudov, L. N. Pfeiffer, and K. W.
West,Phys. Rev. B84,241302(R)(2011).
[31] S. I. Dorozhkin, A. A. Kapustin, V. Umansky, K. von Klitzing, and J. H. Smet,Phys. Rev. Lett.117,176801(2016).
[32] V. Umansky, R. de-Picciotto, and M. Heiblum,Appl. Phys. Lett.
71,683(1997).
[33] V. Umansky and M. Heiblum,Molecular Beam Epitaxy: From Research to Mass Production (Elsevier, Amsterdam, 2013), Chap. MBE growth of high-mobility 2DEG, pp. 121–137.
[34] M. J. Manfra, Annu. Rev. Condens. Matter Phys. 5, 347 (2014).
[35] S. Das Sarma and E. H. Hwang, Phys. Rev. B 90, 035425 (2014).
[36] See Supplemental Material athttp://link.aps.org/supplemental/
10.1103/PhysRevB.95.041403for data at other frequencies.
[37] M. A. Zudov,Phys. Rev. B69,041304(R)(2004).
[38] M. A. Zudov, R. R. Du, L. N. Pfeiffer, and K. W. West,Phys.
Rev. B73,041303(R)(2006).
[39] S. I. Dorozhkin, J. H. Smet, K. von Klitzing, L. N. Pfeiffer, and K. W. West,JETP Lett.86,543(2007).
[40] I. V. Pechenezhskii, S. I. Dorozhkin, and I. A. Dmitriev,JETP Lett.85,86(2007).
[41] S. Wiedmann, G. M. Gusev, O. E. Raichev, A. K. Bakarov, and J. C. Portal,Phys. Rev. B80,035317(2009).
[42] X. L. Lei and S. Y. Liu,Appl. Phys. Lett.88,212109(2006).
[43] I. A. Dmitriev, A. D. Mirlin, and D. G. Polyakov,Phys. Rev.
Lett.99,206805(2007).
[44] M. G. Vavilov, I. L. Aleiner, and L. I. Glazman,Phys. Rev. B 76,115331(2007).
[45] I. A. Dmitriev, A. D. Mirlin, and D. G. Polyakov,Phys. Rev. B 75,245320(2007).
[46] Residual impurities lead to almost isotropic scattering and are modeled as a Gaussian white-noise disorder. The restrictive con- dition on the smooth component (fulfilled in our experiments) is that the distance to remote donors should be smaller than the magnetic length.
[47] C. L. Yang, J. Zhang, R. R. Du, J. A. Simmons, and J. L. Reno, Phys. Rev. Lett.89,076801(2002).
[48] W. Zhang, H.-S. Chiang, M. A. Zudov, L. N. Pfeiffer, and K. W.
West,Phys. Rev. B75,041304(R)(2007).
[49] W. Zhang, M. A. Zudov, L. N. Pfeiffer, and K. W. West,Phys.
Rev. Lett.98,106804(2007).
[50] M. Khodas, H. S. Chiang, A. T. Hatke, M. A. Zudov, M. G.
Vavilov, L. N. Pfeiffer, and K. W. West,Phys. Rev. Lett.104, 206801(2010).
[51] S. Wiedmann, G. M. Gusev, O. E. Raichev, A. K. Bakarov, and J. C. Portal,Phys. Rev. B84,165303(2011).
[52] S. Chakraborty, A. T. Hatke, L. W. Engel, J. D. Watson, and M. J. Manfra,Phys. Rev. B90,195437(2014).
[53] In Eq. (1) and Eqs. (5)–(8), we use Fdisτ ∂γ¯(ξ) while omitting the remaining part [τγ¯(ξ)−1] which is relatively small for 2π >1. The omitted part is included in the calculated photoresponse in Figs.2and 4, and provides a nonvanishing Fdisat half-integer.
[54] We estimate a possible error in the extracted value ofτ/τsh0.7 to be∼10%. Despite the accuracy of the theoretical estimate for τincan be lower, the associated error inτ/τshis small as long as ηinηsh.