Article
Serum Chemerin Does Not Di ff erentiate Colorectal Liver Metastases from Hepatocellular Carcinoma
Susanne Feder
1, Arne Kandulski
1, Doris Schacherer
1, Thomas S. Weiss
2and Christa Buechler
1,*
1
Department of Internal Medicine I, Regensburg University Hospital, 93053 Regensburg, Germany
2
Children’s University Hospital (KUNO), Regensburg University Hospital, 93053 Regensburg, Germany
* Correspondence: christa.buechler@klinik.uni-regensburg.de; Tel.: +49-941-944-7009
Received: 31 July 2019; Accepted: 10 August 2019; Published: 12 August 2019
Abstract: The chemoattractant adipokine chemerin is related to the metabolic syndrome, which is a risk factor for different cancers. Recent studies provide evidence that chemerin is an important molecule in colorectal cancer (CRC) and hepatocellular carcinoma (HCC). Serum chemerin is high in CRC patients and low in HCC patients and may serve as a differential diagnostic marker for HCC and liver metastases from CRC. To this end, serum chemerin was measured in 36 patients with CRC metastases, 32 patients with HCC and 49 non-tumor patients by ELISA. Chemerin serum protein levels were, however, similar in the three cohorts. Serum chemerin was higher in hypertensive than normotensive tumor patients but not controls. Cancer patients with hypercholesterolemia or hyperuricemia also had increased serum chemerin. When patients with these comorbidities were excluded from the calculation, chemerin was higher in CRC than HCC patients but did not differ from controls.
Chemerin did not correlate with the tumor markers carcinoembryonic antigen, carbohydrate antigen 19-9 and alpha-fetoprotein in both cohorts and was not changed with tumor-node-metastasis stage in HCC. Chemerin was not associated with hepatic fat, liver inflammation and fibrosis. To conclude, systemic chemerin did not discriminate between CRC metastases and HCC. Comorbidities among tumor patients were linked with elevated systemic chemerin.
Keywords: alpha-fetoprotein; liver steatosis; hypertension
1. Introduction
Colorectal cancer (CRC) is the third most prevalent cancer worldwide and a leading cause of tumor-related mortality. The liver is a common site for CRC metastasis [1,2]. Hepatocellular carcinoma (HCC) typically develops in the cirrhotic liver, but about 20% arise in the non-cirrhotic liver [3].
Discrimination between secondary hepatocarcinoma and HCC may be challenging in those patients.
Clinically it is, however, highly relevant to distinguish primary and metastatic liver tumors. First, there are different therapies for patients with CRC metastases and HCC. Second, it is important to identify the primary tumor in metastatic disease [4], therefore biomarkers may be helpful in early diagnosis. Carcinoembryonic antigen (CEA) is already clinically used as diagnostic and prognostic marker in CRC [5], and systemic levels were indeed higher in secondary than primary liver tumors.
Sensitivity of serum CEA for CRC metastases was 88% and 25% for HCC [1]. Cancer antigen 19-9 (CA19-9) had a 16% sensitivity for colon cancer and a 7.7% sensitivity for HCC and could be used as an additional prognostic tool [2,6]. Alpha-fetoprotein (AFP) is a diagnostic biomarker for HCC with a low sensitivity and specificity, and thus cannot differentiate between HCC and CRC metastases [1].
Recent studies described a role of chemerin in CRC pathophysiology and diagnosis [7–9].
Chemerin is a chemoattractant protein most abundant in adipocytes and hepatocytes [10]. Chemerin is released from the cells as a biological inert molecule, which is activated by C-terminal proteolysis.
Int. J. Mol. Sci.2019,20, 3919; doi:10.3390/ijms20163919 www.mdpi.com/journal/ijms
Chemerin attracts immune cells such as macrophages and natural killer cells [11]. Moreover, chemerin regulates adipogenesis, angiogenesis and glucose metabolism [12]. Chemerin expression was reduced in a variety of cancers, and was also low in colon adenomas [13].
High plasma chemerin predicted a greater risk of CRC. Notably, this association was still significant when CRC risk factors such as age, body mass index and dietary habits were considered [8]. A second study detected higher chemerin in patients with CRC compared to healthy controls. Here, serum chemerin positively correlated with tumor-node-metastasis (TNM) stage [7]. In colon cancer patients, chemerin was increased though it was not associated with TNM classification [9]. Sytemic chemerin was further positively related to the number of adenomas in patients with colorectal adenomas [14].
Chemerin also plays a role in hepatocellular carcinoma (HCC) and low expression in the tumor was an independent prognostic factor [15]. Similarly, circulating chemerin levels were about 20-fold reduced in HCC patients [16]. Chemerin was not related to HCC prognosis [17]. Negative correlations of chemerin with Child–Pugh score, alanine aminotransferase and bilirubin demonstrated a close and negative association of serum chemerin with hepatic function in patients with liver cirrhosis [17,18].
In contrast, chronic hepatitis C patients had higher serum chemerin compared to controls, which was surprisingly negatively correlated with biopsy proven necro-inflammation [19]. Likewise, chemerin was high in men with alcohol abuse [20]. In patients with non-alcoholic steatohepatitis (NASH) serum chemerin was either induced or normal [21]. Decline of serum chemerin thus happens particularly in patients with severely impaired liver function and possibly HCC.
Obesity, hyperglycemia, dyslipidemia and hypertension are components of the metabolic syndrome, and all of them were linked with the development of cancers [22]. Patients with non-alcoholic fatty liver disease (NAFLD) have a higher risk for gastrointestinal tumors and the underlying factor is most likely the close relationship between NAFLD and traits of the metabolic syndrome [23].
Of note, circulating chemerin was positively associated with all of the components of the metabolic syndrome [10,24,25]. Therefore, chemerin´s association with CRC may in part stem from the relationship between CRC and features of the metabolic syndrome [7,8,10,14,24,25]. Metabolic diseases also contribute to HCC development [22]. Whether chemerin correlates with traits of the metabolic syndrome in patients with cancers is, however, not well studied.
The liver is a common site of metastases from tumors arising in the gastrointestinal tract [26].
Here, we suggested that chemerin in serum may be appropriate to discriminate between colorectal liver metastases and HCC. A further aim was to identify associations of chemerin levels with components of the metabolic syndrome in patients with cancers.
2. Results
2.1. Association of Chemerin with Gender, Age and BMI
Serum chemerin was measured in 32 HCC, 36 CRC patients and 49 controls by ELISA (Table 1).
Controls were patients which came to the hospital because of mostly epigastric or stomach pain but without any cancers [27,28]. HCC patients had higher bilirubin and aminotransferase activities than CRC patients in accordance with previous studies [29]. Levels of γ -glutamyltransferase were also increased in HCC patients (Table 1). Control cohort had lower aminotransferase activities than the group of HCC patients (Table 1). There were fewer female patients in the HCC compared to the control group (Table 1).
Chemerin was comparable in male and female tumor patients in the whole cohort (p = 0.354) and in the individual subgroups (p = 0.976 for controls, p = 0.540 for CRC and p = 0.511 for HCC).
Levels neither correlated with age (r = 0.20, p = 0.10) nor BMI (r = − 0.27, p = 0.83) in the tumor patients.
This was also the case when the two cohorts of cancer patients were analyzed separately (CRC: age:
r = 0.06, p = 0.73; BMI r = 0.09, p = 0.61; HCC: age: r = 0.30, p = 0.10; BMI r = − 0.49, p = 0.79). In the
controls chemerin positively correlated with age (r = 0.368, p = 0.009) but not with BMI (r = 0.059,
p = 0.688).
Table 1. Characteristics of the study group.
Parameter HCC (32 Patients) CRC (36 Patients) Controls (49 Patients) p-Value
Male/Female 27/5 24/12 24/25 #*
Age (years) 63.5 (33.0–85.0) 67.0 (36.0–79.0)
3558.0 (21.0–88.0) BMI (kg
/m
2) 27.2 (19.7–44.6)
3126.6 (16.3–45.4) 26.2 (20.3–39.7) Prothrombin Time (%) 30.8 (26.7–307.0)
3028.8 (25.2–39.0)
35n.d.
Bilirubin (mg/dl) 0.6 (0.2–2.5)
310.5 (0.1–1.0)
350.5 (0.2–1.9) * ALT (U/l) 49.5 (17.0–378)
3028.0 (10.0–81.0)
3420.0 (12.0–44.0) **;#***
AST (U/l) 36.0 (14.0–502.0)
3120.5 (11.0–165.0)
3428.0 (20.0–48.0) *; #*
GGT (U/l) 105 (25–807)
2753 (19–590)
33n.d. **
T2D 15 6 9 **; #**
HC 3 8 8
HT 18 16 18
HU 4 3 n.d.
Tumor Grade: G1/G2/G3 5/20/4
291/23/1
25Primary Tumor
T1/T2/T3/T4 13/9/9/1 7/20/3/0
30Vascular Invasion No
/yes 20
/12 24/2
26TNM Stage
IA/IB/IIA/IIB/III/IV 14/8/7/2/1/0 1/4/13/9/1/1/2
31Median values and range, or number of patients per subgroup are shown. Uppercase numbers refer to the patients where this laboratory value/feature was known when data were unavailable for the whole cohort. Reference values for ALT and AST:<35 U/L for females and<50 U/L for males, for bilirubin: 0.2–1.4 mg/dL, for GGT:<
40 U/L for females and<60 U/l for males, for prothrombin time:<70%. Abbreviations: Alanine aminotransferase, ALT, aspartate aminotransferase, AST; body mass index, BMI; colorectal cancer, CRC;γ-glutamyltransferase, GGT;
hepatocellular carcinoma, HCC; hypercholesterolemia, HC; hypertension, HT; hyperuricemia, HU; not documented, n.d.; tumor-node-metastasis, TNM, type 2 diabetes, T2D. The respectivep-values are listed in the last column of the table. *p<0.05, **p<0.01 for comparison of CRC and HCC, #*p<0.05, #**p<0.01 and #***p<0.001 for comparison of controls and HCC patients.
2.2. Chemerin, CEA and CA19-9 in HCC and CRC Patients
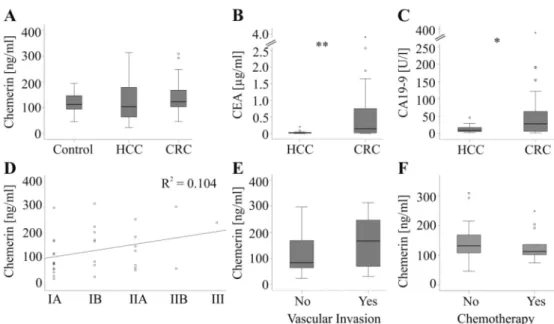
Chemerin levels were similar in controls, HCC and CRC patients (Figure 1A). The tumor marker alpha-fetoprotein (AFP; known from 25 HCC patients and 15 CRC patients) did not differ between the two cohorts of tumor patients (p = 0.07). CEA (known from 20 HCC patients and 32 CRC patients) and CA19-9 (known from 19 HCC patients and 31 CRC patients) were higher in CRC patients (Figure 1B,C).
Chemerin did not correlate with AFP (r = − 0.20, p = 0.22), CEA (r = 0.08, p = 0.57) and CA19-9 (r = 0.15, p = 0.31) in the cancer patients of the whole cohort and when both groups were analyzed separately (CRC: AFP r = − 0.08, p = 0.77, CEA r = 0.18, p = 0.34 and CA19-9 r = 0.31, p = 0.09;
HCC: AFP r = − 0.15 p = 0.48, CEA r = − 0.19, p = 0.41 and CA19-9 r = − 0.42, p = 0.07 ). In the HCC group chemerin was not associated with tumor size (r = 0.271, p = 0.13), grade (r = 0.044, p = 0.82) or tumor-node-metastasis (TNM) stage (Figure 1D). Patients without vascular invasion had serum chemerin similar to those with this development (Figure 1E).
For the CRC cohort, serum was collected shortly before hepatic resection of the metastases whereas
primary tumor was diagnosed up to six years earlier. Therefore, associations of serum chemerin with
tumor stage and grade of CRC were not calculated. In the CRC group, 13 patients received neoadjuvant
chemotherapy before liver resection which was, however, not associated with changes in chemerin
levels (Figure 1F).
Figure 1. Chemerin and tumor markers. (A) Chemerin in serum of 49 controls, 32 patients with hepatocellular carcinoma (HCC) and 36 patients with colorectal carcinoma (CRC). (B) CEA in 20 HCC and 32 CRC patients. (C) CA19-9 in 19 HCC and 31 CRC patients. (D) Correlation of chemerin with TNM stage in HCC patients (TNM stage: IA/IB/IIA/IIB/III, number of patients 14/8/7/2/1). (E) Chemerin in 20 HCC patients without and 12 HCC patients with vascular invasion. (F) Chemerin in 13 CRC patients with and 23 CRC patients without chemotherapy. * p < 0.05, ** p < 0.01.
2.3. Association of Chemerin with Type 2 Diabetes, Hypertension, Hypercholesterolemia and Hyperuricemia Circulating chemerin is associated with traits of the metabolic syndrome and some studies described higher levels in type 2 diabetes patients [12,24,30,31]. Chemerin was, however, not increased in those 21 cancer patients with type 2 diabetes compared to patients without this disease (Figure 2A).
Chemerin was not changed in the 15 type 2 diabetic HCC patients and the 6 CRC patients when both cohorts were analyzed separately (p = 0.25 for HCC and p = 0.47 for CRC patients). Likewise, the 9 type 2 diabetes patients of the control group did not have high chemerin serum levels (p = 0.09).
It should be noted that there were more type 2 diabetic patients in the HCC cohort than in the CRC and control group (Table 1).
Figure 2. Serum chemerin and comorbidities in tumor patients. (A) Chemerin in 21 patients with and 47 patients without type 2 diabetes. (B) Chemerin in 34 patients with and 34 patients without hypertension.
(C) Chemerin in 11 patients with and 57 patients without hypercholesterolemia. (D) Chemerin in seven patients with and 61 patients without hyperuricemia. * p < 0.05, ** p < 0.01.
Chemerin further regulated blood pressure, and was induced in hypertension [12]. Accordingly, chemerin was higher in the 34 patients with arterial hypertension (Figure 2B). In the HCC subgroup, the 18 hypertensive patients had higher chemerin than the 14 normotensive patients (p = 0.02).
Moreover, chemerin was elevated in the 16 hypertensive CRC patients when compared to the 20
normotensive patients (p = 0.03). Although chemerin positively correlated with systolic blood pressure in the control group (r = 0.337, p = 0.02) serum levels were not induced in the 18 hypertensive patients (p = 0.36).
In addition, hypercholesterolaemic (11 patients) and hyperuricaemic cancer patients (seven patients) had elevated systemic chemerin levels (Figure 2C,D). Again, in the control group chemerin was not changed in the eight patients with hypercholesterolaemia (p = 0.65). Distribution of hypercholesterolaemia was comparable in the three groups of patients. Hyperuricemia was only documented in the tumor patients with similar prevalence for CRC and HCC patients (Table 1).
In the HCC group hypercholesterolaemia was diagnosed in three patients and hyperuricaemia in four patients. In the CRC cohort eight patients were hypercholesterolaemic and three were hyperuricaemic. The low number of patients suffering from hypercholesterolaemia and hyperuricaemia in the subgroups may be the reason chemerin changes were not significant (HCC: p = 0.13 for hypercholesterolaemia and p = 0.12 for hyperuricaemia; CRC: p = 0.15 for hypercholesterolaemia and p = 0.06 for hyperuricaemia).
The strong association of serum chemerin with comorbidities led us to individually analyze serum chemerin in patients suffering from hypertension, hypercholesterolemia or hyperuricemia and patients, which did not have these comorbidities. In the latter cohort chemerin (p = 0.01) and CEA (p = 0.02) were higher in CRC patients whereas AFP (p = 0.03) was reduced (Figure 3A,B). In the patients suffering from these comorbidities chemerin was similar in both cohorts. CA19-9 (p = 0.008) was induced in CRC patients and AST (p < 0.001), ALT (p = 0.001) and GGT (p = 0.003) were lower than in the HCC patients (Figure 3C,D). Above all, chemerin did not differ between patients with liver tumors and non-tumorous controls in both subgroups (Figure 3A,C).
Figure 3. Serum chemerin and comorbidities. (A) Chemerin in 27 controls, 14 HCC and 18 CRC patients not suffering from hypertension, hypercholesterolemia or hyperuricemia. (B) Spider diagram presentation of chemerin, carcinoembryonic antigen (CEA), cancer antigen 19-9 (CA19-9), alpha-fetoprotein (AFP), γ-glutamyltransferase (GGT), alanine aminotransferase (ALT), aspartate aminotransferase (AST) and bilirubin in the serum of HCC and CRC patients described in A. The spider diagram shows the respective median values on a logarithmic scale. (C) Chemerin in 22 controls, 18 HCC and 18 CRC patients suffering from hypertension, hypercholesterolemia or hyperuricemia.
(D) Spider diagram presentation of chemerin, CEA, CA19-9, AFP, GGT, ALT, AST and bilirubin in the
serum of HCC and CRC patients described in C. The spider diagram shows the respective median
values on a logarithmic scale. * p < 0.05, ** p < 0.01, *** p < 0.001.
2.4. Association of Chemerin with Liver Dysfunction
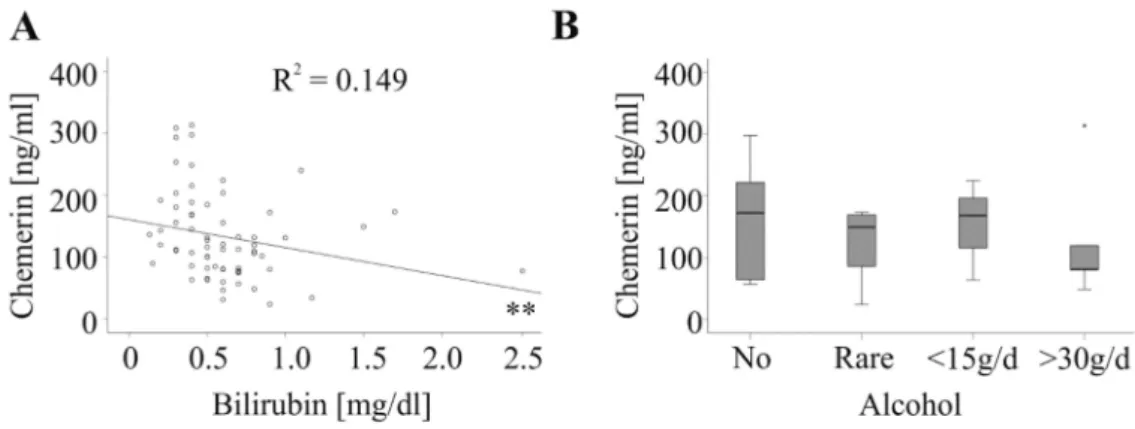
So far, the association of chemerin with hepatic injury was not resolved [21]. In the control group serum chemerin did not correlate with alanine aminotransferase, aspartate aminotransferase or bilirubin (Table 2). In the tumor patients, serum chemerin was not associated with alanine aminotransferase, aspartate aminotransferase, γ -glutamyltransferase or prothrombin time in the whole cohort, and when CRC and HCC patients were analyzed separately (Table 2). Negative correlations with bilirubin were identified in the whole cohort (Figure 4A and Table 2) and in CRC patients (Table 2).
Table 2. Correlation of serum chemerin with markers of liver function.
Correlation of Chemerin with: HCC CRC All Tumor Patients Controls Prothrombin Time (%) r = − 0.103
p = 0.587
r = − 0.262 p = 0.128
r = − 0.172
p = 0.170 n.d.
Bilirubin (mg/dL) r = − 0.316 p = 0.083
r = − 0.477 p = 0.004
r = − 0.386 p = 0.001
r = − 0.930 p = 0.540
ALT (U/L) r = − 0.103
p = 0.590
r = − 0.186 p = 0.292
r = − 0.174 p = 0.169
r = − 0.182 p = 0.215
AST (U/L) r = 0.100
p = 0.593
r = − 0.267 p = 0.127
r = − 0.070 p = 0.577
r = − 0.196 p = 0.181
GGT (U/L) r = 0.145
p = 0.469
r = − 0.298 p = 0.092
r = − 0.087
p = 0.511 n.d.
Correlation coefficient andp-values for the association of chemerin with prothrombin time, bilirubin, alanine aminotransferase (ALT), aspartate aminotransferase (AST) andγ-glutamyltransferase (GGT) are listed for the whole cohort, HCC and CRC patients and controls. Significant correlations are marked in bold. Not defined, n.d.